
Supply and Demand Analysis for Price Charts
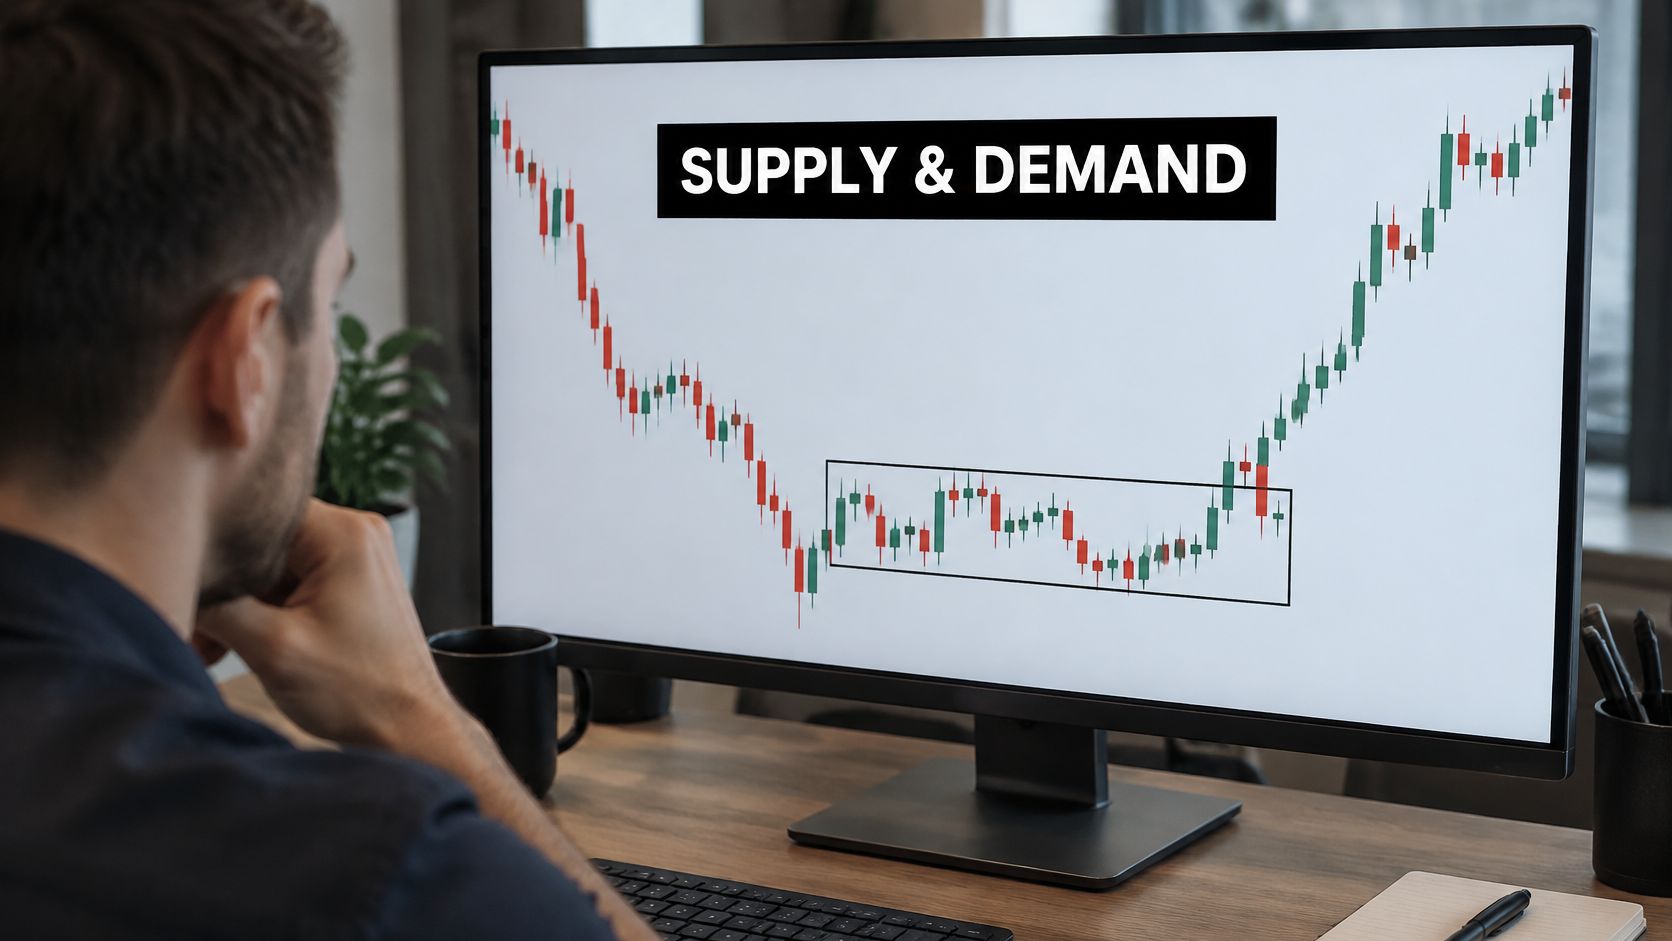
You've marked a demand zone, watched price race away, and waited for the return. Then price comes back, cuts straight through your rectangle, and leaves you wondering whether you drew it wrong or bought a move that was already finished.
Good supply and demand analysis separates those problems. You need a repeatable way to mark the base, a candle signal that justifies entry, and a filter for deciding whether the original move reflected a lasting shortage or a temporary rush to rebuild inventory.
What a Zone Shows That a Line Misses
A rally stalls at one tick, hesitates for four small candles, then breaks lower. A horizontal line saves only the stall. A zone saves the whole hesitation, the band where sell orders kept absorbing attempts to push higher.
That band is a candidate supply zone: the price area from which sellers became aggressive enough to turn trading down. Treat it as an area to investigate. Candles show where transacting changed, never how much unfilled interest still sits there.
A line assumes one exact price mattered. A zone acknowledges that participants transacted across a range, from the base's highest wick to its lowest wick. Width is the point. Orders fill through a band, and the first touch of that band can behave differently from the final edge.
The economics behind the rectangle
In a basic economic model, the supply curve slopes upward because producers are willing to supply more at higher prices. The demand curve slopes downward because buyers generally take less as prices increase. Equilibrium is where those quantities meet, and a shift in either curve changes that meeting point.
A candlestick chart records transactions during that adjustment without displaying the curves or explaining why participants changed their orders.
The World Bank's commodity-market analysis finds that global supply and demand shocks accounted for most commodity-price volatility since the mid-1990s. Production interruptions, consumption changes, weather, policy, and transport constraints can all change the balance.
Practical rule: Treat the departure as evidence that an imbalance existed; whether it persists is a separate question.
A sharp departure can reflect a real shortage or a rush to rebuild inventory. When forecasts conflict, I do not need the correct forecast. I need a marked zone, a rejection on the return, and a planned invalidation.
Context outside the chart still matters. The same discipline appears in credit research, where Visbanking shows how to identify predictive signals in banking before treating one indicator as decisive. On your chart, the equivalent is demanding confirmation instead of reading every fast rally as fresh demand.
The highlighted area below illustrates the distinction between a price region and a single support tick.
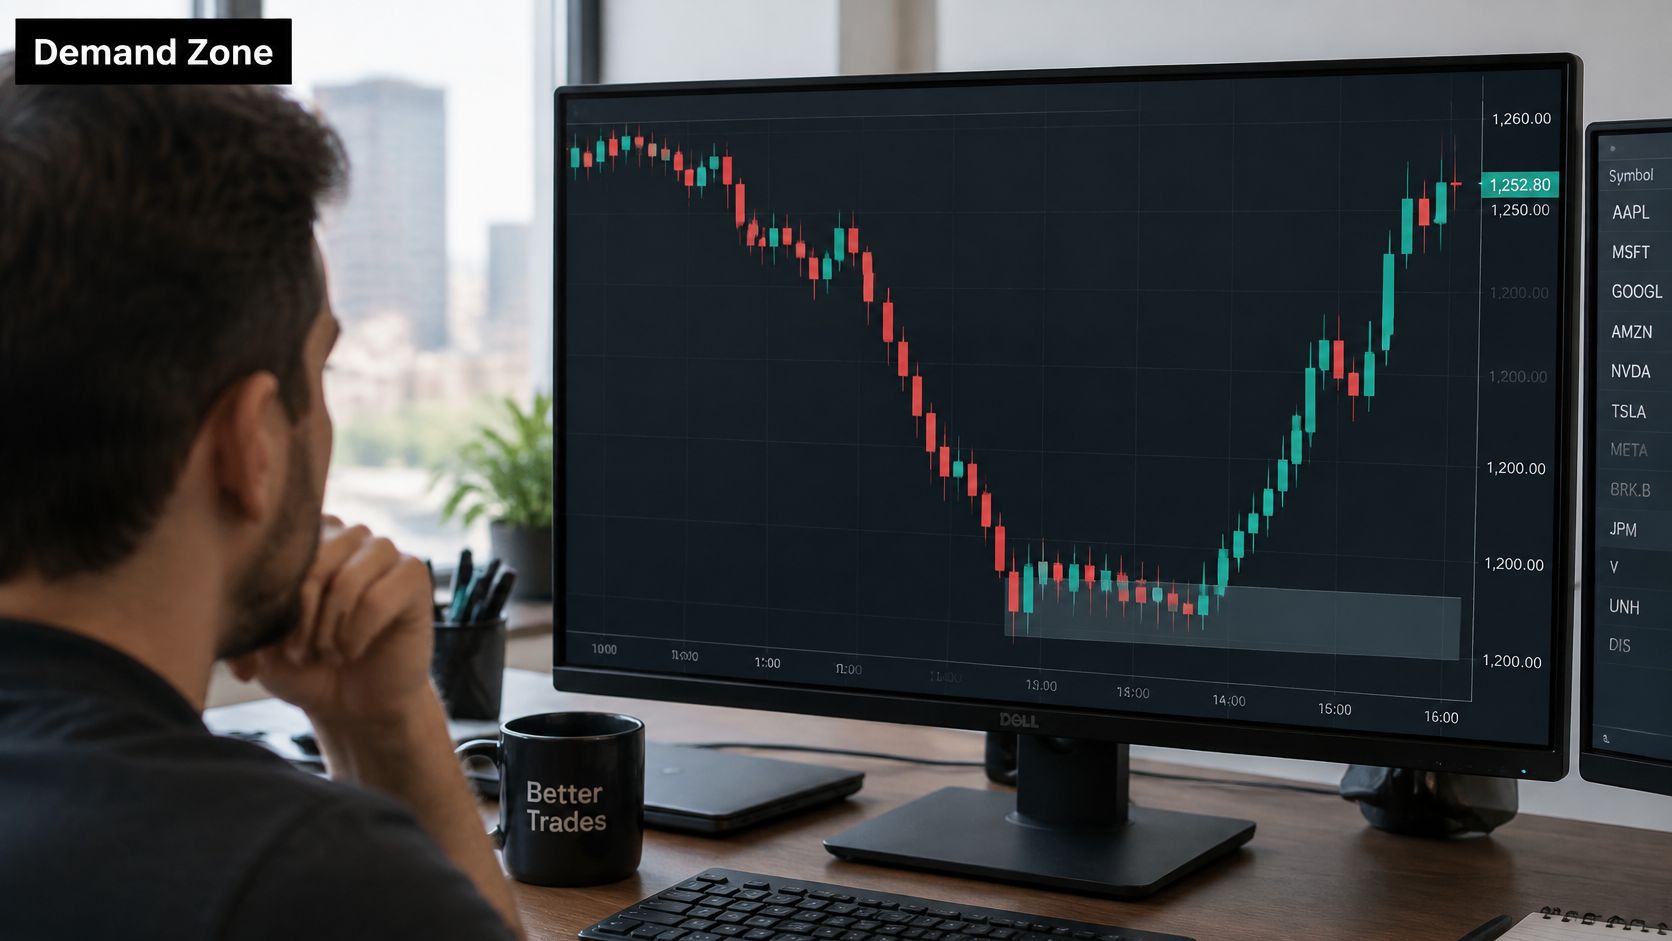
A candidate zone becomes a trade only when the return gives you an acceptable rejection and a defined exit.
How to Mark Supply and Demand Zones
A zone earns its rectangle when the pause is small, the exit is violent, and the return can be judged against fixed edges. Mark it on the execution chart first, then let the higher timeframe warn you about opposing supply or demand.
Choose your execution timeframe. Draw on the chart where you will place the entry. Use the next higher timeframe for context, especially to find opposing zones, rather than switching charts until the story looks bullish or bearish.
Find an explosive departure. Look for directional candles with substantial bodies, little overlap, and limited retracement. A slow staircase with deep pullbacks can travel far without leaving a clean imbalance.
Filter shock from restock. A durable break usually leaves the base behind quickly and holds outside it. A sharp push that slips back into the same pause may be inventory being refilled, so mark the box but downgrade it until separation is proven.
Box the base immediately before departure. Include the highest wick and lowest wick of the small pause candles. Do not stretch the rectangle backward to collect unrelated candles or trim an inconvenient wick to manufacture a tighter stop.
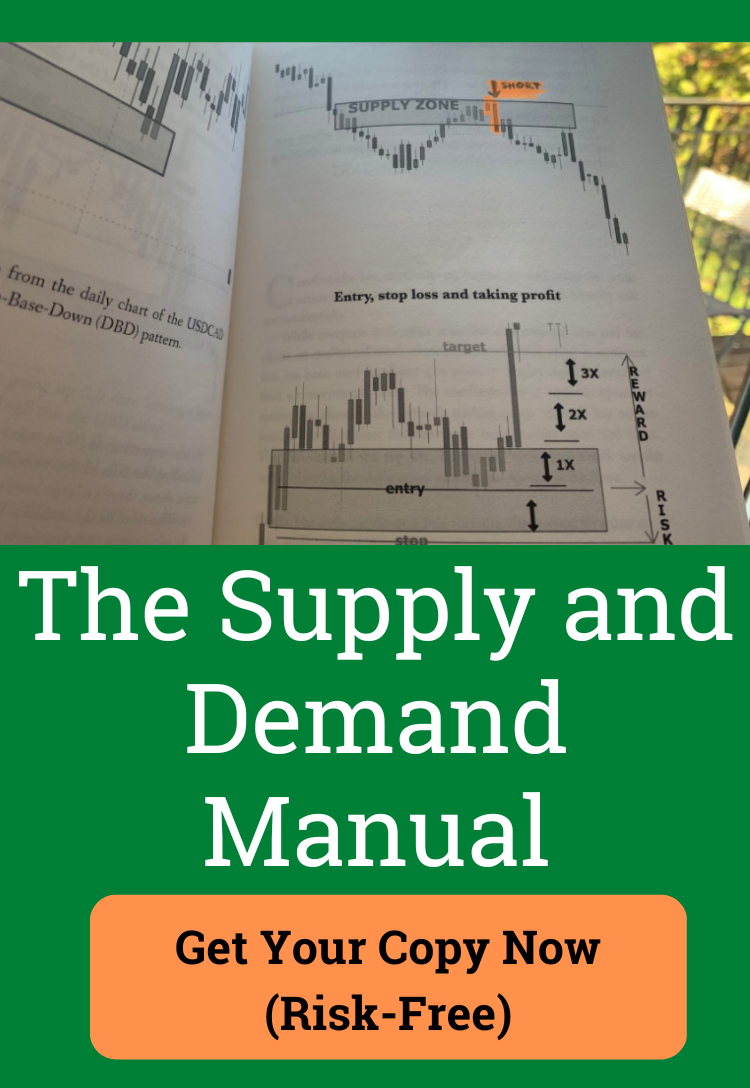
Name the pattern from the path through the base. Rally into a pause followed by a fast drop is rally-base-drop. Drop into a pause followed by a fast rally is drop-base-rally. The label describes the route; the trade still needs a return.
Record freshness. An untested base gets priority over a repeatedly visited area. Returns may execute previously resting orders, and candle size alone cannot reveal remaining order size. Treat freshness as a selection rule.
Put invalidation beyond the distal edge. The distal edge is the far side of the base relative to approaching price. Allow for spread and execution conditions so an ordinary test does not become an unnecessary exit.
Wait for the return with a written bias check. If fundamentals conflict, mark the opposing area and define the confirmation plus invalidation before price arrives. That keeps a forecast disagreement from becoming a forced buy or sell.
Four supply and demand patterns to mark
| Pattern | Zone | What you see | Quality test | Return idea |
|---|---|---|---|---|
| Rally-base-drop | Supply | Rally, tight base, fast drop away | Fresh base, departure stronger than the base | Sell only after a return and rejection |
| Drop-base-drop | Supply | Drop, pause, another fast drop | Base smaller than the leaving leg, ideally untested | Sell a return that fails inside the base |
| Drop-base-rally | Demand | Drop, tight base, fast rally away | Strong departure and a base not yet retested | Buy a return that holds the distal edge |
| Rally-base-rally | Demand | Rally, pause, another fast rally | Continuation base with little overlap in the leaving leg | Buy a first return, skip a base tested many times |
A continuation base uses the same boundaries as a reversal base. You need the same drawing discipline when price was already travelling in the departure direction.
Keep the rectangle honest
Reject a base whose vertical width exceeds the leaving leg. Reject a drift that never separates decisively from the pause. Otherwise almost any consolidation becomes a zone, and the method loses selectivity.
Physical-product pricing is a different layer from tradable levels. A retail page such as a silver jewelry seller's pricing guide describes consumer metal context, while your rectangle must come from the contract you can execute.
Finally, label both boundaries. The proximal edge is the nearest side as price approaches, where you begin watching the reaction. The distal edge is the far side, beyond which the rejection thesis fails. Keep the original box fixed so later candles are judged against the history you drew.
Candles That Confirm a Zone Return
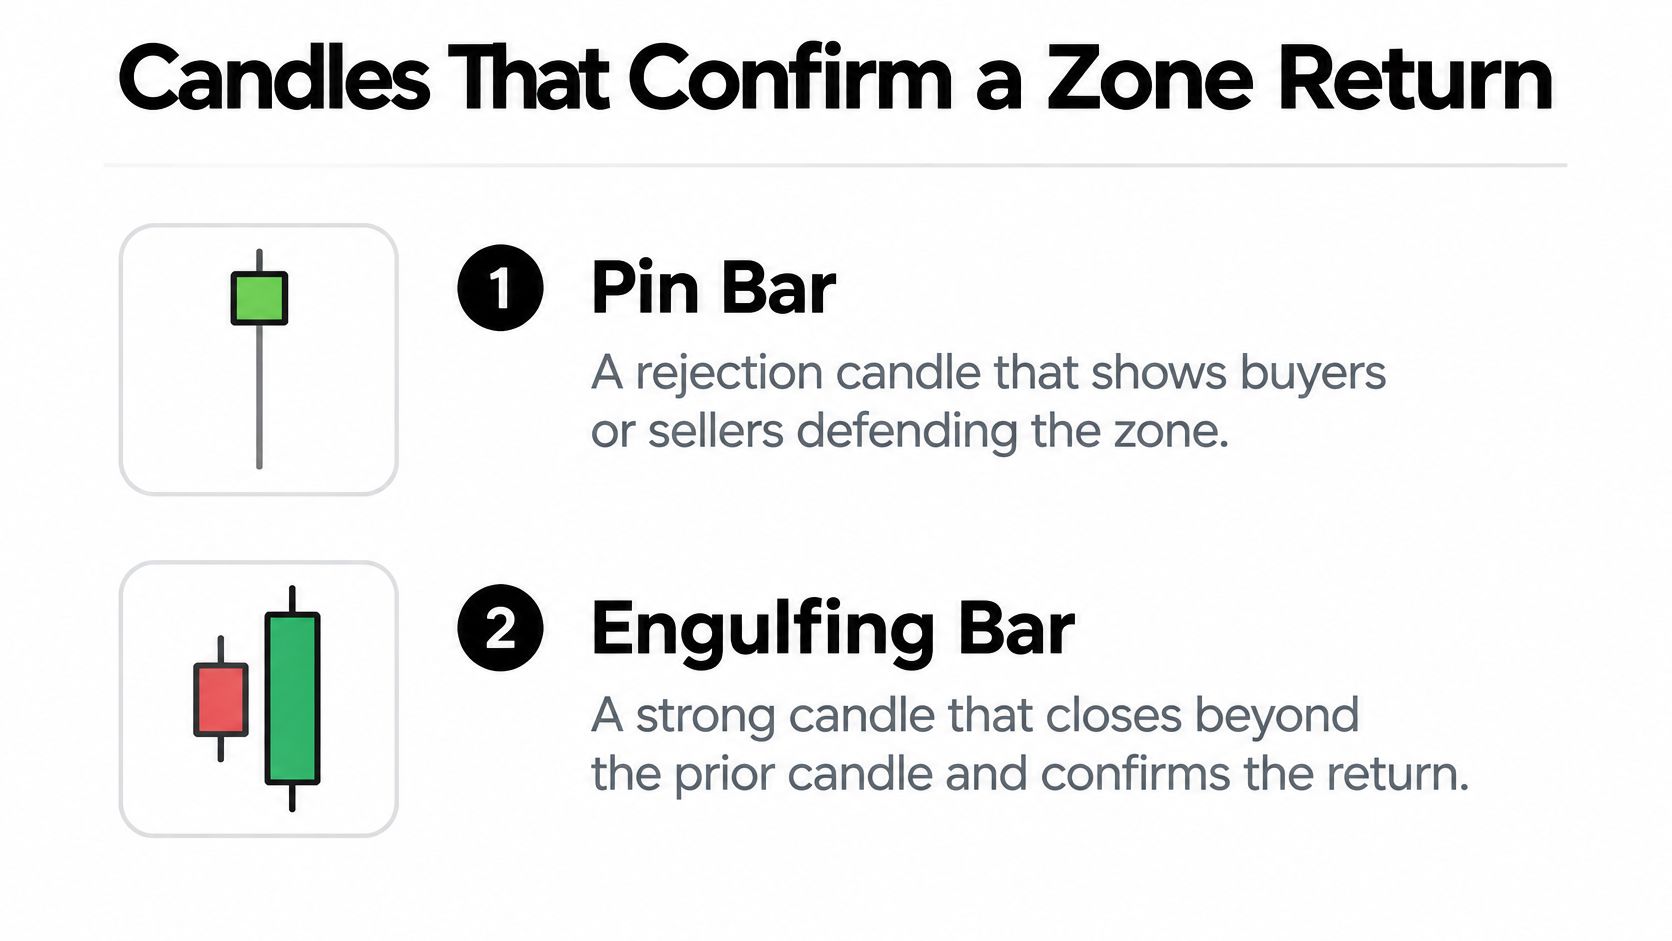
A bullish pin bar at demand has a prominent lower wick, a small body, and a close back inside or above the zone. Sellers pushed price lower during the candle, but buyers recovered much of that move before it closed. At supply, the bearish version has a prominent upper wick and a close away from the highs.
The wick alone isn't enough. A candle that probes below demand and finishes near its low shows little recovery, however dramatic its shape looks. The hammer candle pattern offers a useful comparison for understanding lower-price rejection without treating every long lower wick as a buy.
Match the candle to the location
A bullish engulfing bar at demand follows a test of the zone and has a body that covers the previous candle's body, closing above its upper boundary. The bearish counterpart at supply covers the previous body and closes below its lower boundary. Define engulfing by bodies consistently rather than switching between bodies and full candle ranges.
If you use the BOSS label for a bullish engulfing bar or strong rejection at demand, write the actual candle condition beside it. Apply the same discipline to the bearish counterpart at supply. A shorthand name shouldn't replace an observable rule.
These are the visual distinctions to check on the return.
Require rejection, not just contact
Apply the checks in order:
- Contact: The signal candle must trade into the marked zone. An engulfing bar floating in the middle of a range isn't confirmation of that zone.
- Close: The candle should reject the distal side rather than finish beyond it. A brief probe and recovery differs from sustained trading through the boundary.
- Follow-through: The next candle shouldn't immediately erase the rejection. If you require this extra confirmation, accept that your entry may be later and your available reward smaller.
A familiar candle pattern in the wrong location is still the wrong trade.
A large signal candle creates a practical problem: entering after its close can put the protective stop too far away. Don't move the stop inward merely to improve the displayed reward-to-risk ratio.
Either skip the entry or wait for a smaller rejection on a lower timeframe within the same zone. That alternative needs its own defined trigger and exit. It isn't permission to keep drilling down until any small candle looks supportive.
Why a Small Shock Can Reprice Fast
A small physical shortage can require a substantial price adjustment when producers can't quickly increase output and consumers can't easily reduce use. That's low short-run price elasticity. For a trader, the important question isn't whether a shock sounds large, but whether participants can respond within the intended holding period.
Mine capacity, planting decisions, vehicle replacement, and fuel switching operate on different schedules. A supply disruption that matters to a near-term trade may look less important once producers have time to invest or consumers can substitute.
How strongly quantity responds to price
The estimates below describe particular market responses, not expected returns from trading zones. Negative demand elasticity means consumption falls as price rises; positive supply elasticity means production increases.
| Market response | Short-run elasticity | What a price move implies | What to weight near term |
|---|---|---|---|
| Copper and zinc supply | Close to zero | Almost no additional mine output within a year, according to the IMF commodity-elasticity study | Disruptions, inventories, constrained capacity |
| Cereal supply | About 0.6 | A 10% price increase is associated with roughly 6% more output within a year | Planting decisions can ease the gap sooner |
| Gasoline demand | Estimates around -0.27 to -0.37 | A 10% real gasoline-price increase was associated with approximately 3.7% less short-run consumption in a tax-based study summarized by the Dallas Fed | Cars and commuting arrangements change slowly |
| Crude-oil and coal demand | Below 0.2 in magnitude | A 5% supply disruption can't quickly be offset through demand reduction and fuel switching, as discussed in the IMF commodity special feature | Stocks relative to operational requirements |
The cereal calculation uses the elasticity estimate in the preceding linked IMF study. It illustrates a response within that study's horizon, not a guarantee that a particular harvest will expand accordingly.
Inventory changes the urgency
Inventories buffer temporary gaps. Consumers can draw on stored material while production catches up. When usable stocks approach operational minimums, that buffer becomes less available, and buyers may need to compete more aggressively for immediate delivery.
Track production, consumption, and stocks together. Declining inventories alongside constrained output support a different near-term scenario from rising stocks during weak consumption, even if both charts contain an attractive demand rectangle.
Don't confuse this physical constraint with trading liquidity. Understanding what market liquidity means helps you distinguish difficulty sourcing the commodity from difficulty executing your position without an adverse price change.
For a short-duration setup, emphasize current disruptions, available inventory, and usable capacity. For a longer hold, allow for substitution, new investment, and additional production. A sound immediate shortage thesis can become a poor long-term buying argument if suppliers are already responding.
Price direction alone can't identify the cause. A rising chart might reflect stronger consumption, interrupted supply, inventory accumulation, or expectations about future availability. Require independent physical evidence before assigning an economic explanation to the departure.
Moves That Are Echoes Not Imbalances
Treating every sharp rally as fresh demand is an expensive habit. A wholesaler can place urgent replenishment orders even while final customers buy at an unchanged pace. Suppliers then see a surge in orders that overstates the change in underlying consumption.
In a 2025 bullwhip-effect simulation study, demand shocks increased cash-flow bullwhip amplification by 2 to 3.4 times, while information sharing reduced average cash-flow and inventory bullwhip effects by roughly 70% and 60%, respectively. These are simulation findings, not estimates of how far a traded price will move.
Separate final demand from replenishment
Say a distributor delays ordering while transport times are uncertain, then submits a large catch-up order when shipments resume. An upstream producer may interpret that order as stronger demand and increase its own purchases. The resulting scramble can fade once businesses restore their desired stocks.
Ask what changed beyond price. Are final users consuming more, are firms rebuilding inventory, or are deliveries merely arriving late? If the available information doesn't distinguish them, record the cause as uncertain rather than turning a plausible story into a fact.
Chart structure can help you reject a weak trade, but it can't diagnose the bullwhip effect. A messy base or failed return is a reason to stand aside, not proof of inventory restocking.
Zone mistakes and the fix
| What you see | Why it fails | Fix |
|---|---|---|
| Base already tested several times | Previously resting orders may have been filled | Skip it until a new explosive departure forms |
| Base wider than the leaving leg | The pause lacks a convincing directional departure | Don't box it |
| Stop placed inside the zone | Normal tests can reach the stop before rejecting | Put invalidation beyond the distal edge |
| Lower-timeframe zone into a higher-timeframe opposite zone | You're buying into supply or selling into demand | Resolve the higher-timeframe conflict first |
| Fast move after long lead times or stock rebuilding | It may reflect a bullwhip echo rather than final demand | Require return confirmation and reduce exposure |
Stacking indicators onto this decision doesn't resolve the missing information. Several indicators calculated from the same candles can agree while saying nothing about whether customers are consuming more material.
Uncertainty filter: If the explanation depends on replenishment or delayed shipments, demand stronger execution evidence rather than a more confident story.
A tight base and decisive rejection can make a setup tradable without proving the economic cause. Conversely, a compelling shortage narrative doesn't rescue a return that cuts through the zone without rejection. You're allowed to pass on the dramatic move and keep the explanation unresolved.
Worked Trades From Base to Invalidation
Consider a hypothetical market selling into a higher-timeframe demand base. A bullish engulfing bar tests the area and closes above its proximal edge. The setup now has a location, an observable trigger, and a boundary against which to judge failure.
Use the marked chart as a planning surface, not a prediction.

Demand and supply examples
For the demand trade, enter only after the required close and place the protective stop beyond the distal wick, allowing for execution conditions. Set the first target at the nearest opposing supply base. If that obstacle leaves inadequate reward relative to the stop distance and costs, pass.
For the supply example, price rallies into a rally-base-drop zone. A bearish pin bar enters through the proximal boundary, leaves an upper wick within the base, and closes below the proximal edge. The short thesis requires continued rejection below the far boundary, not merely a red candle.
Define whether a close beyond the distal edge cancels an unentered setup, but don't use a candle-close rule to postpone an existing protective stop. Stops can execute before a candle closes, and gaps or slippage can worsen the realized loss.
Our founder achieved a trade with a 1:77 risk-to-reward ratio in August 2024, closing within only 2 days of trading. That individual result isn't an appropriate target assumption for either example; judge the available opposing zone and actual execution risk.
When the oil forecasts disagree
The IEA's May 2025 Oil Market Report projected average global oil-demand growth of 740,000 barrels per day in 2025 and 760,000 barrels per day in 2026. Separately, the World Bank's April 2025 outlook estimated that global oil supply would exceed demand by 0.7 million barrels per day in 2025.
Those measures aren't interchangeable: demand growth is a change in consumption, while a surplus is a gap between supply and demand. The IEF's September 2026 comparison of oil-market projections describes a spread of approximately 4.2 million barrels per day between major agencies' demand estimates for the third quarter of 2026.
Don't average unlike measures into a buy-or-sell arrow. Separate observed physical balances from projected growth, and compare forecast assumptions before treating disagreement as an opportunity.
For a visual explanation of the price-action approach, use the accompanying video.
Write competing scenarios: rejection holds, price accepts beyond the zone, or price remains indecisive. Require your chosen candle confirmation, reduce size when the fundamental cases conflict, and stay flat when the chart supplies no clean trigger.
Buyers can lift prices despite a projected surplus if they anticipate later scarcity. Sellers can push prices lower despite firm consumption when inventories and available capacity look sufficient. Neither possibility removes the need for an executable invalidation.
Check the Zone Before You Risk
Before clicking, you should be able to describe the setup without adding a new line, changing timeframes, or searching for a supportive headline. If you can't explain why the return qualifies, the original departure isn't enough.
Use this pre-trade check:
- Pattern: Can you name the reversal or continuation base without forcing the candles into it?
- Freshness: Is the area untested, or are you relying on a repeatedly revisited level?
- Confirmation: Which completed candle justifies entry at this location?
- Invalidation: Where does the rejection thesis fail, and where will the protective stop sit?
- Context: Does the higher-timeframe structure leave room before an opposing zone?
Practice the decision, including the skips
Size from the distance between entry and invalidation, not from enthusiasm about the departure. Use the risk-to-reward calculation to compare the planned loss with the achievable target, including trading costs. A conflicting fundamental story can justify less exposure or no position.
Replay a small batch of historical zones on a naked chart before using live size. Hide future candles, record the decision at the return, then reveal the outcome. Keep separate notes for valid losses, rule-breaking entries, and skipped moves that appeared to be replenishment echoes.
Our Ultimate Supply and Demand Course teaches the fundamentals of Supply and Demand Trading, while our free trading potential quiz produces a custom report based on your unique strengths.
All content from Colibri Trader Limited is strictly educational and informational, not financial, investment, legal, or tax advice. Past results aren't necessarily indicative of future results, and futures, forex, CFDs, and spot currency trading can produce large losses as well as gains.
Build a repeatable zone routine with the Ultimate Supply and Demand Course, or take the free trading potential quiz to get a strengths-based custom report. Visit Colibri Trader and choose the learning path that fits the chart decisions you need to improve.