
Flag Pattern Trading: A Practical Price Action Guide
You've watched it happen twice in one session. Price rips higher, drifts sideways for a few candles, then breaks out and runs without you. The next time you see the same shape, you buy the break, and price snaps straight back through your stop. That's the frustration at the center of flag pattern trading. The shape is easy to spot. Knowing whether the pause is real, and whether the trade has positive expectancy after costs, takes a different set of rules.
What a Flag Pattern Actually Looks Like on the Chart
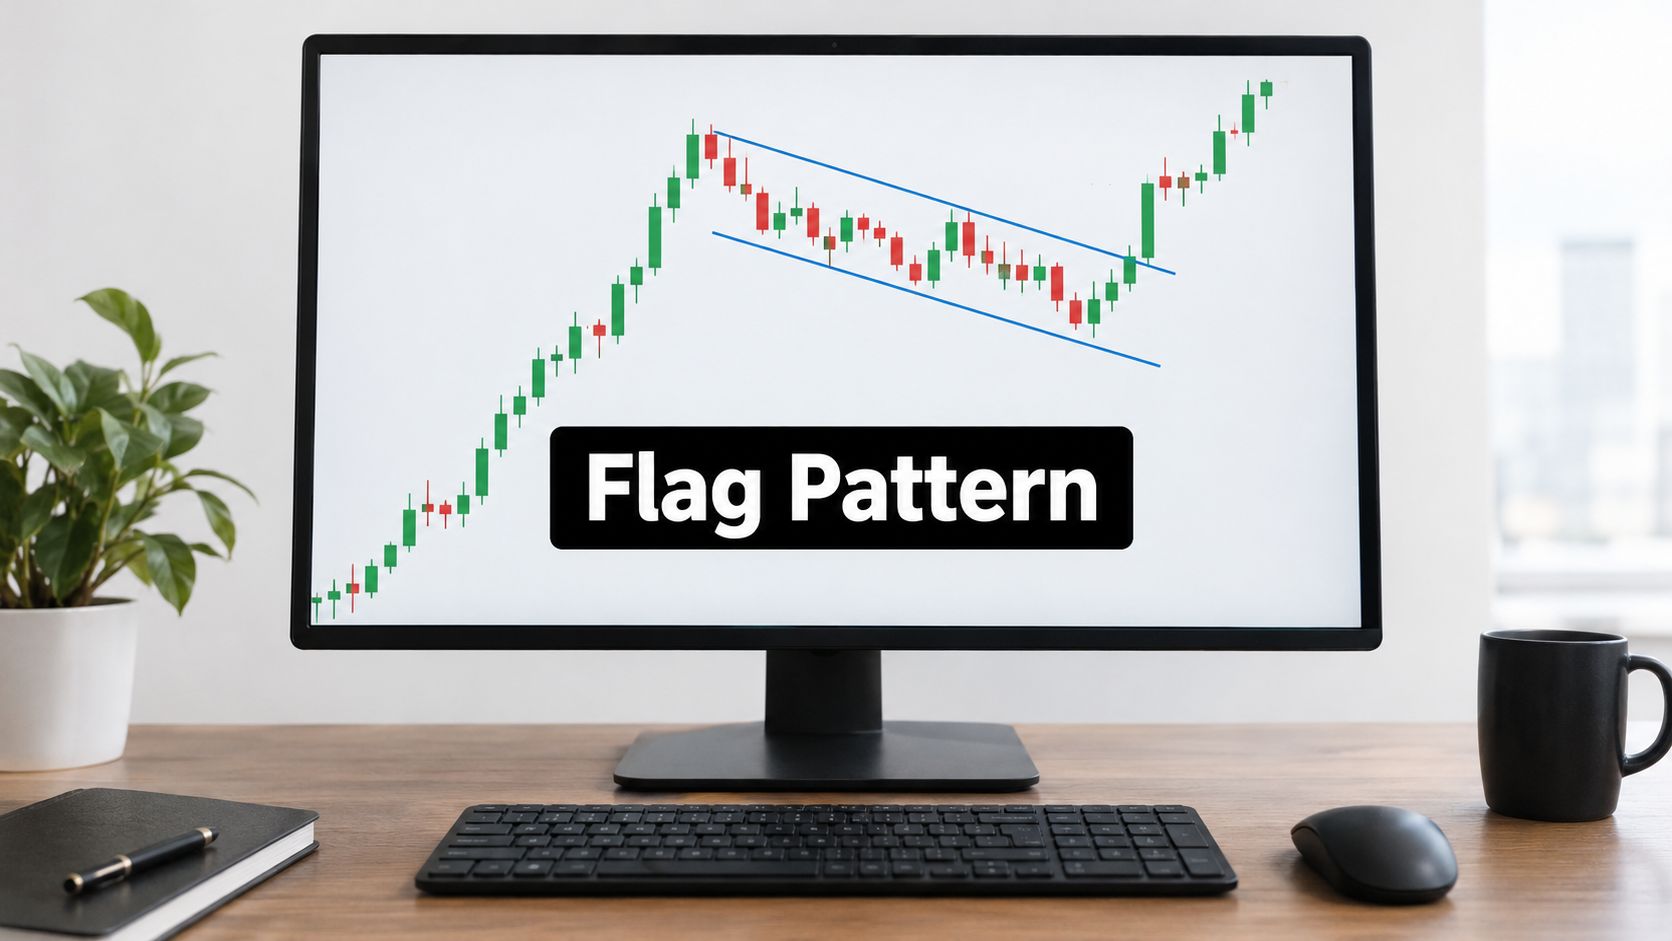
A clean bull flag starts with urgency. Buyers lift offers candle after candle, closes stack near the highs, and pullbacks inside the move barely last a bar. Then the push stalls. Candles get smaller, highs step down gently, lows step down with them, and price slides inside a narrow channel instead of collapsing. When a candle finally closes back through the top of that channel, buyers who missed the first leg get their second chance.
The fake version looks similar at a glance, which is why traders get trapped. The initial move is choppy rather than forceful, the drift lower keeps widening, and the supposed breakout is one long wick that closes back inside the range. You're not looking at a pause. You're looking at distribution starting.
The Two Parts That Matter
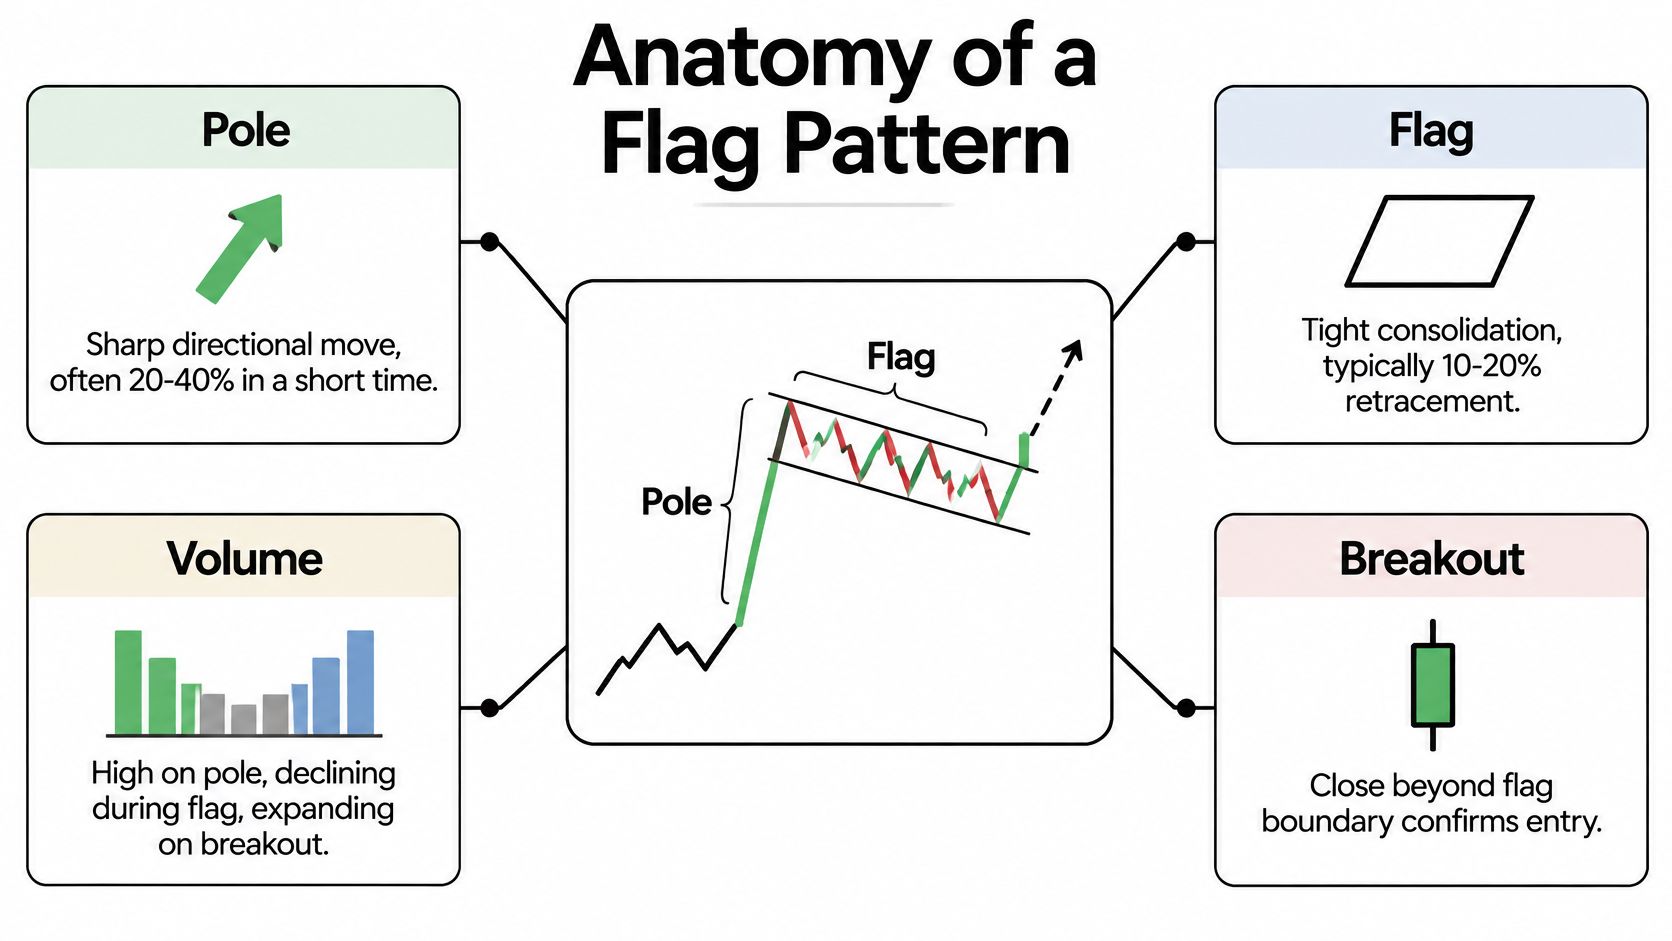
Every flag has the same anatomy. The flagpole is a sharp directional move, and the flag is a relatively brief, countertrend consolidation that follows it, a structure described in academic work on the classic flag formation. A bull flag pairs an advance with a downward or horizontal consolidation and an upside breakout. A bear flag reverses each direction.
That separation is the point. The pole shows forceful repricing. The flag shows temporary profit taking or equilibrium while neither side commits new size. If the pole wasn't forceful, the flag has nothing to continue.
Pause or Reversal
Ask one question while the flag forms. Are countertrend candles making real progress, or are they just drifting? In a genuine pause, sellers in a bull flag push price down slowly, overlap is heavy, and each dip gets absorbed before it can accelerate. In a reversal, countertrend candles expand, closes sit near their lows, and the channel stops containing price.
If you have to redraw the channel twice to keep the flag alive, it isn't a flag anymore.
Flags appear in equities, currencies, commodities, and futures because the underlying behavior, impulse then pause, isn't market specific. Understanding how consolidation in trading works more broadly helps here, because a flag is only one type of pause. Visual recognition alone doesn't give you an edge. It gives you a candidate that still needs an entry trigger, a stop, and a reason to believe the next leg can pay for the risk.
A Four-Step Checklist for Spotting Valid Flags
Don't grade a flag on how pretty it looks. Grade it against four checks, in order, and walk away when one fails.
1. Confirm the pole was an impulse. Look for a run of directional candles with limited overlap, closes near the extreme of the move, and a clear change in pace versus the bars before it. A stair step grind higher with deep pullbacks between each push doesn't qualify. There's no compressed energy to release.
2. Validate the consolidation. The flag should stay narrow, brief, and countertrend. It drifts against the pole or moves sideways, gives back only a modest part of the advance, and doesn't linger so long that it becomes a range in its own right. Depth matters because deep retracements tell you the other side is willing to sell aggressively, not just take profit.
3. Draw parallel boundaries and leave them alone. Connect the flag's highs and lows. You want two roughly parallel lines containing the drift. If the lines converge sharply, you're looking at a pennant, which behaves differently at the break. If they widen, volatility is expanding inside what's supposed to be a pause, and that's a warning.
4. Locate the breakout candle in advance. Decide before it prints what counts. For most traders that's a close beyond the flag boundary, not a wick through it. Mark the exact price, where your stop would sit, and whether the distance between them is small enough to justify the trade. If the stop has to sit so far away that the target barely covers it, the setup fails on math, not shape.
Bull Flag vs Bear Flag at a Glance
| Element | Bull Flag | Bear Flag |
|---|---|---|
| Pole direction | Sharp move up | Sharp move down |
| Flag drift | Downward or sideways | Upward or sideways |
| Breakout trigger | Close above upper boundary | Close below lower boundary |
| Stop location | Below flag low | Above flag high |
| Volume behavior | Contracts in flag, expands on break | Contracts in flag, expands on break |
Run this the way you'd run any repeatable preparation process. Traders who keep paperwork for other decisions organized in advance, the same logic behind an 8-item loan document checklist from Business Loan Warrior, make fewer emotional calls in the moment. Your version fits on an index card. Pole, consolidation, boundaries, trigger.
Two practical notes from the desk. First, the best flags often form early in a move, not after several poles have already extended price. Late flags ask tired buyers to do fresh work. Second, volume should quiet down inside the flag. If participation stays heavy while price goes nowhere, someone is using the pause to exit, and the breakout has to fight through that supply.
Choosing the Right Timeframe for Each Part of the Trade
Most timeframe mistakes come from asking one chart to do three jobs. Split the work.
The higher timeframe answers one question. Which direction has real sponsorship? If daily candles are making higher highs after a strong advance, a bull flag on your trading chart is aligned with that sponsorship. If the daily chart is rolling over into resistance, the same intraday shape is a countertrend bounce wearing a flag costume. Don't trade it the same way, and don't size it the same way.
The trading timeframe is where the flag lives. This is the chart where you draw boundaries, define the breakout close, and place the stop. Pick the timeframe where the pole and flag print as clean, readable candles, then stay there. Switching charts mid setup because a lower timeframe looks more exciting is how traders talk themselves into early entries.
How the Same Flag Changes With the Chart
On a five minute chart, a pole can be a single news driven thrust and the flag a short breather before the next push. Everything happens fast, spreads and slippage eat a larger share of the move, and a breakout candle can travel a long way before you get filled. These flags suit active traders who can watch the break and react without hesitation.
On a daily chart, the pole unfolds over several sessions and the flag becomes a multi day digestion. You get time to plan, stops sit further away in absolute terms, and overnight gaps become part of the risk you accept. The structure reads cleaner because intraday noise disappears, but your capital is committed longer and a failed daily breakout costs more patience to exit.
Weekly flags exist, but they're swing structures, not pattern trades for most accounts. Treat them as context. A weekly bull flag tells you the path of least resistance, then you drop down to find an executable entry.
A Simple Switching Rule
- Higher timeframe first: Confirm trend direction and nearby support or resistance.
- Trading timeframe second: Define the flag, trigger, stop, and target.
- Lower timeframe last: Refine the entry only after the structure above is intact.
That hierarchy is the practical core of technical analysis using multiple timeframes. The lower timeframe never gets to overrule the higher one. It only helps you buy the retest a little cheaper or spot a weak breakout candle before you commit.
Entries, Stops, Targets, and Trade Management
Walk through a bull flag the way it unfolds. A stock gaps up on news, pushes hard through the morning, then starts drifting down on smaller candles after lunch. You draw the channel, mark the upper boundary, and wait. You don't buy the drift. You don't anticipate. The trade doesn't exist until price proves the pause is over.
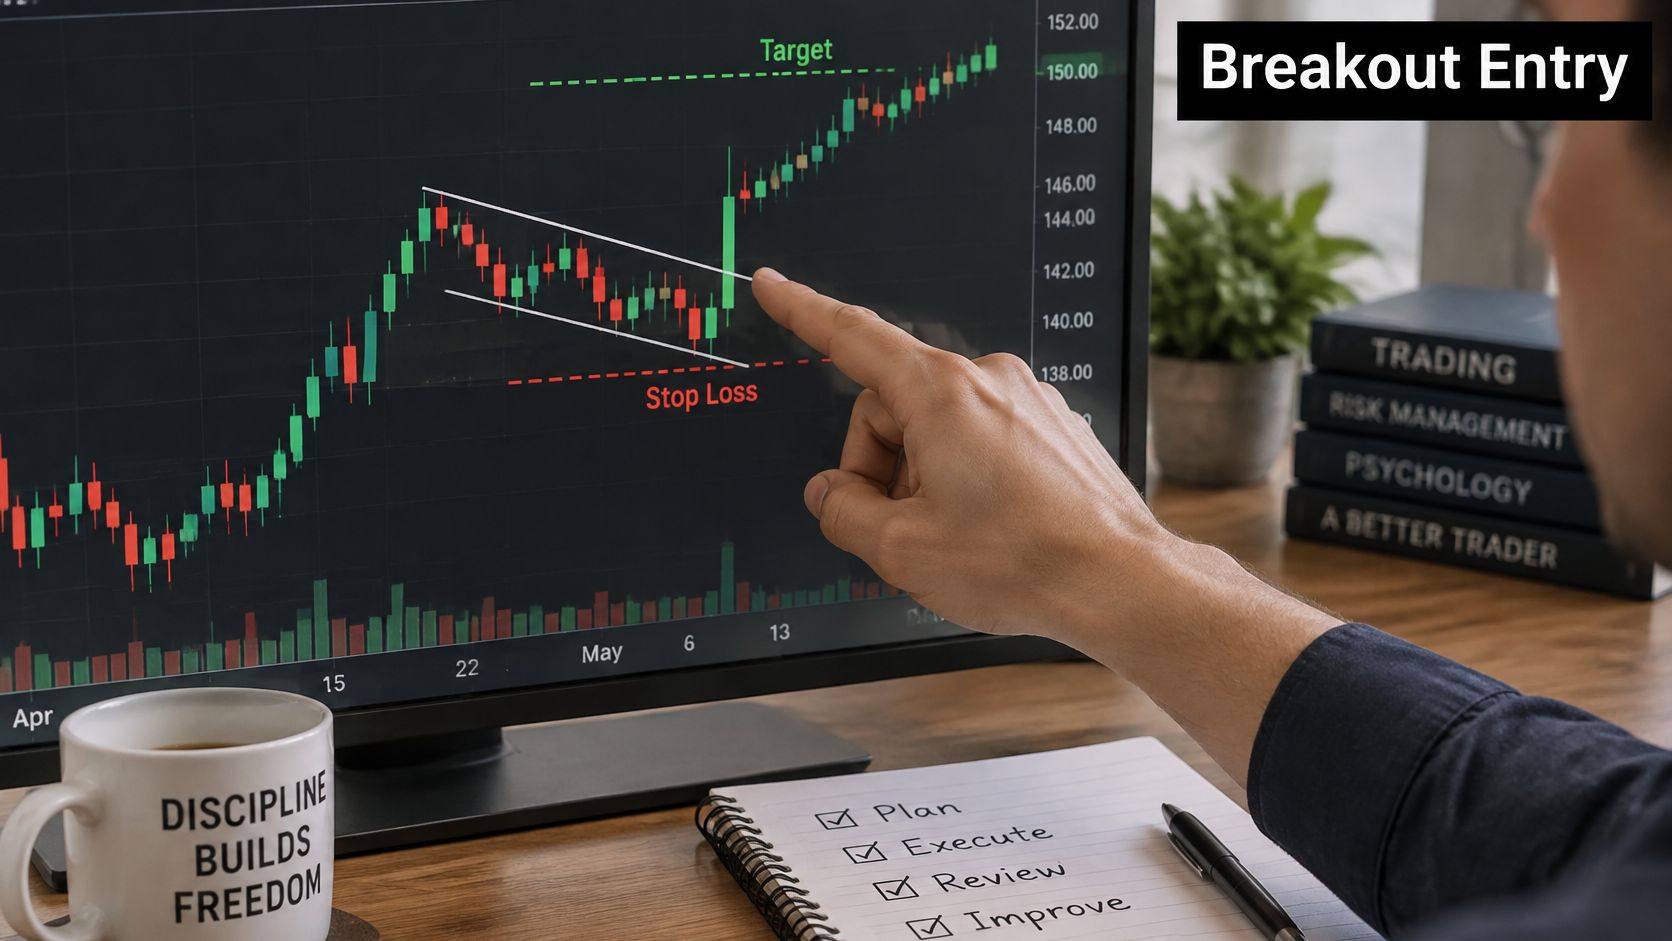
When a candle pushes through the boundary and closes beyond it, that's your trigger. The chart below shows that moment, the breakout candle clearing the flag with the target projected above it.
Where the Stop Belongs
Your stop goes where the idea is wrong, not where the pain feels acceptable. For a bull flag, that's below the flag low. If price returns through the entire consolidation and takes out its low, the pause has become something else and you have no reason to stay. For a bear flag, mirror it above the flag high.
This placement also sizes the trade for you. Measure entry to stop, decide your fixed risk per trade, and let that distance set your position size. If the flag is wide and sloppy, size shrinks or you pass. Tightening the stop inside the channel to force a bigger position just means normal noise stops you out before the idea can work.
Projecting the Target
The conventional objective projects the height of the flagpole from the breakout point. Treat it as a reference, not a promise. I scale out part of the position as price approaches the projection, because flags often stall near it while early buyers take profit, and I trail the rest behind recent swing lows for longs or swing highs for shorts.
Trailing works candle by candle. Each time price makes a new push and then holds a higher low, the stop moves under that low. You're giving the continuation room to breathe while locking in the logic that a lower low ends the sequence.
Watch a breakout and retest sequence play out in real time before you rely on still charts alone.
Handling the Failed Breakout
Now the bear flag version, because failure teaches faster. Price drops sharply, bounces weakly inside a rising channel, then a candle closes below the lower boundary. You short the break with a stop above the flag high. Two candles later, price reclaims the boundary and closes back inside the channel.
That's your answer. A close back inside the flag invalidates the breakout, and waiting for the stop above the high just pays extra tuition. Exit, log it, and stand aside. Re entry is allowed only if price rebuilds, holds outside the boundary on a retest, and breaks again with a fresh trigger candle. The retest that holds is often the better trade anyway. Sellers defended the broken line, buyers who chased the reclaim are trapped, and your stop sits close, just beyond the retest extreme.
Practical rule: One failed break is information. Chasing the second and third poke through the same boundary without a rebuild is how a small loss becomes a session.
Colibri Trader covers this entry, stop, and target sequence in its price action material on bull and bear flags, and it's worth comparing that framework against your own journal rather than adopting any version on faith.
Where Flag Trades Quietly Fail
Flag losses rarely come from one dramatic mistake. They come from four quiet ones that repeat.
The sloped flag that's a trend change. In a bull flag, the drift lower should look reluctant. When down candles start expanding, closing on their lows, and breaking the channel's lower boundary with follow through, sellers aren't pausing. They're taking control. The rule from the checklist saves you here. If the boundaries stop containing price, the setup is gone, whatever you drew earlier.
The consolidation that's too deep or too long. A flag that gives back most of the pole has already told you demand couldn't hold the move. A flag that drags on bar after bar stops being compressed energy and becomes a range where both sides are comfortable. Breakouts from comfortable ranges need fresh catalysts, and your pattern isn't one.
The laptop setup below, chart on screen and checklist on paper, is the unglamorous fix. The checks happen before the order, not during the post mortem.
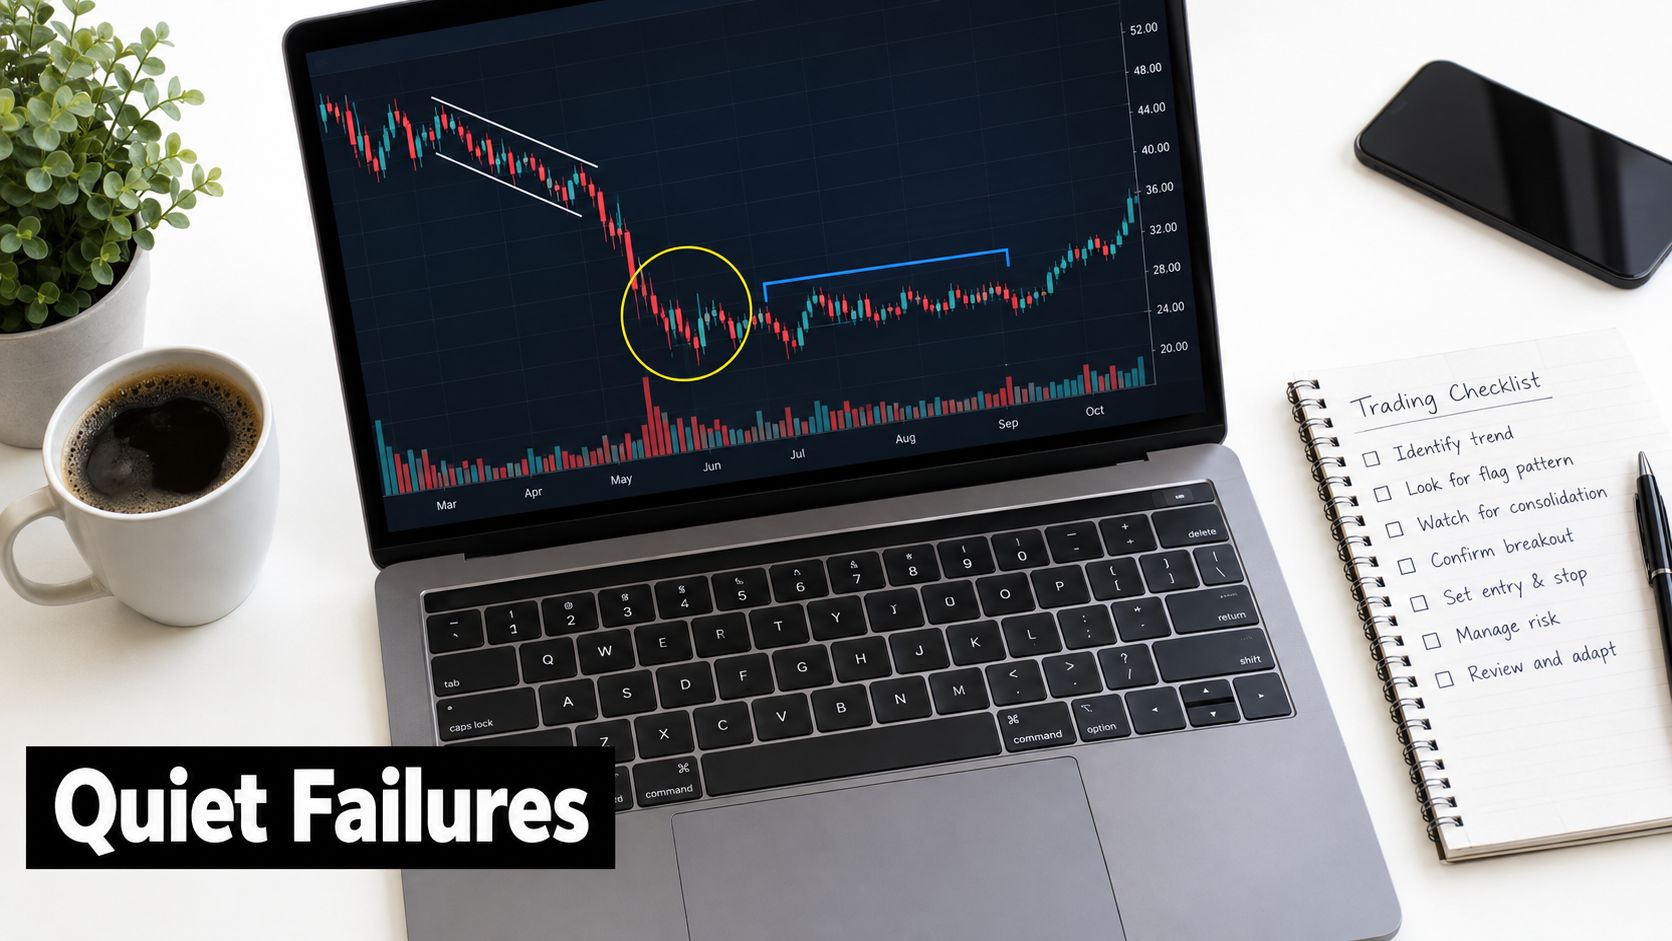
The breakout nobody showed up for. Volume is conditional evidence, not a binary stamp. Algorithmic analysis of breakouts accompanied by volume above 2.5 times the asset's average achieved a 58% market-beat rate over a two-week horizon across more than 137,000 detected patterns, as summarized in research on the predictive power of technical chart patterns. Read that carefully. Even strong volume breakouts didn't win by a landslide, and predictive power shifts with market regime and microstructure. A thin volume poke through the boundary, especially into a news spike or a widening spread, deserves a pass or a much smaller position while you wait for the retest.
The stop at the wrong boundary. Traders place stops just inside the channel to shrink risk, then get wicked out by the retest that healthy breakouts often make. Or they place it beyond the pole's origin and turn a pattern trade into an open ended hope. The flag low or high is the logical line. Use it and size accordingly.
There's a sobering baseline under all of this. Roughly 97% of persistent day traders lost money net of costs in one study covered in that same research summary. Avoiding low quality flags isn't caution for its own sake. It's where most of the expectancy comes from.
Backtesting Flags the Way a Trader Would
You'll find flag win rates online that can't all be true at once. One public source cites an approximately 4% failure rate for bullish flags, while another synthesis reports standard bullish flags fail roughly 44–45% of the time, a contradiction highlighted in an overview of chart pattern reliability claims. Both numbers might describe their own samples. Different markets, timeframes, entry rules, and targets produce different answers, which is exactly why borrowing someone else's win rate is useless for your account.
The published research cuts both ways, and that's healthy. A template matching study of the Shanghai Stock Exchange Composite Index from 1991 through 2021 reported bull flag buy signal direction accuracy of approximately 80%, with average return per buy signal reaching 9.76% under its best reported condition, as documented in quantitative research on flag pattern trading rules. Those are model specific historical results, not a probability you can attach to the flag on your screen this morning.
What Your Own Test Needs
- Objective definitions: Write down what qualifies as a pole, how deep and long the flag can be, and the exact breakout trigger before you look at outcomes.
- Full cost accounting: Include spread, commissions, slippage, and gaps. A setup that works gross and dies net isn't a setup.
- Out of sample discipline: Build rules on one period, judge them on another you didn't tune against.
- Complete records: Log failed breakouts and skipped trades, not just the winners you remember.
Selectivity will change your results more than you expect. In one published test, a stricter threshold identified 483 patterns, only 0.53% of the total sample, while a looser one found 1,402 patterns, or 1.54%, from that same body of quantitative flag research. Tighten your filters and your win rate may rise while your trade count collapses. Loosen them and you'll always be in a trade, mostly in mediocrity. Neither is automatically better. Expectancy per trade, drawdown, and how the rules hold up across equities, forex, futures, and crypto are what matter.
If you haven't built a testing process yet, work through a structured approach to backtesting a trading strategy and apply it to one market and one timeframe first. Twenty honest, fully costed flag trades in a journal will teach you more than another month of pattern spotting.
Your Flag Trading Checklist and Key Questions Answered
Tape this next to the screen. Pole was a genuine impulse. Flag stayed narrow, brief, and inside parallel boundaries. Higher timeframe agrees with the direction. Trigger is a close beyond the boundary, with participation behind it. Stop sits beyond the flag extreme, target is projected from the pole, and position size comes from the distance between entry and stop.
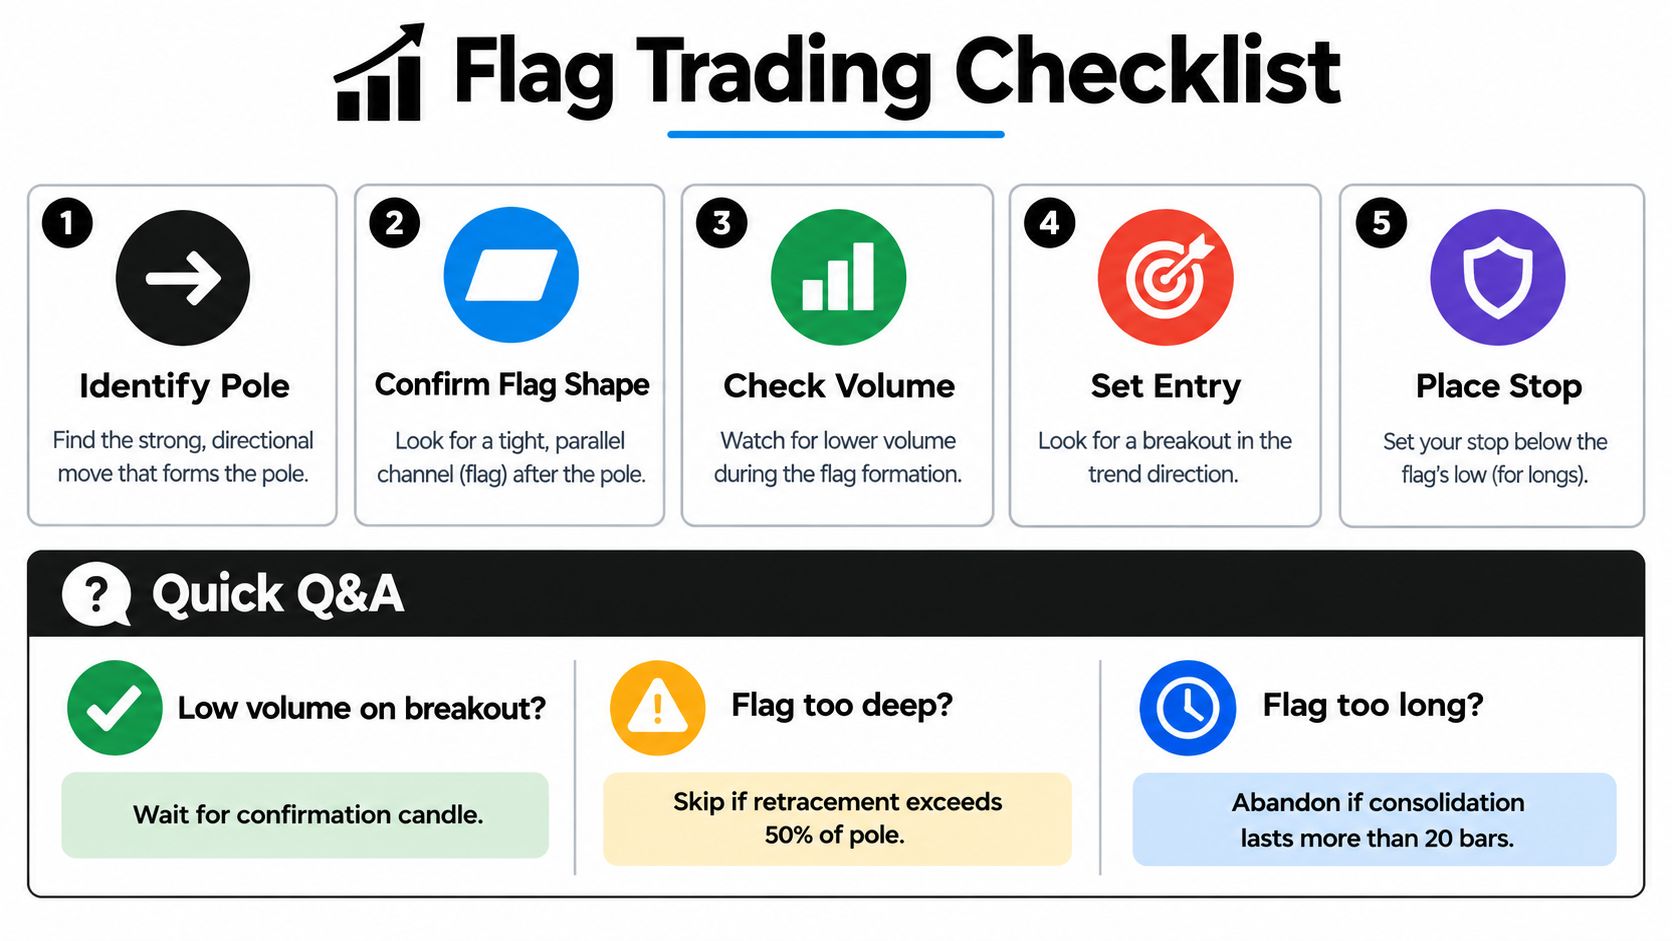
What if volume is fragmented or absent? In forex and crypto, volume doesn't come from one exchange, so treat it as supporting evidence only. Lean harder on the breakout close, the retest, and spread behavior.
What if breakouts keep failing? Cut size, don't loosen stops. Repeated failures usually mean the regime changed or you're trading late stage poles. Step back to the higher timeframe and recheck alignment.
What converts recognition into results? Fewer, better documented trades. Journal every flag you take and every one you skip, with the reason. Consistency comes from that feedback loop, not from finding more shapes.
If you want to build this flag framework into a complete price action routine, Colibri Trader offers structured programs on patterns, supply and demand, and disciplined trade management, plus a free Trading Potential Quiz to assess where you stand. Start with the quiz, work through the flag material with your journal open, and test every rule on your own market before risking real capital.