
Morning Star Pattern: A Trader’s Practical Guide
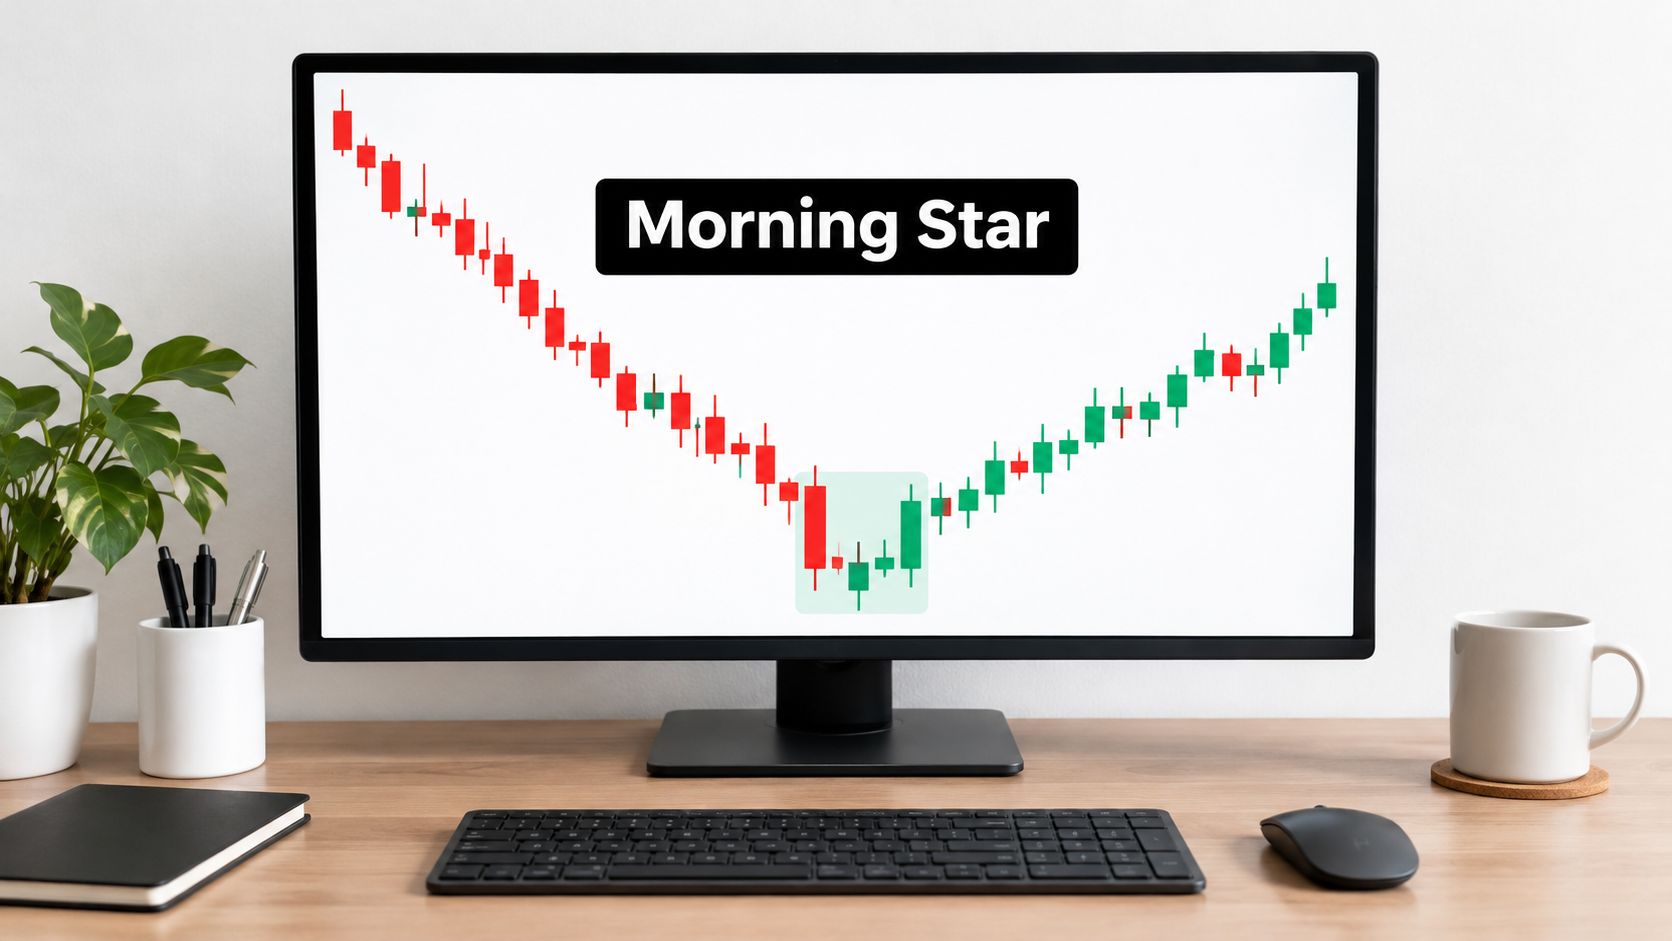
You've watched the same market fall for days. Every bounce gets sold, every green candle looks like a trap, and you're stuck between wanting to catch the turn and not wanting to stand in front of a falling knife. That waiting is exactly where the Morning Star pattern earns its keep. It doesn't ask you to guess the bottom. It asks you to wait until sellers lose control, buyers prove they've taken it, and only then to act.
The Morning Star Pattern in Plain English
Picture a market sliding lower session after session. Sellers are confident. Buyers who try to step in early get pushed back down, so others stop trying. Then something subtle changes. Price still makes a low, but it stops travelling. The selling doesn't get stronger. It hesitates.
That hesitation matters because downtrends don't end with a single heroic candle very often. They end when the side that was winning can't finish the job. In a morning star, you see that change happen across three candles instead of having to imagine it from one.
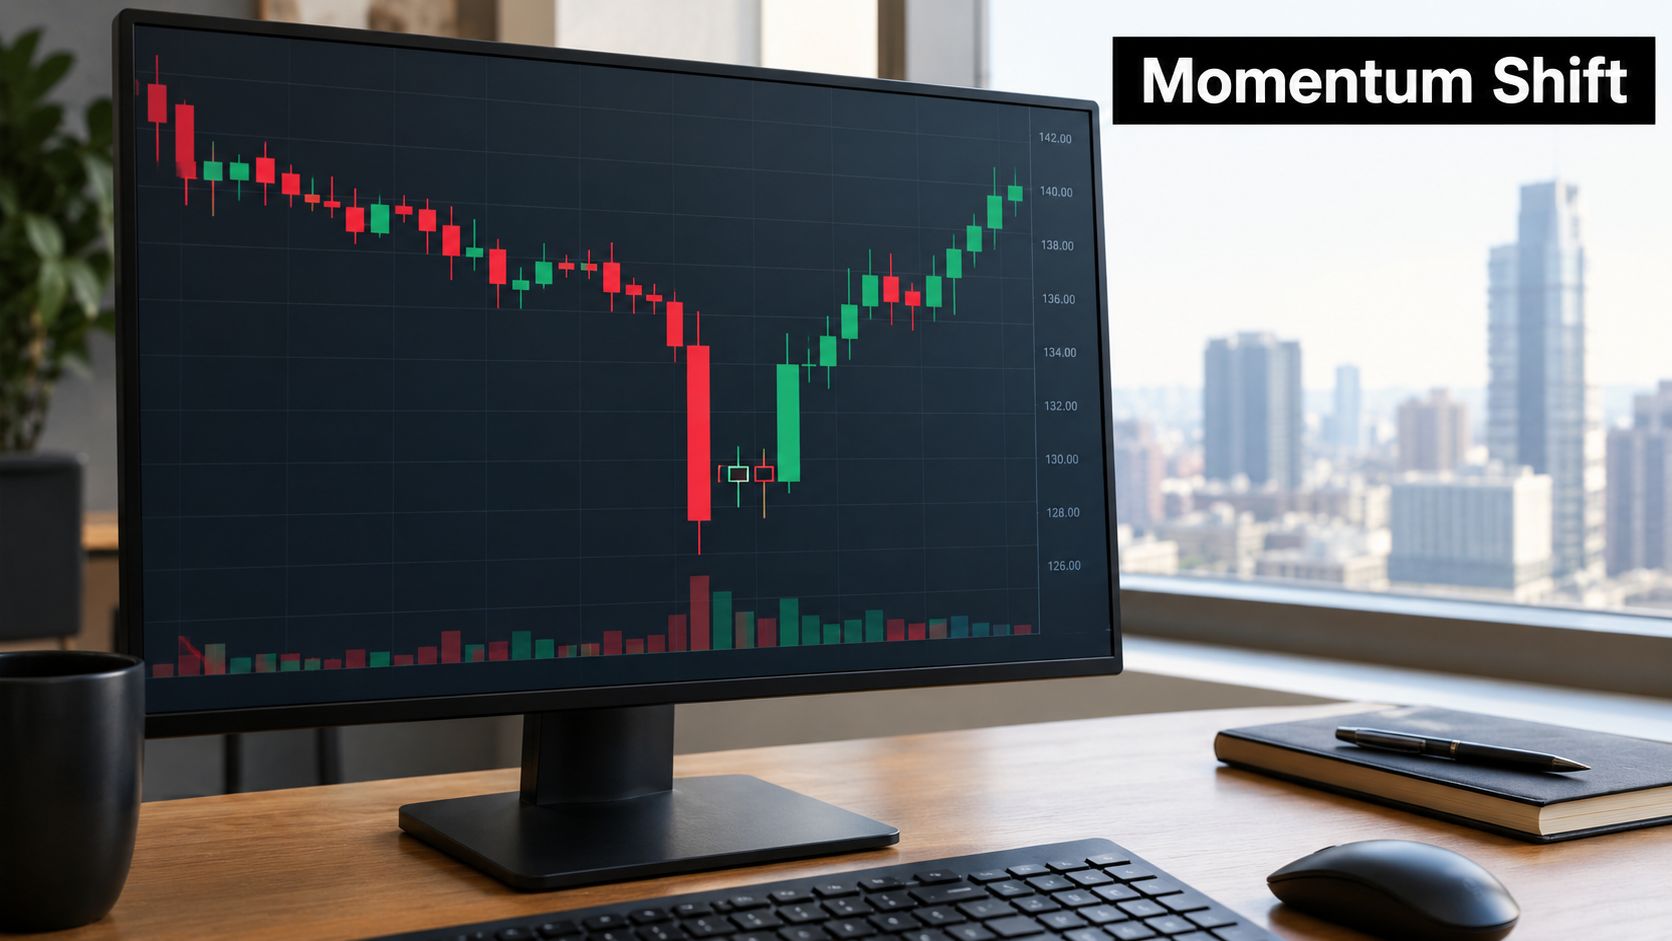
A Three Part Story, Not a Shape
The story runs like this. First, sellers push hard and close price near the lows, just as they've been doing. Next, the market stalls. Neither side gets very far, and the candle stays small. Then buyers stop defending and start advancing, closing price well back into the ground sellers took on that first candle.
That sequence is the definition you'll find in standard references. The Morning Star pattern is described as a three-candlestick bullish reversal formation that traditionally appears after a sustained decline, with a long bearish first candle, a small-bodied second candle, and a strong bullish third candle closing substantially into the first candle's body. Read that as behaviour, not geometry. Selling pressure, then balance, then buyers regaining control.
If you can't explain who was in control on each candle, you don't have a morning star yet. You have three candles that look similar.
This is also why location comes before recognition. The same three candles in the middle of a sideways range tell you almost nothing, because there's no exhausted downtrend to reverse. At the end of a real decline, near a level buyers have defended before, the same candles tell a coherent story. Your job isn't to collect shapes. It's to ask whether the struggle on the chart changed hands.
Keep one mental image as you read on. Darkness isn't removed in one instant. It fades, light appears at the edge, then the day breaks. That's the rhythm you're looking for on the chart.
What Each of the Three Candles Tells You
Think of two wrestlers locked up in the centre of the mat. One has been driving the other backwards for the whole match. Then the driving stops. For a moment nobody moves. Then the wrestler who was losing starts driving back. The morning star is that match in candle form.
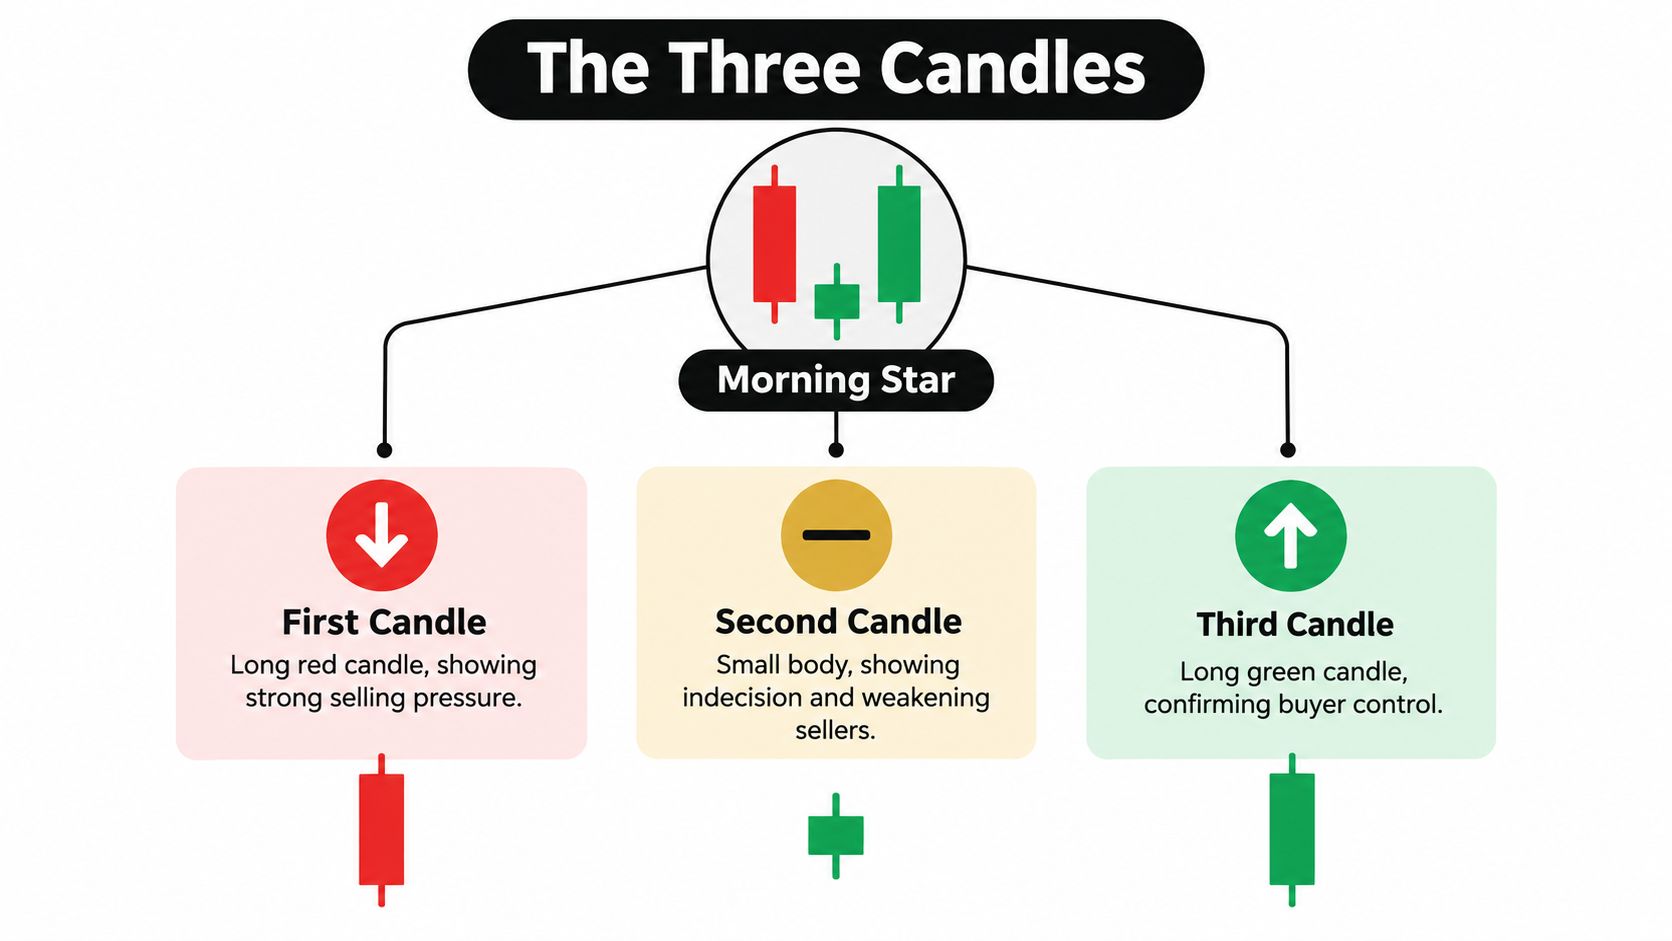
Candle One Shows Sellers Still in Charge
You want a long bearish candle here, not a timid red candle. Its job is to prove the downtrend was still alive when the pattern started. Sellers opened with intent, pushed price lower, and closed it near the low. A small upper wick helps, because it shows buyers didn't mount much of a challenge during that session.
If this first candle is small and messy, be careful. You may not be looking at seller exhaustion at all. You may just be looking at a slow market drifting, and drift produces lookalike patterns constantly.
Candle Two Is Where Momentum Breaks
The second candle is the pause in the wrestling match. Its small body is the point. Price may open lower, especially in markets that gap overnight, but sellers can't extend the move. Buyers can't reverse it yet either. That standoff is information, because yesterday sellers had no trouble moving price.
You'll see variations, and they're worth separating.
- Doji star: The open and close sit almost together. That's maximum indecision, and it often makes the pause easiest to read.
- Spinning top: A small body with wicks on both sides. Both sides probed, neither side won.
- Hammer-like star: A small body near the top of its range with a longer lower wick. Sellers tried to push lower during the session and buyers pulled price back up before the close.
None of these is automatically tradable on its own. The colour matters less than the size. What you need is a clear drop in directional progress compared with candle one.
Candle Three Delivers the Verdict
Now buyers have to do more than stall the fall. The third candle should be a strong bullish candle that closes materially into the first candle's body. That close is more important than raw size. A tall green candle that closes only a little above the second candle hasn't reclaimed much ground. A candle that closes past the midpoint of candle one has taken back terrain sellers fought for.
Grade it before you act. Did it close near its high, or did a long upper wick show supply waiting above? Did it open with strength and hold it, or did it fade into the close? A close above the first candle's open is the strongest version, because buyers have undone that entire bearish session. Anything shallow deserves suspicion, not capital.
Run this check every time. Conviction, pause, reclaim. If one of those three words doesn't fit the candle you're looking at, downgrade the setup.
Turning the Pattern Into a Trade With Clear Rules
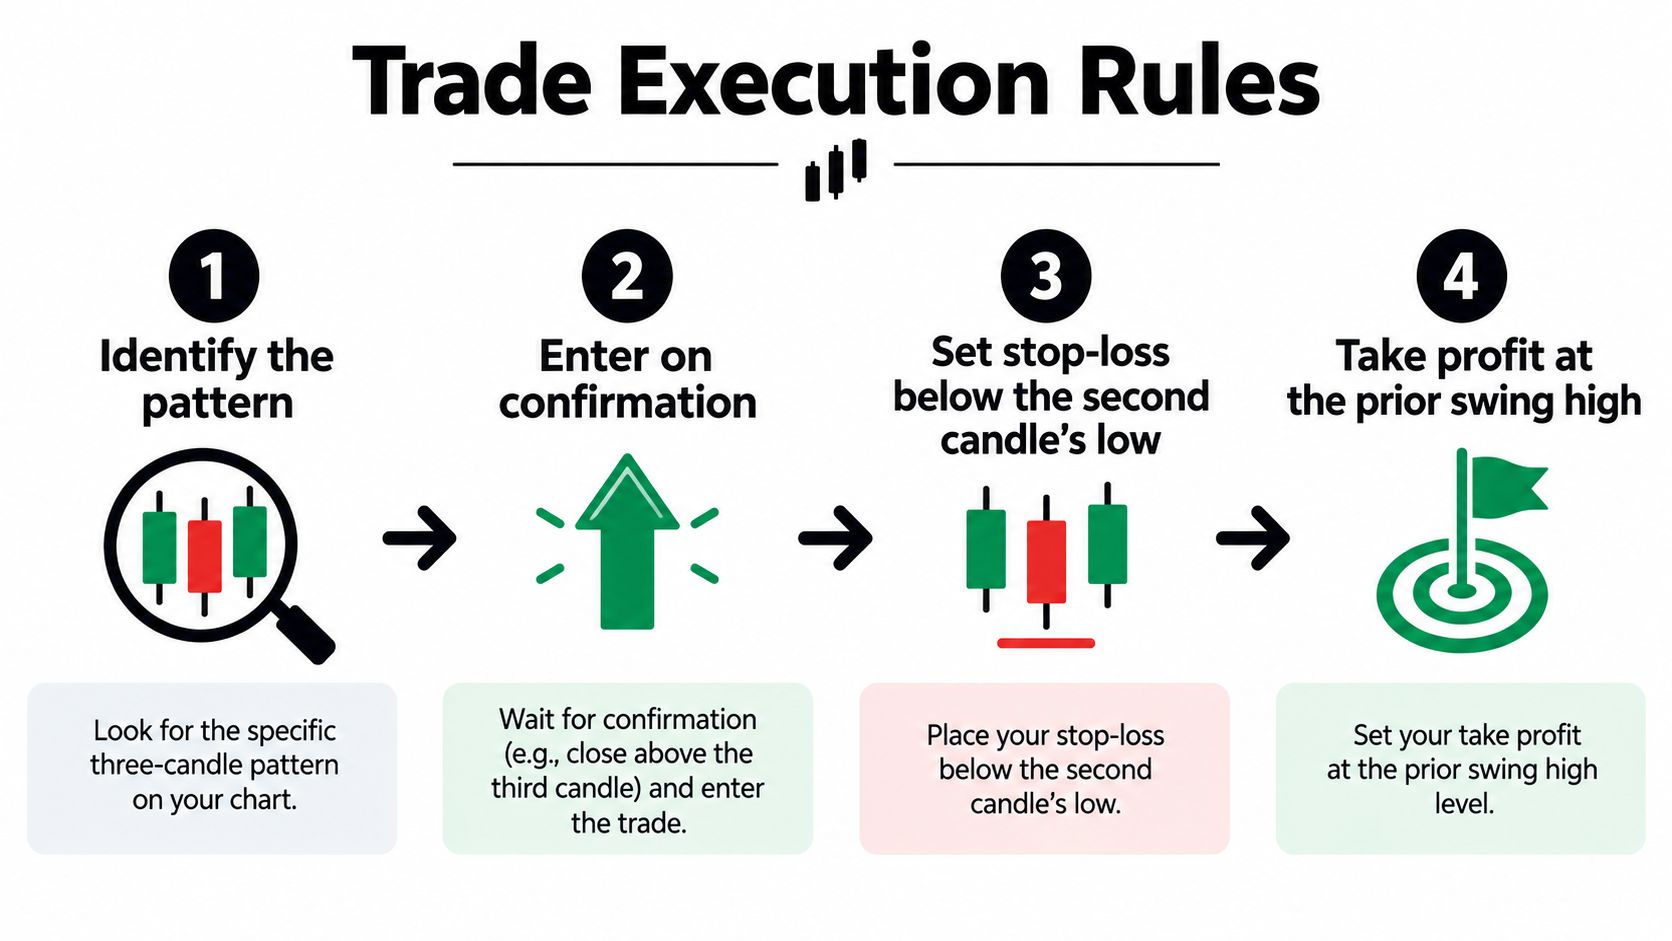
Recognition doesn't pay you. A morning star only becomes useful when you can answer three questions before you enter. Where will you get in, where are you wrong, and where will you get out if you're right? Answer them in that order and the trade manages itself far better.
Start with the entry, and be strict about timing. The pattern isn't complete until the third candle closes.
Wait for the Close, Then Define Wrong
Entering halfway through the third candle feels efficient. It's usually just guessing with better graphics. A candle that looks bullish at midday can collapse by the close, and then you're holding a long position inside a pattern that never formed. Wait for the close, then enter on the next candle's open or on a small break above the third candle's high if you want extra proof of follow-through.
Your stop belongs below the lowest point of the whole pattern, which is usually the low of the second candle. That level is the line buyers defended. If price trades back through it, the story you bought into is finished. Don't move the stop lower to stay comfortable, and don't place it inside the pattern to make the risk look smaller. Both habits turn a defined loss into an undefined one.
Position size comes from that distance. Measure from your entry to your stop first, decide how much money you're willing to lose if you're wrong, and let that math set your size. A wide pattern means a smaller position. That's not caution, it's consistency.
The short walkthrough below shows the same close first, stop second logic applied candle by candle, which is worth watching before you try to spot entries live.
Aim at an Obstacle, Not a Fantasy
For a target, look left on your chart. The nearest prior swing high or supply zone, meaning an area where sellers previously pushed price down hard, is the first place your trade will meet resistance. That's a logical place to take profit or at least reduce risk. It beats picking an arbitrary multiple and hoping the market cooperates.
Now compare the two distances. If the distance to that first obstacle isn't meaningfully larger than the distance to your stop, skip the trade. A beautiful pattern with heavy supply sitting just overhead offers you little room to be paid. Conversely, a morning star at a major support or demand zone, with clear space above it, can justify taking the trade at normal size. A mid-range pattern with cramped upside rarely justifies anything.
Practical rule: If you can't point to the exact level where you're wrong and the exact level where you'll take money off, you're not ready to enter.
Write those two levels down before you click buy. It takes seconds, and it removes most of the improvising that ruins otherwise decent setups.
Confirming the Setup and Filtering the Noise
Most morning stars you'll find aren't worth trading. That's not a flaw in the pattern. It's the normal result of scanning many charts. Your edge comes from grading what you find, because confirmation is stronger when the third candle closes decisively upward, develops with increased volume, and forms near a clearly defined support zone, as Investopedia's discussion of the star pattern and its confirmation requirements explains.
Use the table below as a grading sheet, not a wish list. You don't need every box in the pass column, but you do need the balance of evidence on your side.
| Check This | Pass | Caution | Skip |
|---|---|---|---|
| Prior trend | Clear, mature downtrend into the pattern | Short or choppy decline | Uptrend or sideways drift |
| Location | Tested support or demand zone | Minor level with some history | Middle of a range, no level nearby |
| Third candle | Closes deep into candle one, near its high | Closes just past the midpoint | Shallow close or long upper wick |
| Volume | Expands on the third candle | Roughly average | Falls away as price rises |
| Room above | Clear space to the next swing high | Moderate supply overhead | Major supply immediately above |
| Calendar | No major scheduled news pending | Minor release due | Earnings or major data imminent |
Stack Evidence Instead of Chasing Certainty
Read the rows together. A strong third candle at a real support zone after a stretched decline is a different animal from the same candle sequence floating in empty space. Traders call that stacking of independent reasons confluence in trading, and it's the habit of asking whether more than one thing points the same way before you risk money.
Higher timeframe context belongs in that stack too. A morning star on your daily chart that lines up with weekly support has bigger participants potentially defending the same area. A morning star on a five minute chart inside a daily downtrend is often just a pause before sellers resume. Always check one timeframe above the one you're trading.
Two disqualifiers deserve special respect. First, a scheduled news catalyst can overwhelm any candle pattern in seconds, so either reduce size or stand aside. Second, a weak third candle at a random location is usually short covering, meaning sellers taking quick profits, rather than fresh buying. Short covering fades. Don't confuse it with a reversal.
Real Chart Situations and Common Pitfalls
Two hypothetical charts will teach you more than a dozen definitions, because the morning star looks similar on both and behaves completely differently.
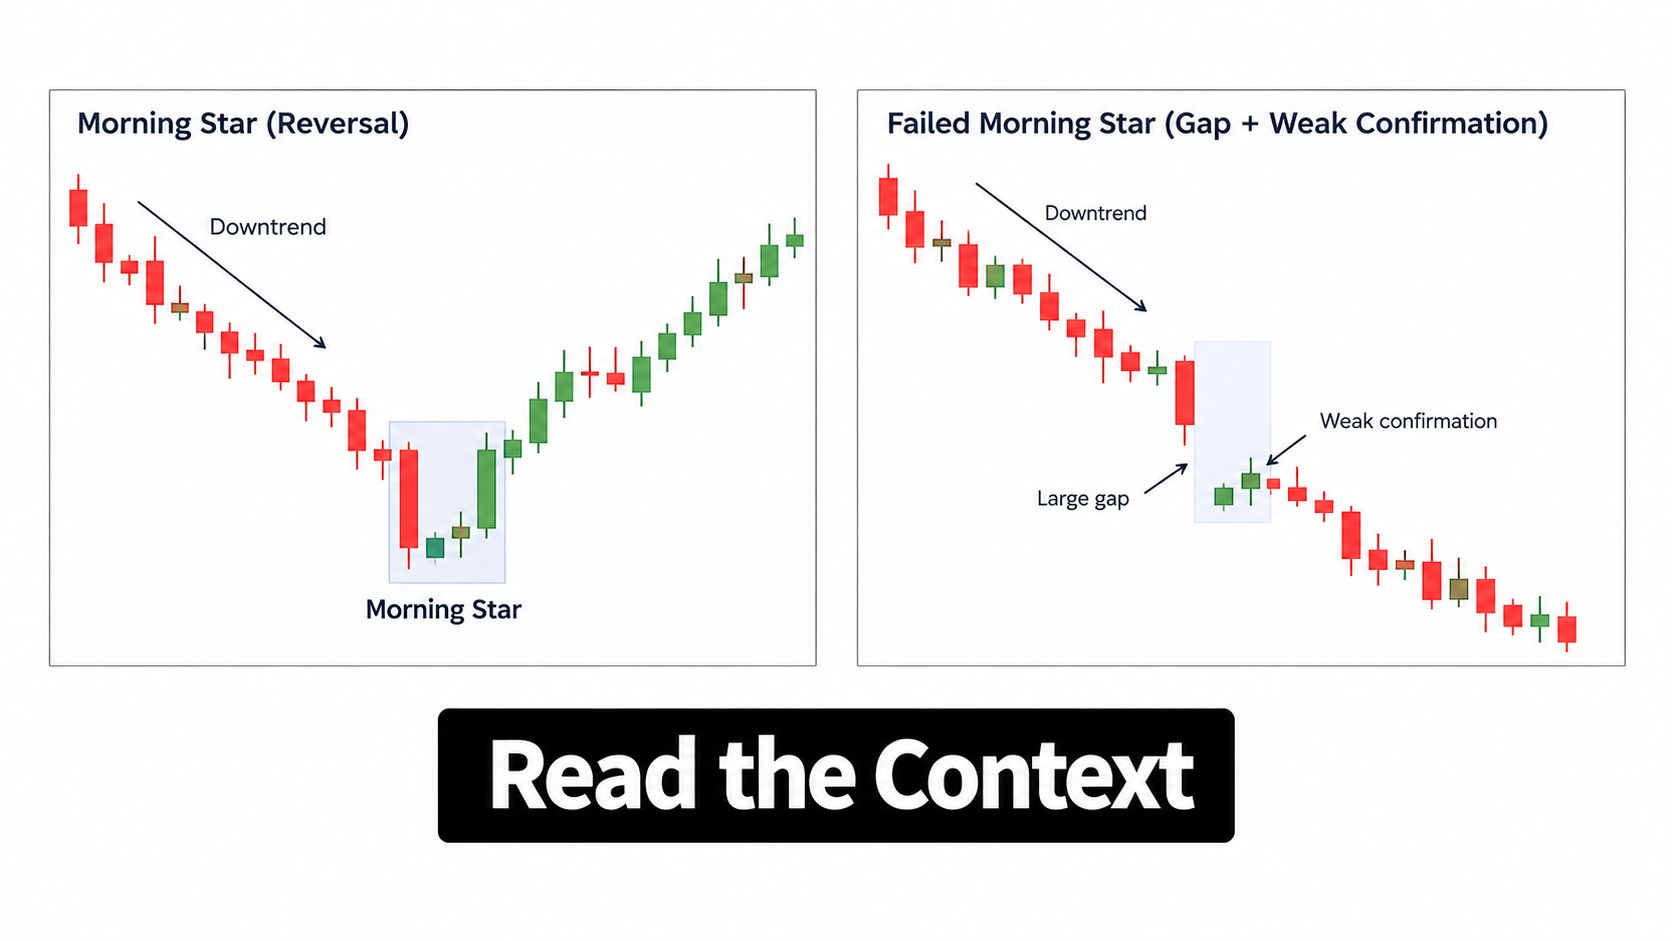
The One That Worked
A market has fallen steadily into a support zone it has bounced from before. The first candle arrives long and bearish, closing on its low, and it looks like more of the same. The second candle opens lower but goes nowhere, printing a small body right on the support zone. Sellers had their chance to break the level and couldn't.
The third candle opens firmer, builds through the session on heavier volume, and closes well into the first candle's body near its high. Above it there's open space until the last swing high. You enter after the close, your stop sits below the pattern low, and price works its way up to that swing high over the following sessions. Nothing magical happened. Context, location, and a decisive third candle all agreed.
The One That Failed
Now take the same visual sequence floating in the middle of a range, with no downtrend worth the name in front of it and a supply zone sitting just overhead. The third candle closes green, but only shallowly into the first candle, and volume doesn't pick up. It looks right if you squint. Within a few candles price rolls over, breaks the pattern low, and anyone who bought the shape donates their stop to the market.
The difference wasn't pattern recognition. It was everything around the pattern.
- Entering before the third candle closes: You're trading a pattern that may never exist. Wait for the close.
- Placing the stop inside the pattern: Normal noise takes you out before the idea is wrong. The stop belongs below the pattern low.
- Ignoring supply overhead: If sellers are waiting just above, your target may be smaller than your risk. Look left before you enter.
- Chasing a stretched entry: If price has already run well past the third candle's close, your stop distance balloons and the trade changes character. Let it go or wait for a pullback.
The losing version of this trade usually isn't a bad pattern. It's a decent pattern traded in the wrong place, at the wrong time, at the wrong size.
Replay those two scenarios on your own charts until you can spot which one you're looking at within seconds. That speed of judgment is the skill.
What the Numbers Say About the Edge
You deserve an honest answer on reliability, so let's separate two questions that traders constantly merge. Does price move in the expected direction after a morning star? Does that move pay you enough, often enough, after your stops and targets? Those are different questions.
According to PatternsWizard's historical analysis of the Morning Star pattern, a multi-market dataset covering 22,863 morning-star occurrences across 4,120 markets over the previous 59 years found the setup confirmed, meaning price moved in the expected direction, 74.2% of the time on average, reached a 2:1 reward-to-risk target only 38.4% of the time after confirmation, took 3.4 candles on average to confirm, 8.4 candles to invalidate, and revisited the entry level in 97% of cases. Sit with that gap. Direction was right far more often than a demanding fixed target was reached.
The revisit figure matters for the story you read on the chart. A morning star can mark sellers losing control and buyers taking over, yet price may still come back to your entry while both sides test who really won. If your size assumes the third candle must launch immediately, normal retesting can shake you out before the idea is wrong.
A Second Dataset, Same Warning
Historical testing attributed to Thomas Bulkowski reported the pattern produced a bullish reversal approximately 78% of the time in the cited sample, while noting results vary with market regime, breakout direction, and sample conditions, with some breakdowns based on only 108 patterns, as detailed on Bulkowski's Morning Star research page. Treat that as a classification of what happened next in one sample; your win rate comes from your own rules.
Reliability is often left undefined: no market, no timeframe, no holding period, no cost assumption. Even Investopedia's Morning Star entry explains the shape and psychology without settling those terms. So build your own definition. Decide in advance what counts as a prior downtrend, how deep the third candle must close, where you enter and exit, then record outcomes on the markets you trade. If you want structure, use a step-by-step way to backtest your rules and test stocks, indices, forex, and crypto separately, because continuous markets often fail to produce the textbook overnight gap.
The numbers support the morning star as a directional clue. Whether it pays depends on your stops, targets and sample.
The Edge Is in Management, Not the Shape
Here's the part nobody selling pattern posters will tell you. A textbook morning star in a structurally weak market can still lose money, because the pattern only shows sellers tiring. It doesn't guarantee buyers will stampede. Exhaustion and enthusiasm are different things.
What often matters most is the trade that unfolds after the third candle, not the third candle itself. Consider scaling out, meaning you sell part of the position at the first obstacle where old support may flip into resistance, and let the rest run toward the larger supply target with your stop tightened. That habit, covered in more depth in practical guidance on position management, usually improves real outcomes more than obsessing over a slightly earlier entry.
Hold three disciplines and the pattern will serve you well. Respect the invalidation below the pattern low, every time. Size from the stop distance, never from your confidence. Give the trade room to revisit your entry without panicking, since that revisit is normal. The morning star is a clue about shifting control. Your process decides what that clue is worth.
If you want to turn candle patterns like this into a complete, rule-based approach, Colibri Trader offers price action training built around supply and demand, disciplined money management, and personal mentorship, starting with a free Trading Potential Quiz and sample chapters. Visit Colibri Trader to explore the programs and start building a process you can repeat.