




Variation of Price in Trading: A Practical Guide
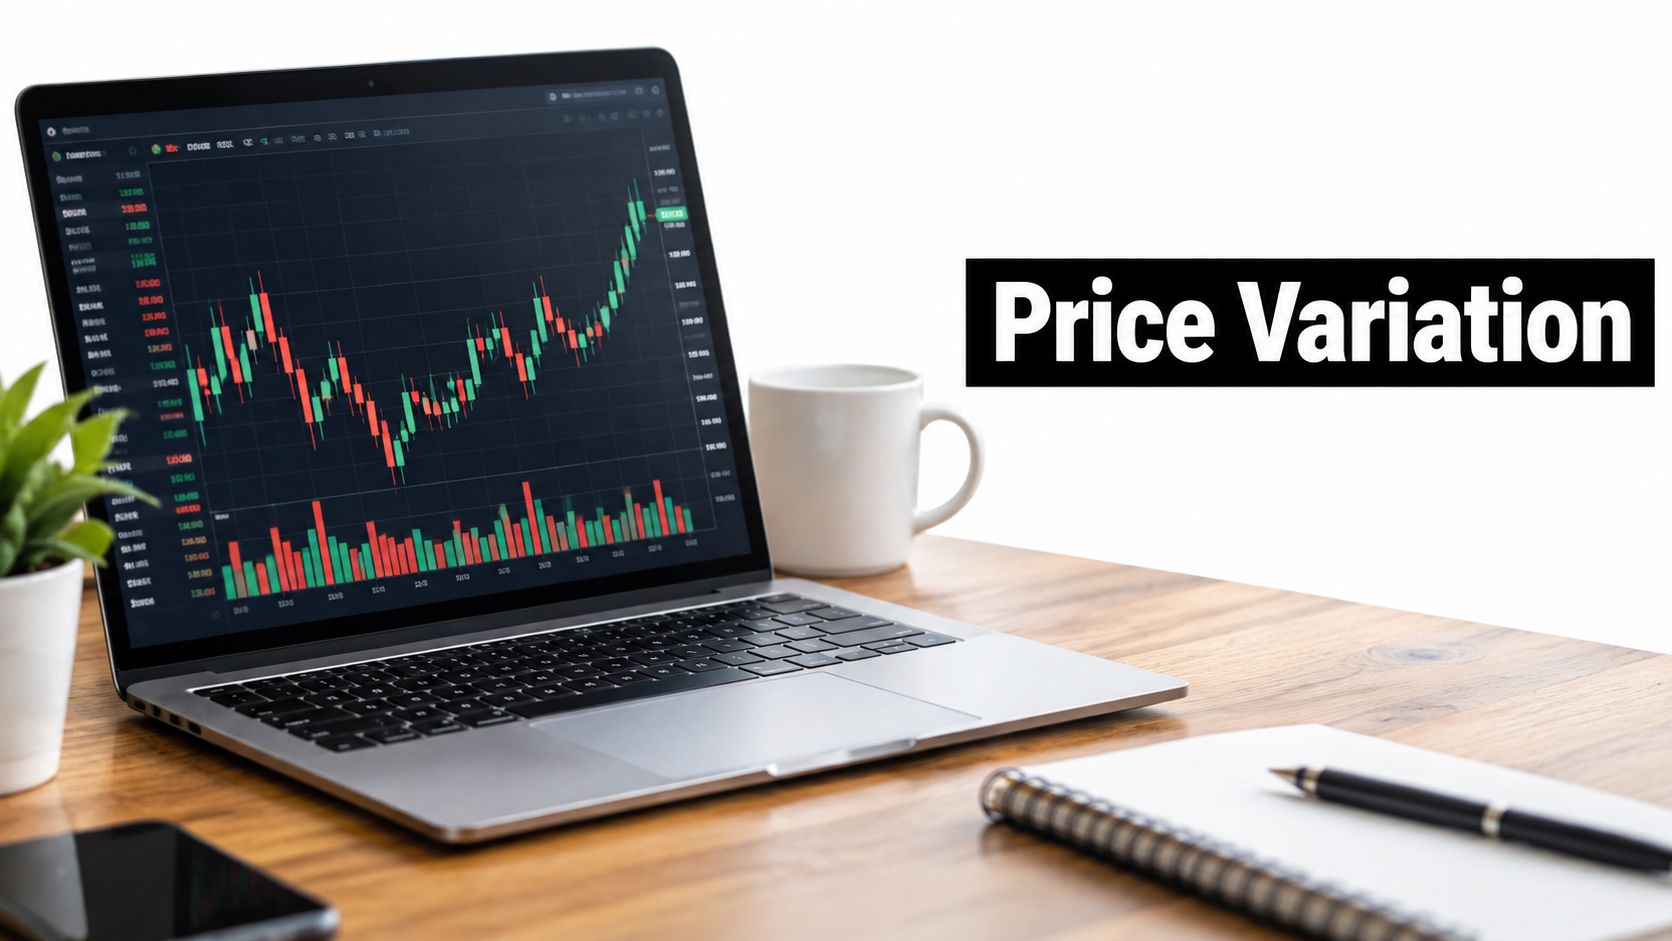
Prices can move violently in both directions: U.S. CPI rose 23.7% from June 1919 to June 1920, then fell 15.8% from June 1920 to June 1921. Variation of price is the measured up-and-down movement over a chosen period, while volatility describes the speed and size of those moves.
You've probably seen the frustrating version of this on a trading chart. A support level looks clean, your entry makes sense, and your stop sits just beyond the obvious swing low. Then price barely travels, dips into your stop, and reverses toward the target without you.
That experience teaches an important distinction. Variation of price tells you how far price has moved within a period. Volatility adds information about how rapidly and irregularly that movement is occurring. Traders measure both through tools such as range, Average True Range, and standard deviation, but none of them guarantees that a visible chart setup will produce a tradable fill.
The practical question isn't only, “How much did price move?” It's also, “How much of that movement could I realistically capture after spread, slippage, liquidity, and order execution?”
What Variation of Price Actually Means
Variation of price is the difference between observed price points across a selected period. On a daily chart, you might compare the day's high, low, open, and close. On a five-minute chart, you might measure the distance covered by each candle or by a sequence of candles.
That definition works across stocks, foreign exchange, futures, commodities, and options. The timeframe changes, but the question remains the same: how much did price move, and how did it move?
A narrow candle with small wicks shows limited variation during that interval. A wide candle with a long upper wick shows greater movement, followed by rejection. Neither candle is automatically bullish or bearish. Variation is evidence about market behavior, not a trade signal by itself.
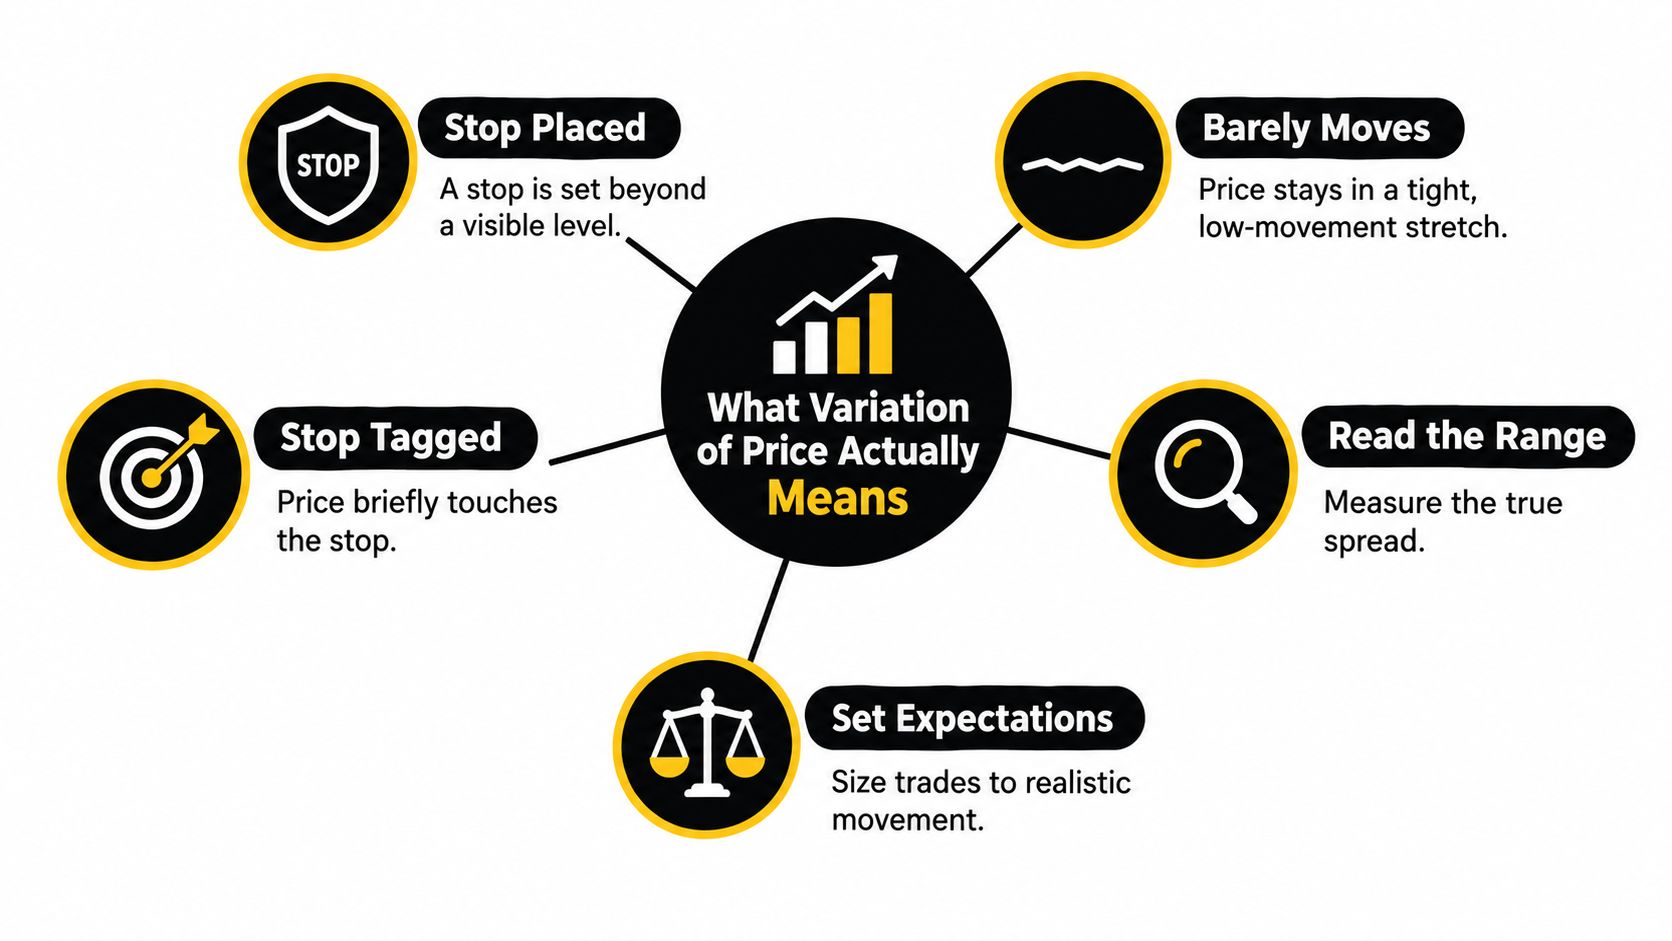
Variation and volatility aren't identical
Traders often use the two words interchangeably, but they answer different questions.
- Variation describes the observed change in price over a defined window.
- Volatility describes the intensity, speed, and inconsistency of those changes.
- Range records the distance between a high and a low.
- ATR smooths recent true ranges to estimate typical movement.
- Standard deviation measures how widely prices or returns disperse around an average.
A market can travel a substantial distance in a smooth trend, creating meaningful variation without the same degree of choppiness associated with high volatility. Another market can swing sharply up and down, finishing near its starting point. Its net change may be small, but its intraperiod variation and volatility can be high.
High variation also isn't a guaranteed opportunity. Wide candles may offer room for profit, but they can bring wider spreads, rapid reversals, and poor fills. Low variation isn't proof that nothing is happening either. A tight range can reflect balance before a repricing event, or it can just show that buyers and sellers have little urgency.
Historical commodity data makes the trade-off clear. A World Bank analysis of 18 commodities from 1997 to 2014 found that average volatility during the 2008–2009 financial crisis was more than 50% higher than in other periods, while 17 of 18 commodities recorded volatility at least 25% above their long-run average (World Bank commodity market analysis). That kind of environment can create opportunity, but it can also make execution and risk control harder.
Practical rule: Read variation first as a condition. Decide whether it supports your setup only after considering direction, location, liquidity, and execution.
For readers comparing changing prices in other markets, a resource such as this digital nomad pricing guide can also illustrate a broader principle: a listed price is only meaningful when you understand the conditions behind it. Trading requires the same discipline.
How Traders Measure Price Movement
A trader doesn't need a chart filled with indicators to measure movement. Three basic tools answer most practical questions: the simple range, Average True Range, and standard deviation.
Range gives you the immediate picture
The range is the high minus the low for a chosen period. If a candle reaches a high of $50 and a low of $48, its range is $2. That figure tells you the distance price covered, but it doesn't tell you whether the move was smooth, whether a gap occurred, or whether the candle closed near its extreme.
Range is useful when you want to inspect a specific session, candle, or trading day. It helps identify expansion and contraction. A sequence of shrinking ranges often signals reduced participation or temporary balance. A sudden wide range demands context, because it may represent genuine acceptance at a new level or a fast rejection.
ATR adds continuity and gaps
Average True Range, or ATR, averages recent true ranges. True range accounts for the current high-to-low distance and the relationship between the current session and the previous close, so it captures gaps that a simple candle range can miss.
That makes ATR useful for estimating typical movement on the timeframe you're trading. A stop based on a fixed number of points may be too close when ATR expands and unnecessarily wide when ATR contracts. ATR doesn't predict direction. It helps you judge whether your stop, target, and position size fit current conditions.
Standard deviation measures dispersion
Standard deviation asks how far prices or returns tend to stray from their average. A rising reading indicates that observations are spreading out more widely. A falling reading suggests that they are clustering more closely.
It can help compare current behavior with a market's recent norm, but it requires careful interpretation. Standard deviation depends on the sample and calculation method, and it can react differently depending on whether you measure prices, returns, or another series.
| Measure | What It Captures | Best Used For | Limitation |
|---|---|---|---|
| Range | High-to-low movement in a selected period | Reading a candle, session, or day | Misses some gap context and says little about consistency |
| Average True Range | Smoothed recent true movement, including gaps | Stops, targets, and position sizing | Doesn't indicate direction |
| Standard deviation | Dispersion around an average | Comparing movement with a recent norm | Sensitive to the chosen sample and calculation |
A simple workflow keeps the tools useful. Start with the range to see what happened. Use ATR to estimate what has been typical recently. Use standard deviation when you need a statistical view of how unusual the current movement appears.
The mistake is treating any one measure as a complete trading system. These tools quantify movement, but your decision still depends on market location, structure, liquidity, and the quality of the entry.
Why Price Variation Spikes and Stalls
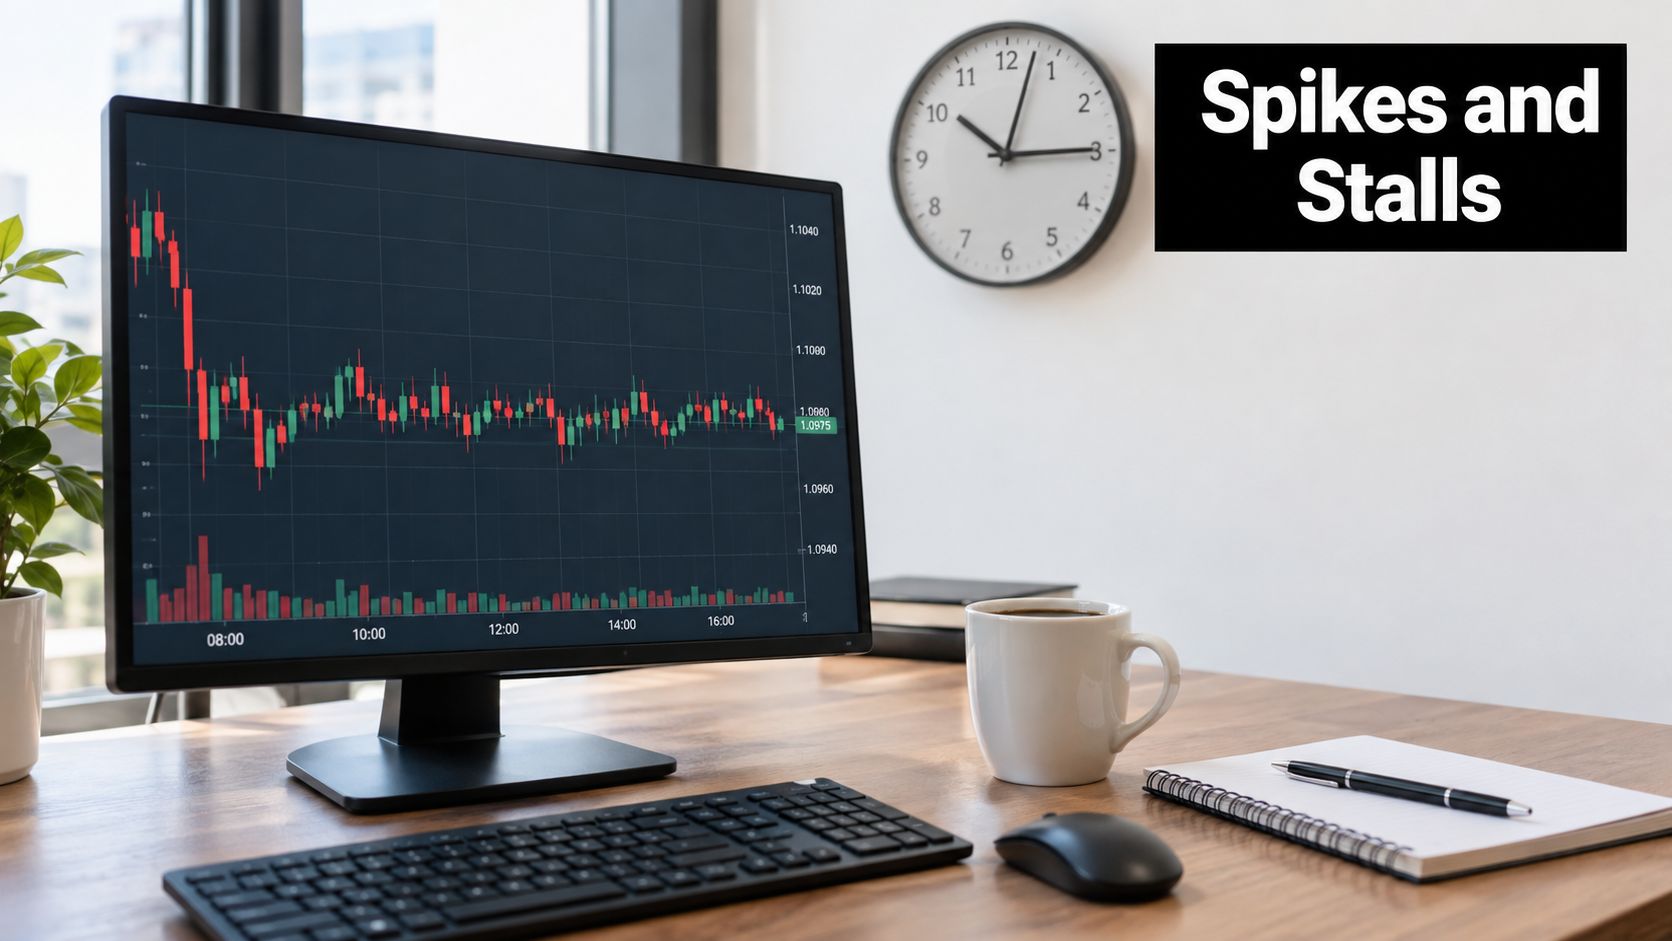
Price rarely moves at a steady pace. Scheduled economic releases, central bank decisions, earnings announcements, overnight gaps, thin trading sessions, and portfolio positioning can all change how aggressively orders reach the market.
A quiet market may show overlapping candles and repeated tests of the same area. A news-driven market may print a large candle that travels through several nearby levels before traders can react. End-of-month positioning can add movement without creating a clean directional trend. The chart shows the result, but it doesn't always reveal the reason immediately.
History shows both expansion and reversal
Consumer prices offer a useful example because variation doesn't mean only rising prices. The U.S. Bureau of Labor Statistics reports that CPI inflation reached 17.8% in 1917 and 15.6% in 1920, then shifted to deflation of 10.9% in 1921 and 6.2% in 1922 (BLS history of U.S. price change).
The lesson for a trader is straightforward. A market can accelerate, overshoot, and reverse. An average movement over a long period can hide abrupt changes inside that period. The same applies to a chart that looks moderate when viewed from a distance but contains sharp intraday swings.
You can study the relationship between movement and tradability through market liquidity. A market can display a large visible range while offering poor conditions for entering or exiting at the prices shown.
After a quiet stretch, traders often expect expansion. That expectation can be reasonable, but it isn't a timing signal. A tight range may break and continue, or it may break briefly and return to balance. Treat contraction as a change in condition, not as proof that a breakout must follow.
A useful regime question is:
- Quiet and orderly: Are candles overlapping around a stable area?
- Expanding with acceptance: Is price breaking a level and holding beyond it?
- Expanding with rejection: Is the range wide but the close returns inside prior structure?
- Thin and erratic: Are wicks large, spreads wider, and follow-through inconsistent?
The same number of points can mean very different things in each regime.
Here's a visual explanation of how price movement can change across market conditions:
Reading Variation on a Price Action Chart
Price action traders read variation through the relationship between candle size, location, and follow-through. A wide bullish candle leaving a demand zone may show urgency, but its meaning depends on where it closes and what happens next. A wide candle arriving directly into resistance can represent buying pressure, or it can be the final burst before rejection.
Support and resistance give variation a reference point. Without location, a large candle is only a large candle. At a well-tested level, a long wick may reveal that one side pushed price beyond the level and then lost control. A close back inside the range often deserves more attention than the temporary extreme.
Match movement to the setup
Different setups need different movement conditions.
A breakout trade needs enough expansion to travel beyond the level, but it also needs acceptance. If the breakout candle is unusually large and the next candle immediately retraces, the apparent strength may have been exhaustion rather than confirmation.
A pullback trade often works better when the retracement shows controlled variation. Small opposing candles moving into a demand or supply zone can suggest reduced pressure, while a fast, wide retracement may indicate that the original move has lost its advantage.
A range trade needs boundaries that have held repeatedly. When variation contracts near the middle of the range, there may be little reward relative to risk. Near an edge, a rejection candle can offer more useful information, but only if the spread and stop distance remain practical.
For a broader introduction to the chart-reading process, see this guide on how to read price action.
The dangerous assumption is that dramatic movement equals strong tradability. A 2025 study of Indian equities found that higher intraday volatility was associated with wider bid-ask spreads, particularly in mid- and small-cap stocks (study of volatility and liquidity in Indian equities). Wider variation can therefore increase both potential distance and transaction friction.
A clean pattern on a noisy chart may be less usable than an ordinary pattern in a liquid, orderly market.
When variation expands, check the spread, the candle close, the distance to the next opposing zone, and the behavior of the following candles. Those details help distinguish a meaningful change in supply and demand from a temporary burst of orders.
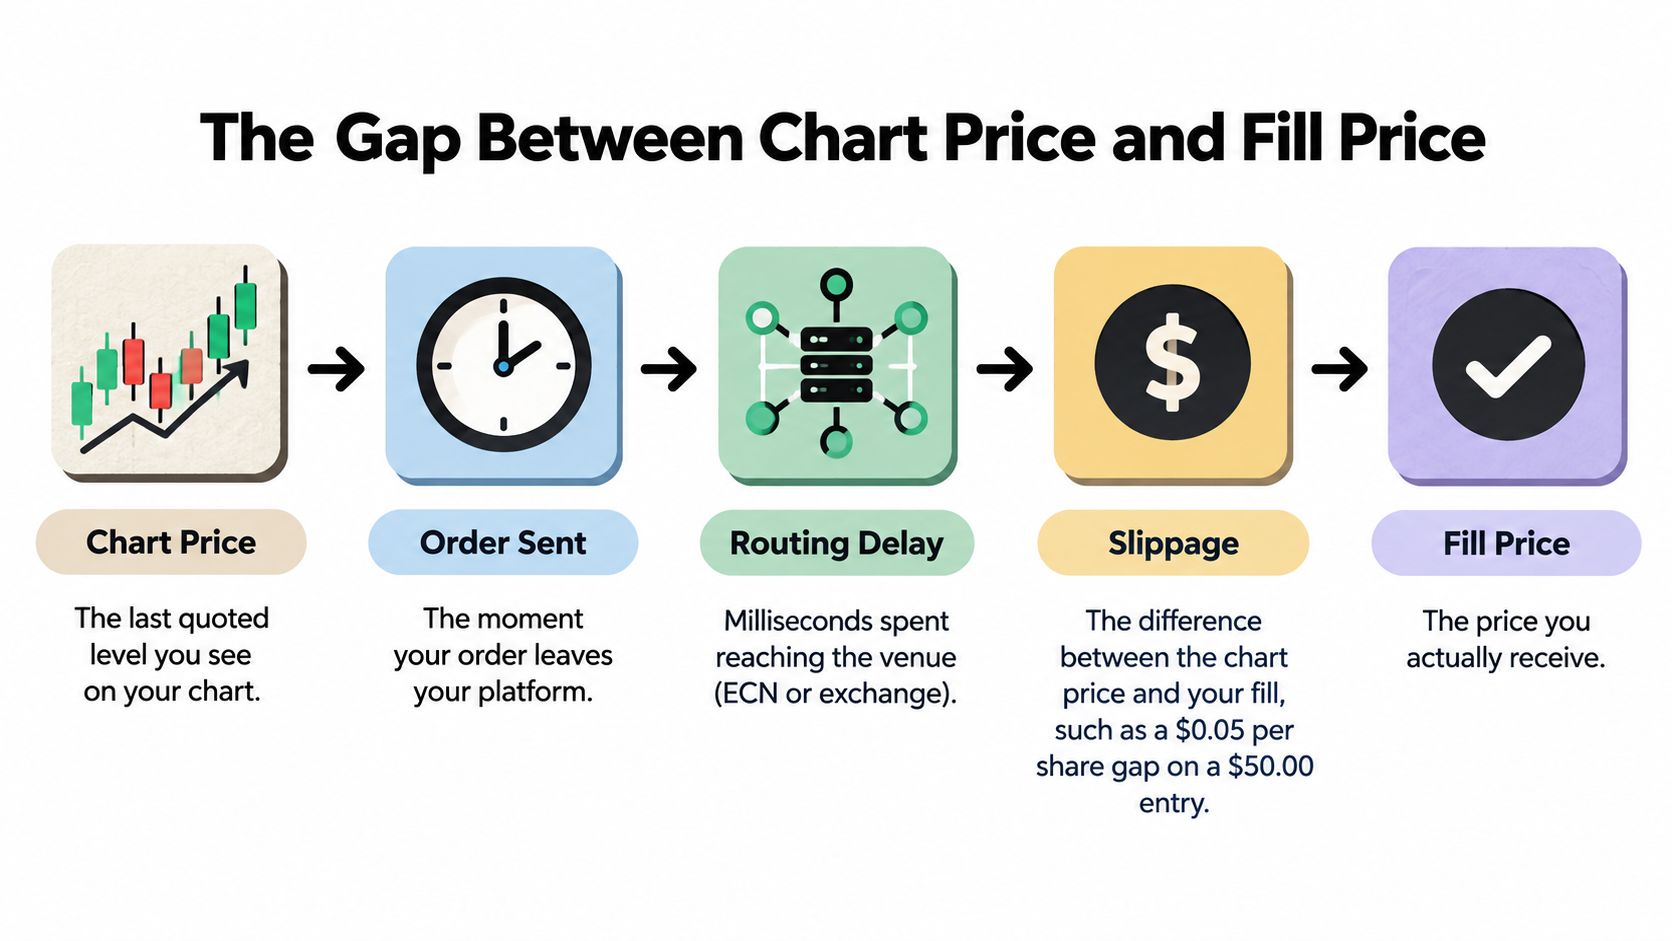
The Gap Between Chart Price and Fill Price
The chart shows a quoted or last-traded level. Your order interacts with a bid, an offer, available liquidity, routing conditions, and other orders. Those are related to the chart price, but they aren't identical to it.
Suppose a stock appears to trade at $50. An immediate buy order may fill at the offer rather than the last price displayed. A larger order may consume several available prices. A stop order can activate during a fast move and fill away from the level you had marked.
Execution turns visible movement into real cost
Neutral execution research reports mean round-trip retail execution costs ranging from 0.07% to 0.46% across brokers, a roughly sixfold difference (research on slippage and implementation shortfall). The same research notes that academic market-microstructure evidence finds liquidity providers widen bid-ask spreads when intraday order-flow volatility rises.
That changes how you should judge a setup. A pattern may appear to offer a reasonable distance to the target, but the entry spread, exit spread, and slippage can consume part of the move. Commission-free trading doesn't mean cost-free trading, because the cost may appear through spread, execution quality, or price improvement that differs across venues and brokers.
A practical execution log should record:
- Requested price: The level you intended to buy or sell.
- Fill price: The price you received.
- Spread: The difference between bid and ask near the decision.
- Slippage: The gap between the intended and executed price.
- Instrument and session: The market and time conditions involved.
- Order size and type: The quantity and whether you used a market, limit, or stop order.
A resource explaining Maple Leaf gold pricing can help reinforce a related habit outside active trading, namely separating a quoted reference price from the terms available for an actual transaction. In markets, the displayed number is a starting point for analysis, not a promise.
Review your log by instrument, session, order type, and position size. You may discover that a strategy performs well on a chart but poorly during a particular session or with a particular execution method. That finding is more valuable than adding another candlestick pattern without testing the existing one.
For a plain-language explanation of the execution issue, see what slippage is in trading. The central question is not whether the chart pattern exists. It's how much of its apparent edge survives the route from screen to fill.
Managing Trades Around Varying Price Movement
Trade management starts before the order. Mark the prior session's high and low, identify nearby supply and demand, and compare the current range with recent movement. Then ask whether your planned stop and target make sense for the regime visible on the chart.
Size the position from the stop
Position size should respond to risk per trade and stop distance, not to a fixed number of shares, contracts, or pips. If ATR has expanded, a stop based on the same fixed distance may sit inside ordinary movement. Keeping that stop while using the same position size increases exposure to being stopped by normal variation.
A wider, structure-based stop doesn't automatically make a trade safer. You usually need a smaller position so the amount at risk remains controlled. If the required stop makes the position too small or the target too close, skipping the trade can be the most disciplined decision.
Place stops where the idea fails
A stop belongs beyond the point that invalidates the setup, with enough room for normal movement between the entry and that level. ATR can help you judge whether the space is realistic, but it shouldn't replace structure.
For example, a long trade from demand may fail if price closes decisively below the zone. A stop placed directly at the most visible low can be vulnerable to a brief wick. Moving it farther away without reducing size converts a technical adjustment into greater financial risk.
Use a short operating checklist
Before entry, check:
- Location: Is the setup at a meaningful support, resistance, supply, or demand area?
- Condition: Is variation expanding, contracting, or becoming erratic?
- Execution: What is the current spread, and can your order type handle it?
- Risk: Does the stop reflect invalidation rather than an arbitrary distance?
- Reward: Is there enough room before the next opposing area?
After exit, log the requested price, fill price, spread, slippage, range, and reason for closing. Separate a poor market read from a poor execution result. Those are different problems and require different solutions.
Trading habit: Measure the movement you received, not only the movement you predicted.
When the market shifts from quiet to fast, reduce assumptions before you reduce attention. When it becomes unusually narrow, avoid forcing trades just because your chart feels inactive. Variation is something to read and adapt to, not an opponent to defeat.
Common Questions About Variation of Price
Is variation of price the same as volatility?
No. Variation describes the movement observed over a chosen period. Volatility focuses more on the intensity, speed, and irregularity of that movement. A market can move far in an orderly way or swing sharply while ending close to where it began.
Which measure should a short-term trader choose first?
For most short-term traders, ATR is a practical starting point because it smooths recent movement and accounts for gaps through true range. Use the simple range to inspect the current candle or session, and use standard deviation when you need to compare dispersion with a recent average.
How can I recognize a possible expansion after a quiet period?
Look for contracting ranges near a meaningful level, followed by a decisive move and evidence of acceptance or rejection. A break alone isn't enough. Check the close, follow-through, spread, and available room before the next opposing zone.
Does commission-free trading eliminate trading costs?
No. You can still pay through the spread, slippage, and execution conditions. Compare the price you requested with the price you received, especially during fast movement, thin liquidity, and larger orders.
What should I do when a familiar pattern appears during extreme movement?
Slow down and test whether the movement reflects genuine acceptance or temporary order imbalance. Wide candles can improve potential distance while reducing fill quality, so review the spread, stop placement, and position size before acting.
Colibri Trader offers price-action education built around naked charts, candlestick formations, supply and demand, and day-trading techniques across markets such as foreign exchange, CFDs, commodities, stocks, and major indices. Visit Colibri Trader to explore its courses and apply a more disciplined framework for reading variation, managing risk, and reviewing real execution.