




Bullish Doji Candlestick Price Action Guide
Most trading guides call a doji a bullish reversal signal and move straight to the buy button. That advice gets the order of reasoning backward. A doji doesn't prove that buyers have taken control. It shows that buyers and sellers reached temporary equilibrium, and only the surrounding structure and next price reaction can give that pause a directional meaning.
A bullish doji candlestick is therefore best treated as a conditional alert. After a sustained decline, at meaningful support, with lower-price rejection and a confirmed close above the doji high, it can provide a disciplined long setup. In the middle of a noisy range, the same shape is usually just indecision.
The Truth About the Bullish Doji Candlestick
A doji forms when a security's opening and closing prices are virtually equal. Buyers may have pushed price higher during the session, sellers may have driven it lower, or both sides may have been active, but neither side finished with clear control. The result is a small or nearly absent real body.
That definition makes the popular label “bullish doji” misleading when traders use it without context. A doji is not necessarily bullish. Its directional interpretation comes from the price action before it and the confirmation that follows, as explained in this neutral reading of doji indecision candles.
Practical rule: The doji is the question mark. The next candle provides part of the answer.
Consider two identical dojis. The first appears after a prolonged decline, directly above a well-tested demand zone, with a lower wick that rejects the level. The second appears halfway through a sideways range. The first deserves attention because sellers may be losing the ability to push through support. The second has no clear structural reason to produce a reversal.
This is why I don't enter just because a chart prints a cross-shaped candle. I mark the doji's high and low, identify the nearby supply and demand, and then wait to see which side wins the next auction. Traders who want a clean foundation should first review what a doji candle actually represents, rather than treating every visual variation as a complete strategy.
A bullish interpretation usually needs three ingredients:
- Location: The doji forms after selling pressure has carried price into credible support.
- Rejection: The session probes lower prices but closes back near its open, showing that sellers couldn't hold the extreme.
- Confirmation: A later candle closes above the doji high, demonstrating renewed demand.
Remove those ingredients and the pattern loses its edge. The candle can still mark an important pause, but a pause isn't the same as a long signal.
Anatomy and Psychology of Doji Variations
The body tells you that the open and close finished near one another. The shadows tell you how far each side pushed before the session ended. That intraday journey matters because a lower wick and an upper wick represent different failed attempts to gain acceptance.
Standard doji
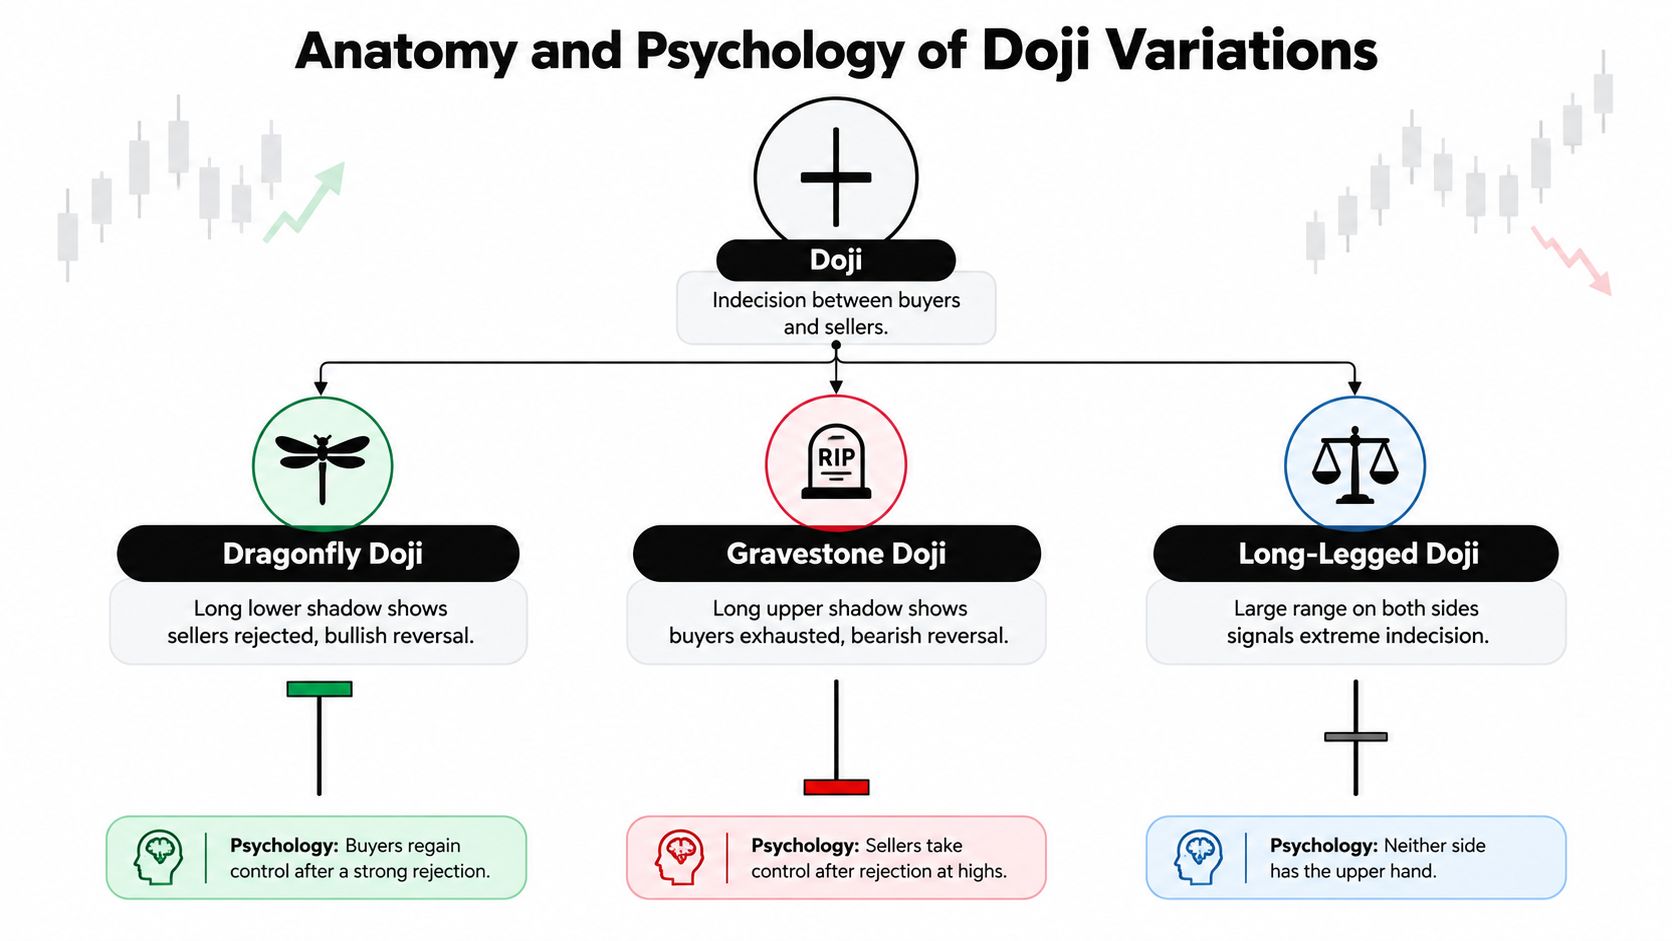
A standard doji has a small body with shadows extending above and below. It records a contest that ended without a decisive winner. If it appears after a sharp decline, the important question is whether sellers can continue closing price lower. If the following candle breaks upward and closes above the doji high, the market has supplied evidence that the balance may be shifting.
Dragonfly doji
A dragonfly doji carries a long lower shadow and little or no upper shadow. Sellers controlled the early or middle part of the session and drove price lower, but buyers absorbed that selling and returned price toward the open. Near support after a sustained decline, that rejection can be constructive.
It still isn't a buy signal by itself. A long lower wick may reflect temporary volatility, a liquidity sweep, or a pause before another leg down. The pattern becomes more useful when the next candle accepts prices above the doji high. For a focused explanation of its structure and location, see this guide to the dragonfly doji candlestick.
Gravestone doji
The gravestone doji is the mirror image in terms of wick behavior. Price rallies during the session, reaches higher levels, and then retreats toward the open, leaving a long upper shadow. At resistance after an extended advance, that failure can warn that buyers couldn't maintain acceptance at the highs.
Calling it bearish still requires context. The same shape inside a broader decline can just mark a failed rally within a continuing downtrend, while an isolated gravestone in a broad range may have little practical value. Its message is rejected higher prices, not guaranteed downside.
Long-legged doji
A long-legged doji has substantial shadows on both sides. It shows that both buyers and sellers created a wide intraday auction, but neither side could preserve control into the close. This can signal heightened uncertainty around a decision level, although it can also reflect disorderly trading with no clean directional opportunity.
Read the closing position relative to the full range. A close near the upper end after a deep lower rejection is more constructive than a close near the middle after movement in both directions. The shadow geometry helps, but location and follow-through remain decisive.
Filtering Signals with Market Structure
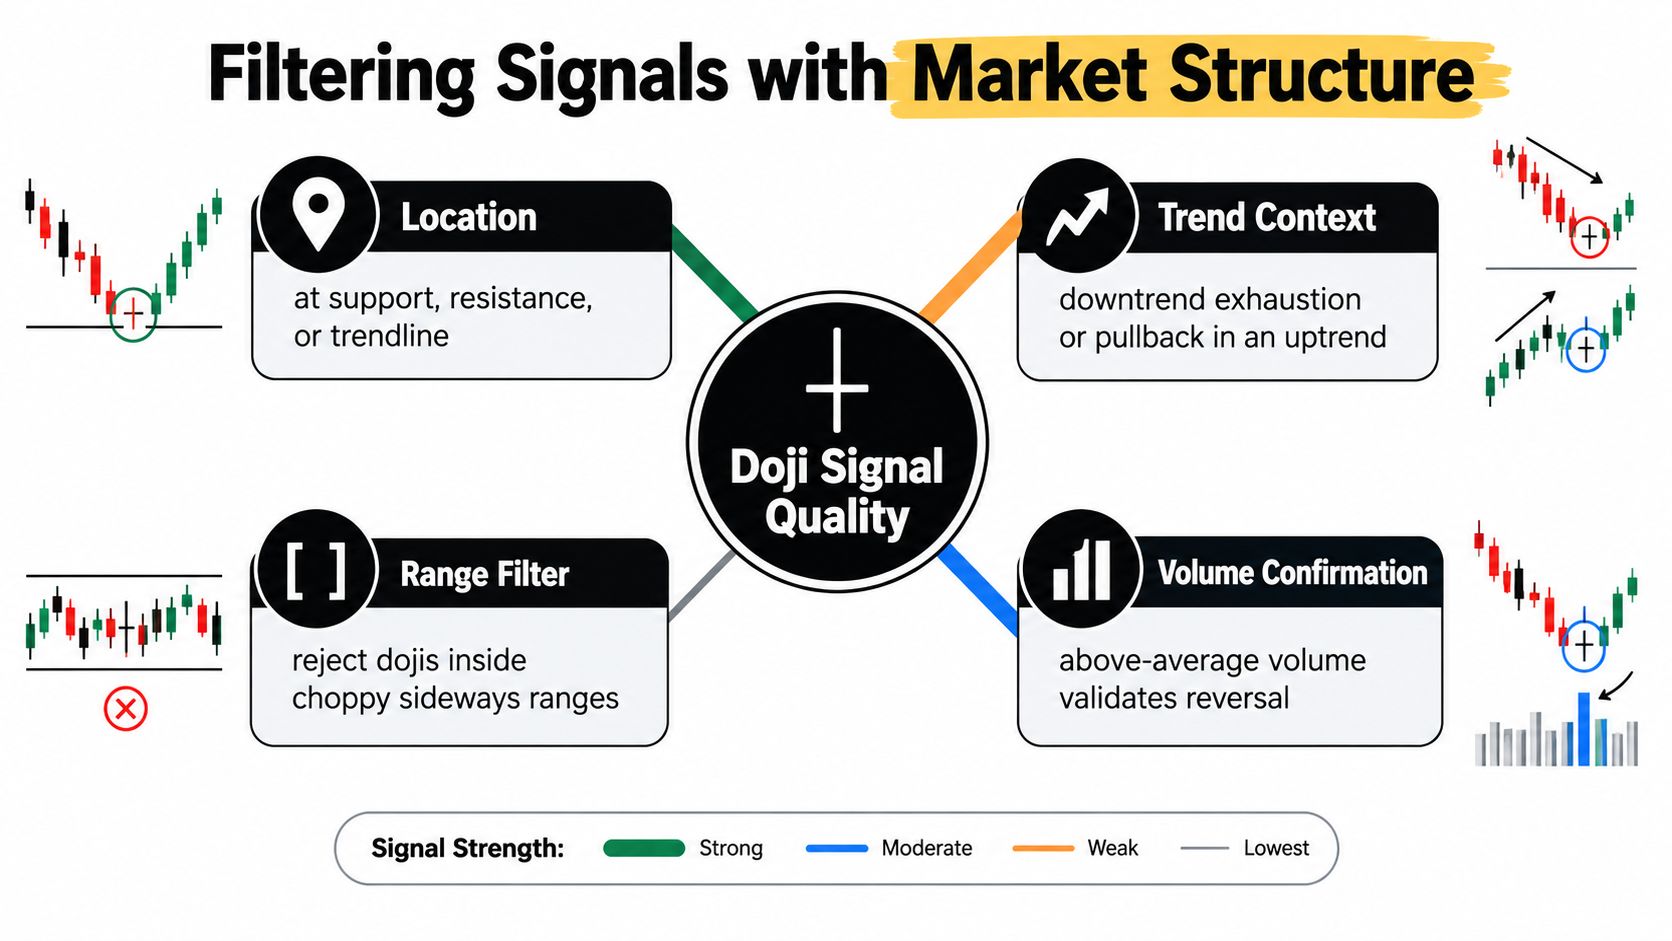
A doji in the middle of a congested range is usually a poor trade. Price has no clear level to defend, no obvious imbalance to resolve, and no nearby invalidation point that makes risk easy to define. The candle's shape may look familiar, but the surrounding auction supplies no reason to expect a directional move.
Start with the higher timeframe
Before studying the candle, establish the larger structure. Is price making lower highs and lower lows, or is it pulling back within an established advance? A doji after a sustained decline can suggest exhaustion, while a doji during a healthy pullback may offer a continuation alert rather than a full reversal thesis.
Then mark the actual decision area. Look for prior support, a demand zone, a former breakout level, or a trendline that price has respected. Don't call a level meaningful merely because it sits close to the candle. Ask whether price previously reacted there and whether the current decline has reached an area where buyers have a reason to participate.
This market structure analysis framework helps keep the candle subordinate to the chart's larger logic.
Separate rejection from random movement
A lower wick matters most when it tests a level and fails to break it. If the doji's low sits well above support, the wick doesn't tell you that buyers defended support. It only tells you that price traded lower during that session.
Check the range against recent volatility as well. An extremely wide doji can create a stop distance that makes the trade unattractive, even if its location is excellent. A compact doji at a well-defined level often gives you a cleaner invalidation point.
Demand confirmation from participation
The next candle should close above the doji high before you treat the setup as bullish. Volume expansion on that confirmation candle adds useful evidence because it shows that more participants supported the directional move. It doesn't guarantee success, but it helps distinguish a genuine range resolution from a thin push above a nearby high.
Location creates the opportunity. Confirmation decides whether the opportunity is actionable.
The practical filter is simple: established decline or constructive pullback, meaningful support, visible rejection of lower prices, acceptable range size, and a bullish close above the high. If several pieces are missing, ignore the doji and preserve your attention for a better location.
Execution and Risk Management Rules
A bullish doji is not an entry signal by itself. It is a conditional alert. The trade only becomes real if price confirms the idea and the surrounding structure still offers enough room to make the risk sensible.
Execution starts after the doji closes, not during it. I want the next candle to close above the doji high before I consider a long. A brief push above that level is not enough. Intrabar strength can vanish by the close, and then you are holding the same indecision candle you were supposed to treat with caution.
Define the trade before entry
Before placing an order, set the full thesis in advance:
- Prior decline or pullback: Price needs a clear path into the level, not random back-and-forth movement.
- Support proximity: The doji should form where buyer response makes sense, near structural support or a demand zone.
- Bullish confirmation: The following candle should close above the doji high.
- Invalidation: A move back below the doji low, or below the support that justified the setup, damages the long idea.
- Risk calculation: Position size comes from stop distance, not from how convincing the candle looks.
That last point matters more than newer traders expect. Confidence in the pattern does not reduce risk. If the setup needs a wider stop to sit below the doji low or under the supporting structure, accept that distance or skip the trade.
Size from the stop
A wide doji often creates a poor trade even when the location is good. The problem is not the pattern. The problem is that the invalidation point may sit far enough away to make the position inefficient.
Use a simple process:
- Decide how much account capital you are prepared to lose if the setup fails.
- Measure the distance from planned entry to the protective stop.
- Adjust the number of units so the defined loss stays within that limit.
- Recalculate if the entry changes or if the structural stop needs to move.
Do not tighten the stop just to make the trade fit. That usually turns normal noise into a forced exit. Traders who want more examples on balancing entry timing, stop placement, and nearby barriers can review MemeAssist risk analysis timing.
Target the next obstacle
Targets should come from structure, not from a reward multiple chosen in isolation. Mark the next supply zone, prior swing high, or resistance area first. That is the area most likely to interrupt the move.
If the next obstacle is too close, the setup may be technically valid and still not be worth taking. Passing is part of execution. A doji at demand can alert you to a possible reversal, but the chart still has to offer room for the trade to breathe and enough space for profit before it runs into opposing orders.
If price confirms and then stalls immediately, reassess quickly. The doji did its job by warning that indecision was present at an important level. It did not promise follow-through.
Statistical Realities and Backtesting Evidence
A bullish doji gets overrated when traders treat the candle itself as the edge. The more useful view is narrower. It marks indecision at a location that may matter, and the evidence shows that location and confirmation do far more work than the shape alone.
A comparative 2025 FOREX study examined eight heavily traded currency pairs across 13 years and reviewed more than 38 million one-minute historical candles. In that sample, researchers described doji patterns as unreliable reversal indicators. That is a clear warning against buying just because a bullish doji printed. The study is available here.
Results from other markets are mixed as well. An academic study of Thailand's SET50 component stocks used daily open, high, low, and close data from July 3, 2006, through June 30, 2016, and found that most candlestick reversal-pattern returns were not statistically different from zero. The same paper also discusses earlier findings that varied across S&P 500 and Dow Jones samples. That matters in practice because a doji does not behave the same way across every instrument, timeframe, or confirmation rule.
Accuracy isn't profitability
Even when a doji points the right way slightly more often than not, the trade can still be mediocre. Earlier-cited backtesting found modest directional accuracy, but the average long-side outcome and risk-adjusted return remained limited. That gap is the part traders miss.
Direction is not the same as usable expectancy. A pattern can call the next move often enough to look impressive in a screenshot, then give back most of that edge through transaction costs, spreads, slippage, gaps, and imperfect stop execution. Small statistical edges are fragile.
Test the complete process
Test the full setup, not the candle in isolation.
Define the prior trend, the support or demand condition, the doji's range, the confirmation trigger, the stop location, the target logic, the holding period, and realistic costs before looking at results. Then separate development testing from out-of-sample testing and compare the outcome with a plain alternative such as buy-and-hold or a simple trend rule.
Also track frequency. Rare setups can look strong on paper and fall apart in live conditions. Very common setups can reveal that the pattern is capturing ordinary noise. I treat a bullish doji as a conditional alert only. It earns a place in a trading plan when the full rule set holds up under repeated testing at meaningful zones.
Building Your Price Action Checklist
Use the checklist to slow yourself down before every potential long trade. The purpose isn't to make the setup complicated. It's to stop one attractive candle from overriding the evidence around it.
- Trend context: Has price declined meaningfully, or is this only a minor pause?
- Structural location: Is the doji sitting at support, demand, or another level that has shaped prior reactions?
- Candle behavior: Did price reject lower levels, and is the doji range reasonable for the instrument and timeframe?
- Confirmation: Has a completed candle closed above the doji high?
- Invalidation: Is the stop beneath the doji low or structural support, where the bullish idea is clearly wrong?
- Reward space: Does the next supply zone leave enough room for the planned risk?
- Execution discipline: Have you calculated position size from the stop distance rather than from conviction?
- Review process: Have you recorded the setup so you can evaluate whether the rules work across different conditions?
A “no” answer doesn't always mean the chart is bearish. It means the trade isn't sufficiently defined. That distinction protects you from forcing a story onto neutral price action.
The strongest habit is to treat every doji as an invitation to investigate, not permission to enter. Wait for structure, demand proof from the next candle, and let the stop determine size.
Colibri Trader offers price-action education covering setups such as the Bullish Doji Star and Dragonfly Doji, with an emphasis on supply and demand, discipline, and risk management. If you want a structured way to practise this decision process, visit Colibri Trader and explore its trading programs and learning resources.