




What Is a Bull Market in Stocks: A Price Action Guide
You buy a stock after it breaks to a new high, only to watch it pull back the next morning. Then the index recovers, financial headlines turn optimistic, and the same setup appears attractive again. This is the point where many traders ask, “What is a bull market in stocks, and how do I know whether I'm trading a real trend or just chasing a rally?”
The answer starts with the familiar 20% advance from a recent low, but that threshold is only the beginning. A workable trading definition also considers market structure, participation, demand, and the quality of pullbacks. Price action traders need to know not only whether an index is technically bullish, but also where buyers are likely to defend positions and where enthusiasm has already become excessive.
Understanding Bull Market Psychology
You buy during a period of hesitation because the chart has formed a higher low near an established support area. The trade works. Price moves higher, your unrealized profit grows, and a few days later your trading group is full of screenshots from people who caught the same move. The next pullback feels less threatening than the previous one, so you increase your position.
That emotional progression is common. Early in a bull market, many traders distrust the advance because the previous decline is still fresh. As prices continue to rise, skepticism gives way to participation. Positive trades then create confidence, confidence encourages larger positions, and larger positions can make ordinary pullbacks feel like buying opportunities.

From doubt to confidence
A bull market doesn't feel bullish at every moment. It can begin with poor sentiment, failed breakouts, and traders who still expect another collapse. The important change is behavioral. Buyers begin to absorb selling pressure at progressively higher prices, and sellers become less successful at pushing the market below previous swing lows.
The emotional cycle often develops in recognizable stages:
- Skepticism: Traders treat the advance as a temporary recovery and sell into strength.
- Acceptance: Higher highs and higher lows become harder to dismiss, so more participants enter.
- Excitement: Traders focus on upside targets and begin to assume that pullbacks will resolve quickly.
- Complacency: Participants stop defining risk because recent trades have been easy.
- Euphoria: Buyers chase extended price, often far from meaningful demand.
This cycle doesn't provide a precise timing signal. A market can remain optimistic for a long time, and a euphoric reading can stay high while prices continue higher. It does, however, help explain why traders often make their worst decisions after a series of successful trades.
Why rallies feel different
A short rally can lift an index without changing the broader structure. In a healthier bull phase, buyers repeatedly defend pullbacks, sellers struggle to create lower highs, and strong stocks continue attracting demand after brief consolidations. The difference is persistence, not a single green candle.
That distinction matters because emotional confidence can imitate technical confirmation. A trader who feels optimistic may call every bounce a new uptrend, while a disciplined trader waits for evidence in the chart. A useful guide to trading psychology can help separate confidence based on a defined process from confidence based only on recent profits.
Practical rule: Let the chart establish the trend. Your mood should never be the evidence.
A bull market also changes how losses feel. Traders may tolerate weak setups because they expect the general environment to rescue them. Sometimes it does. That outcome can reinforce bad habits, even though the trade had no clear entry, invalidation level, or favorable relationship between risk and potential reward.
The better response to a rising market is not blind optimism. It's a written plan for pullbacks, failed breakouts, and sudden changes in structure. When the market makes trading feel easy, reduce emotional decision-making rather than reducing standards.
What Defines a Bull Market in Stocks
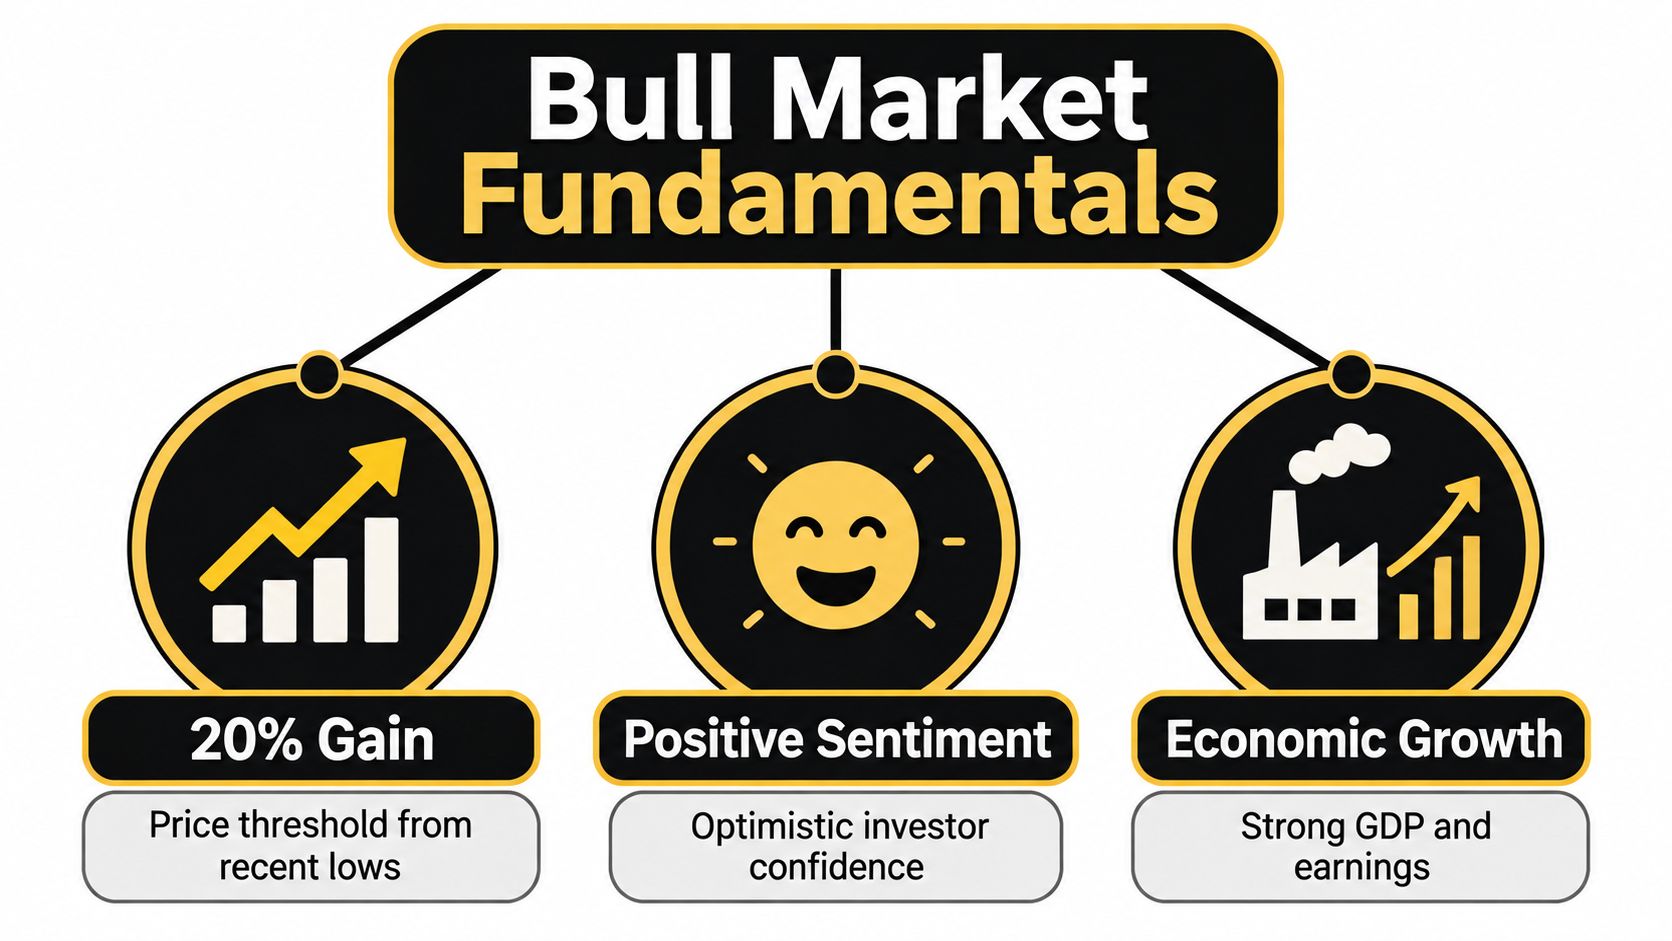
The standard shorthand is straightforward. A widely used market convention defines a bull market as a rise of at least 20% from a recent low, while the opposite phase is commonly associated with a 20% decline from a peak. S&P Dow Jones Indices describes its S&P 500 framework as beginning a bull market when the S&P 500 Price Index rises 20% from its previous low and ending it after a high is followed by a 20% decline.
Use the threshold as a label, not a complete strategy
The 20% rule is useful because it creates a common language. A 19% rebound may still be treated as a recovery, while a 20% move is often labeled a bull market. That distinction helps investors discuss market phases consistently, but it doesn't tell a trader where to enter, where to place a stop, or whether the next breakout deserves confidence.
For those decisions, examine the structure behind the percentage move:
- Mark the major low and subsequent swing points. A rising sequence of higher highs and higher lows supports a sustained advance.
- Check whether the index is recovering toward previous highs. A market that rises 20% and then immediately forms repeated lower highs has less constructive structure than one that continues to build upward.
- Study the pullbacks. Orderly retracements that hold former resistance or demand zones show a different balance between buyers and sellers than sharp declines that erase prior gains.
- Compare the index with participation. A headline gain can conceal weakness beneath the surface.
Institutional commentary also emphasizes that the 20% threshold isn't universal. Bull markets usually develop across multiple months or years and include intermittent pullbacks, so the percentage alone can't distinguish every durable trend from every sharp recovery. A discussion of bull markets and market cycles places greater practical weight on persistence, higher highs, and recovery toward new highs.
The index can hide the market underneath
Suppose a capitalization-weighted index rises because a small group of very large companies attracts most of the buying. The index may satisfy the conventional definition, while many individual stocks remain below important trend measures. That isn't automatically a sell signal, but it changes the quality of opportunities available to traders.
This is why a broad market definition and a trading definition should sit side by side. The first tells you the phase being discussed. The second asks whether the current chart offers enough demand, participation, and follow-through to justify a position.
A comparison of bull and bear markets is useful for context, but the practical decision still comes from price. Traders don't buy a label. They buy a setup with a defined invalidation point.
Historical Bull Market Patterns and Performance
Historical data shows why traders shouldn't assume that a bull market is merely a fast rebound. Since the S&P 500 launched in 1957, Forbes identifies 12 bull markets through 2022, which works out to roughly one new bull market every 5.5 years on average. The same historical review reports that the average bull market lasted nearly five years and generated an average S&P 500 gain of more than 169%. These figures come from Forbes' review of bull market history.
That average conceals substantial variation. Some advances are shorter and more volatile, while others create years of opportunity through repeated breakouts and pullbacks. A trader who sells every position only because an advance feels old can exit a functioning trend long before price confirms a change.
Duration changes the trader's expectations
The longest modern U.S. bull market began in March 2009 and ended in February 2020, lifting the S&P 500 by over 300%, according to the same Forbes historical review. Over a comparable March 2009 to January 2020 period, TD reported that the S&P 500 climbed 378%, while Canada's S&P/TSX Composite Index rose 125%.
The different index results matter because they show that a bull market isn't a single uniform experience. A trader focused on one country, sector, or stock may see a much weaker advance than the headline U.S. index. Global participation can expand the opportunity set, but it can also introduce different structures, currency considerations, and levels of volatility.
Historical averages aren't forecasts
An average duration doesn't tell you how long the current bull market will continue. An average gain doesn't provide a rational target for the next trade. Those numbers are useful for challenging simplistic assumptions, not for replacing analysis.
History does offer several practical lessons:
- Don't confuse age with reversal: A long-running trend can continue while its structure remains intact.
- Expect interruptions: Sustained advances still contain pullbacks, failed breakouts, and periods of sideways movement.
- Measure your own market: The S&P 500, a sector ETF, and an individual stock can occupy different phases at the same time.
- Use history to manage expectations: Large cumulative gains usually develop through many individual decisions, not one perfect entry.
The broad pattern repeats because crowd behavior repeats. Buyers become more willing to pay higher prices after successful advances, while sellers become more cautious when declines fail to continue. Price action gives traders a way to observe that balance without assuming that the past will reproduce itself exactly.
Market Breadth and Bull Market Health
An index can keep climbing while the average stock lags behind. A momentum trader may buy the strongest leaders after an index breakout. A swing trader may first check whether enough stocks are advancing to support continuation. A price action trader usually reads the individual chart, then uses breadth to judge the market conditions around the setup.
A stock bull market is commonly defined as a sustained advance of roughly 20% or more from a recent low. That threshold describes price movement, not participation. Investopedia's explanation of bull and bear market structure highlights breadth, the extent to which rising prices are distributed across the market. Our guide to the breadth of the market explains how traders can read that participation on a chart.
Broad participation versus narrow leadership
When many components rise together, demand is spread across the market. That can support breakouts and give traders more viable charts to study. If only a few large-cap names carry the index, the headline can remain strong while the average stock offers fewer clean setups.
Narrow leadership does not automatically signal a reversal. Strong leaders can continue outperforming, and participation can broaden later. The practical warning is more precise: when fewer stocks participate as the index rises, traders should become more selective. A rally supported by a shrinking group of names has less confirmation beneath the headline advance.
A 2026 Berkshire Edge market note described the S&P 500 as being near record highs while only about 57% of constituents were above their 200-day moving averages and half were above their 50-day moving averages, suggesting that participation was less uniform than the index alone implied. The figures and interpretation appear in the Berkshire Edge market note.
How trading style changes the response
| Approach | What it prioritizes | Main adjustment when breadth narrows |
|---|---|---|
| Momentum trading | Breakouts and relative strength | Focus on leaders and demand faster confirmation |
| Swing trading | Pullbacks and continuation | Reduce tolerance for weak retests and failed support |
| Price action trading | Reactions at meaningful levels | Wait for rejection or confirmation instead of buying index strength alone |
Breadth should shape trade selection, stop placement, and expectations for follow-through. A narrowing market can still produce a valid demand-zone reaction or a well-formed BOSS setup, but breadth gives no reason to buy every breakout. The level and the price response remain the trade decision.
Breadth is context, not permission. The price action at your level still has to confirm the trade.
Use breadth to answer what the index chart cannot: are buyers creating opportunities across many stocks, or concentrating risk in a small group of leaders?
Price Action Strategies for Bull Markets
Bull markets favor traders who buy controlled weakness rather than chase extended strength. The central idea is simple: identify a higher-timeframe demand zone, wait for price to return to it, and require evidence that buyers are defending the area.
The BOSS pattern, or Bullish On Strong Support, fits that environment. The name describes the relationship between the signal and its location. A bullish candle matters more when it forms at meaningful support than when it appears in the middle of a random range.

Building a BOSS setup
Start with the larger structure before looking for an entry:
- Establish directional context. Look for higher highs and higher lows on the timeframe that controls your trade.
- Locate strong support or demand. Mark an area where price previously left decisively, rather than drawing every minor reaction as a zone.
- Wait for the return. A BOSS setup develops when price pulls back into that area, not while it is already far above it.
- Read the reaction. A pinbar with a lower wick, a bullish engulfing candle, or an inside bar followed by an upside break can show that sellers failed to maintain control.
- Define invalidation before entry. The trade thesis is wrong if price breaks and accepts below the support or demand area that was supposed to hold.
An inside bar can offer compression near demand, but it isn't bullish just because it has a small range. A pinbar can show rejection, but the rejection must occur at a level that matters. An engulfing candle can provide confirmation, but entering after a very large candle may create poor risk placement.
This video provides a visual explanation of the price action process and the type of chart reading involved:
Supply and demand in an advancing market
In a bull market, demand zones often become more useful for planning pullback entries, while supply zones help identify where price may pause or reject. That doesn't mean every demand zone will hold. A zone can weaken after repeated tests, and a strong bearish reaction from supply can signal that the current advance needs more time to consolidate.
A practical sequence looks like this:
- Price advances and leaves a clear demand area.
- The market forms a pullback rather than breaking the prior swing low.
- Price returns to demand and produces a rejection.
- The trader enters only after the chosen confirmation, with the stop beyond the invalidation point.
- The first target comes from nearby supply, prior highs, or another area where sellers previously appeared.
Don't buy because the index has risen 20%. Buy when the individual chart offers a location, a reaction, and a risk level that make sense. The index can provide a favorable backdrop, but the setup must still carry its own evidence.
Building Your Bull Market Trading Plan
A usable bull market plan should prevent two opposite mistakes. The first is fighting a healthy trend because every pullback feels dangerous. The second is buying anything that rises because the broader market appears supportive.
Begin with a simple market read:
- Structure: Is the relevant index or asset forming higher highs and higher lows?
- Participation: Are multiple stocks contributing, or are a few leaders carrying the headline move?
- Location: Is the stock approaching demand, breaking from a base, or already extended?
- Trigger: Has price produced a clear rejection, engulfing pattern, inside-bar break, or retest?
- Risk: Where is the trade invalidated, and does the position size respect that distance?
Adjust the plan as conditions mature
Early in a bull phase, skepticism can produce sharp reversals and uneven breakouts. A trader may need confirmation because the new trend hasn't established a reliable rhythm. During a more developed advance, pullbacks into well-defined demand can offer cleaner continuation trades, but crowded leadership and narrow participation deserve closer attention.
Late-stage conditions require discipline rather than a dramatic prediction. Watch for failed higher highs, deeper breaks through demand, repeated inability to reclaim broken support, and a growing dependence on a small group of stocks. Those observations don't require an exact market top. They tell you to reduce aggressive entries, tighten selection, and avoid treating every dip as an automatic opportunity.
Position sizing should follow the distance to invalidation, not your excitement about the market. A setup with a wide stop needs a smaller position than a setup with a compact, technically meaningful stop. If you can't identify the level that proves the idea wrong, you don't yet have a trade plan.
Keep a journal that records the setup type, location, trigger, stop, target, and result. Review whether your BOSS patterns work best at fresh demand, whether breakout retests fail when breadth is narrow, and whether you enter too late after large confirmation candles. That feedback turns a general bull market concept into rules fitted to your own execution.
Colibri Trader offers price action education built around market structure, supply and demand, trading psychology, and practical patterns such as BOSS setups. If you want to practice identifying demand zones and planning bull market trades without relying on complicated indicators, visit Colibri Trader and explore its training resources.