




Rhodium Price vs Gold: A Trader’s Comparison
Rhodium once traded at roughly 15 times the price of gold, yet most traders can't trade it like gold. The U.S. Geological Survey's platinum-group-metals data put rhodium's 2021 annual average at $20,254 per troy ounce, 81% above its 2020 average. That price gap looked spectacular, but it didn't make rhodium a superior version of gold. It exposed a market with very different liquidity, supply dynamics, and execution risk.
A price chart alone misses the decision that matters. Can you enter and exit with reasonable control? Can your stop survive a gap? Does the market offer enough continuous participation for a price-action setup to mean what you think it means?
The rhodium price vs gold comparison becomes useful only after those questions are answered. Gold offers a deeper, more standardized market with a monetary and investment-led demand base. Rhodium offers potentially explosive moves, but its industrial concentration and limited supply can turn a trade into an execution problem.
Introduction
The practical conclusion is straightforward. Gold is generally the more repeatable trading instrument, while rhodium is a tactical exposure that demands smaller sizing, wider tolerance for slippage, and much more selective participation. The right choice depends less on which metal has the higher quoted price and more on whether your trading process can handle the market's behavior.
The comparison below focuses on five issues:
- Price history: How each metal has behaved through major repricing phases.
- Demand drivers: Why gold responds to monetary narratives while rhodium responds to automotive and emissions conditions.
- Investability: Whether a trader can access, size, and exit a position efficiently.
- Risk and reward: What the upside potential costs in drawdown and uncertainty.
- Price action: How supply and demand zones, confirmation, and stops must change between the two markets.
That framework prevents a common mistake. Traders see rhodium trading above gold and assume the market is assigning a premium to rarity. In practice, rhodium's premium can reflect a temporary physical squeeze, while gold's pricing structure reflects a much broader financial ecosystem.
Practical rule: A higher price per ounce doesn't mean a better asset. It often means a different risk model.
By the end, you should be able to make a specific decision. If you want a liquid market for disciplined, repeatable setups, gold is usually the logical starting point. If you have specialist access, strict risk controls, and a clear reason to trade a supply or automotive shock, rhodium may belong in a small tactical allocation rather than at the center of your plan.
Price History and Volatility Compared
Rhodium's price history makes a simple comparison with gold unreliable. Johnson Matthey reported a rise from about $17,000 in January 2021 to a $30,000 March high, followed by a fall below $20,000 in June and briefly under $12,000 in September. Rhodium then stabilized around $14,000 for the rest of the year, according to its PGM market report.
That was a violent repricing, not an orderly trend. The September low still stood above rhodium's pre-2020 record from June 2008. A market can therefore reset the meaning of “cheap” faster than a trader's historical range suggests.
Gold trades with a steadier structure. The LBMA Gold Price provides a major London reference point for daily pricing. It does not remove volatility, yet broader participation, standardized pricing, and deeper financial access usually make execution and position management more practical than in rhodium.
| Metric | Rhodium | Gold |
|---|---|---|
| 2021 annual average | $20,254 per troy ounce, 81% above 2020, according to the USGS platinum-group-metals report | London pricing is benchmarked through the LBMA Gold Price, as described in the USGS report |
| 2021 price path | About $17,000 in January, $30,000 in March, below $12,000 in September, then around $14,000, according to Johnson Matthey | More standardized benchmark structure |
| Historical ratio behavior | Below gold in 2016, then above 17 times gold at the 2021 peak, according to Rhodium Prices | The reference metal in the comparison |
| 2026 snapshot | Around 218% of gold's price in a late-September market note, according to Clear Finances | A deeper and more liquid market structure |
The ratio is a trading variable, not a permanent valuation rule. One market summary placed rhodium at about $575 per ounce against gold at $1,150 in 2016. By March 2021, it placed rhodium near $29,800 and gold near $1,740, implying a ratio above 17:1, according to Rhodium Prices' historical comparison.
A spread strategy needs explicit re-hedging thresholds. A ratio that moves from below gold to a double-digit multiple cannot be managed with a fixed band and an assumption that mean reversion will arrive. Traders must also account for market volatility and its trading implications, because rhodium's gaps and thin execution can invalidate the assumptions behind a conventional pairs trade.
What Moves Each Metal
Gold and rhodium may share a precious-metals label, but their demand engines point in different directions.
Gold's market is mainly monetary and investment-led. Investors use it for safe-haven exposure, portfolio diversification, and long-term wealth preservation. Jewelry also matters, while central-bank activity and macroeconomic expectations can influence the broader narrative. London's LBMA benchmark adds a standardized reference point to a market that supports extensive financial trading.
Rhodium's demand is industrially concentrated. Autocatalysts account for most consumption, tying the metal to vehicle production, emissions rules, and catalyst loadings. Legally mandated emissions compliance is central to the squeeze story because manufacturers may need the metal to meet standards even when its price has become uncomfortable. The automotive and green-technology discussion of rhodium demand captures that difference from gold's monetary role.
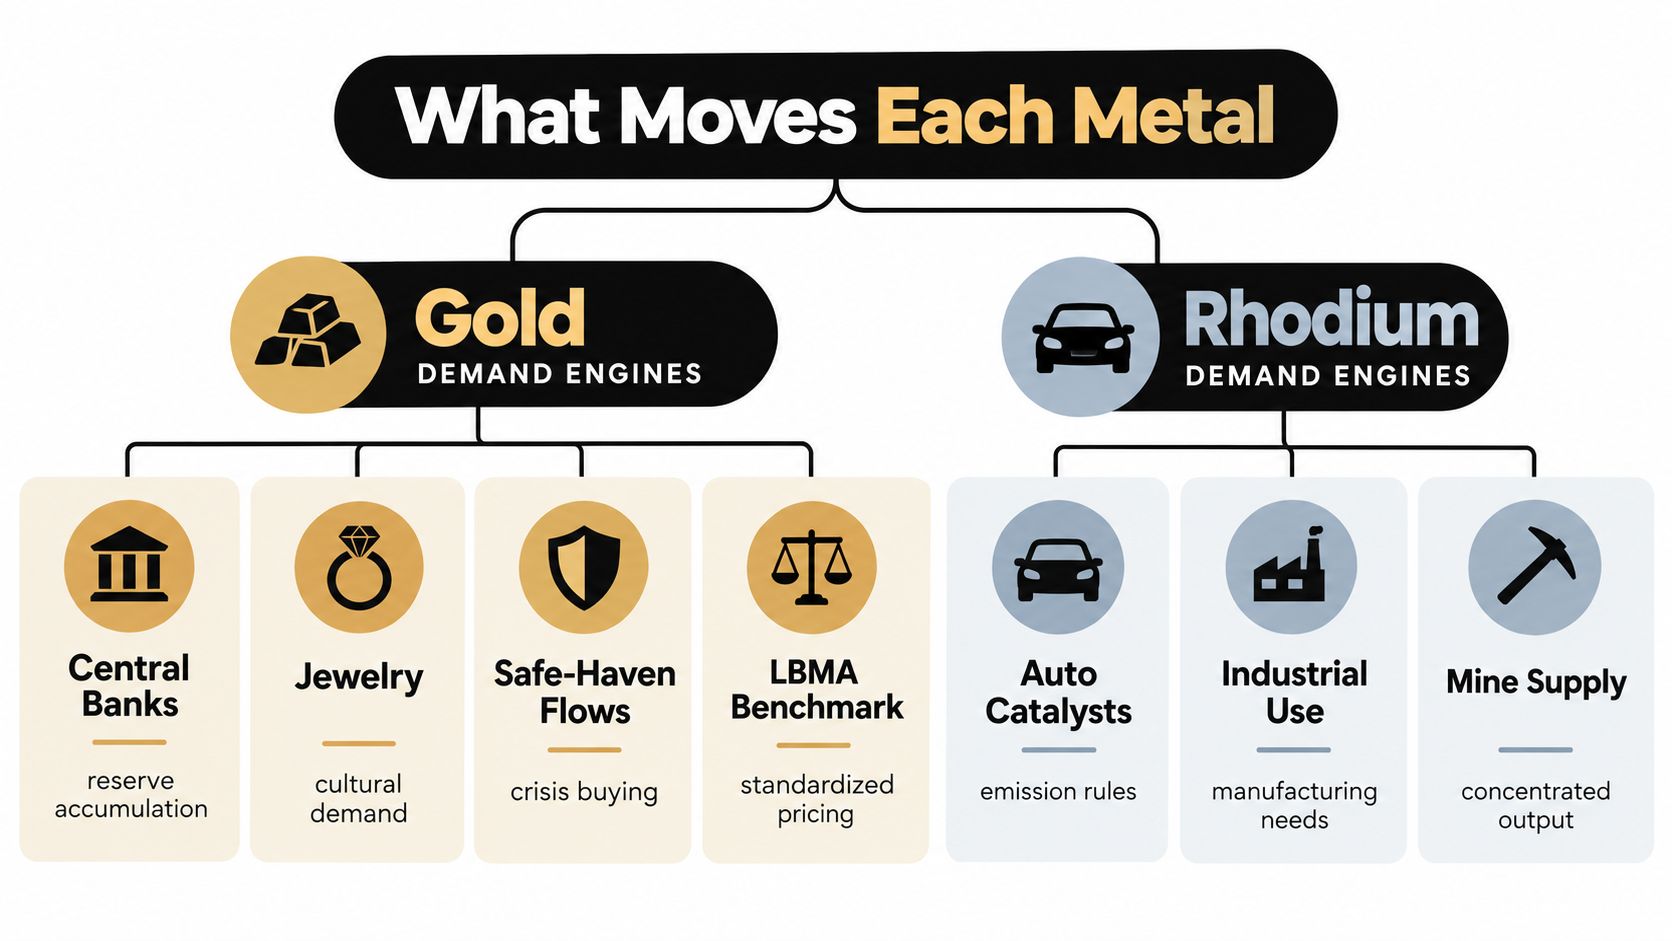
Supply makes the divergence sharper. Rhodium is mined largely as a by-product, and production is highly concentrated. A price rally therefore doesn't automatically bring a wave of new rhodium supply to market. Producers' output decisions depend on the economics and operating conditions of the host metals as well.
Track the right catalyst
For gold, traders usually monitor the macro backdrop:
- Real-rate expectations: Falling real yields can support the appeal of a non-yielding asset.
- Risk sentiment: Geopolitical stress and financial uncertainty can increase safe-haven interest.
- Currency conditions: Gold often responds to changes in the dollar and broader monetary expectations.
- Investment flows: The financial nature of the market makes positioning and portfolio demand relevant.
For rhodium, the useful questions are more industrial:
- Are vehicle manufacturers facing tighter emissions requirements?
- Are catalyst loadings changing?
- Is global vehicle production strengthening or weakening?
- Are mine disruptions, recycling changes, or inventory shortages altering immediate availability?
This creates the key insight. Rhodium can appear to be the higher-value metal while remaining the more cyclical and policy-sensitive asset. Gold's price is tied to confidence in money, rates, and risk. Rhodium's price is tied to whether industrial users need a limited amount of a specialized input immediately.
Is Rhodium Investable Like Gold
Price level alone tells you little about investability. The first question is whether you can enter, manage, and exit a position without execution becoming the dominant risk.
Rhodium is a small, inelastic, industrially concentrated market. Its limited inventories can produce abrupt rallies or severe drawdowns when physical requirements change. A modest shift in demand may meet little immediately available supply, so the chart can move faster than a trader's order.
That changes how risk must be managed. Wider spreads, fewer dependable quotes, and jumps between transactions can turn a stop into an instruction rather than a guaranteed exit level. If price gaps through the stop, the realized loss may exceed the planned amount. A correct directional forecast does not solve poor execution.
Gold offers a different operating environment. Futures, exchange-traded products, and physical markets bring in more participants and hedgers. Every gold trade still carries risk, yet exposure is generally easier to size, monitor, and repeat. The steadier structure also gives price-action traders clearer zones and more practical room to adjust.
Access determines strategy
Retail access creates another dividing line. Gold is available through familiar brokerage products and established venues. Rhodium exposure is more specialized, while physical ownership can add premiums, storage, verification, and a less convenient resale process. Precious-metals listings may present rhodium as a high-priced specialist market rather than a straightforward portfolio holding, as shown on Kitco's precious-metals price pages.
Before studying a rhodium chart, answer four operational questions:
- What exact instrument am I trading? A reference quote, physical metal, certificate, or specialized derivative can produce very different outcomes.
- Who provides liquidity? A visible price does not confirm that meaningful size is available at that level.
- How is the position closed? Exit terms deserve the same attention as entry conditions.
- What happens during a gap? Check whether execution is guaranteed and which conditions apply.
A commodity trading platform may simplify access, but availability does not prove reliable liquidity. Rhodium therefore requires smaller sizing, greater tolerance for slippage, and closer attention to exit mechanics. Gold supports more repeatable execution. If you cannot size and close the position with confidence, rhodium's apparent upside is not an investable advantage.
Risk and Reward Profiles Side by Side
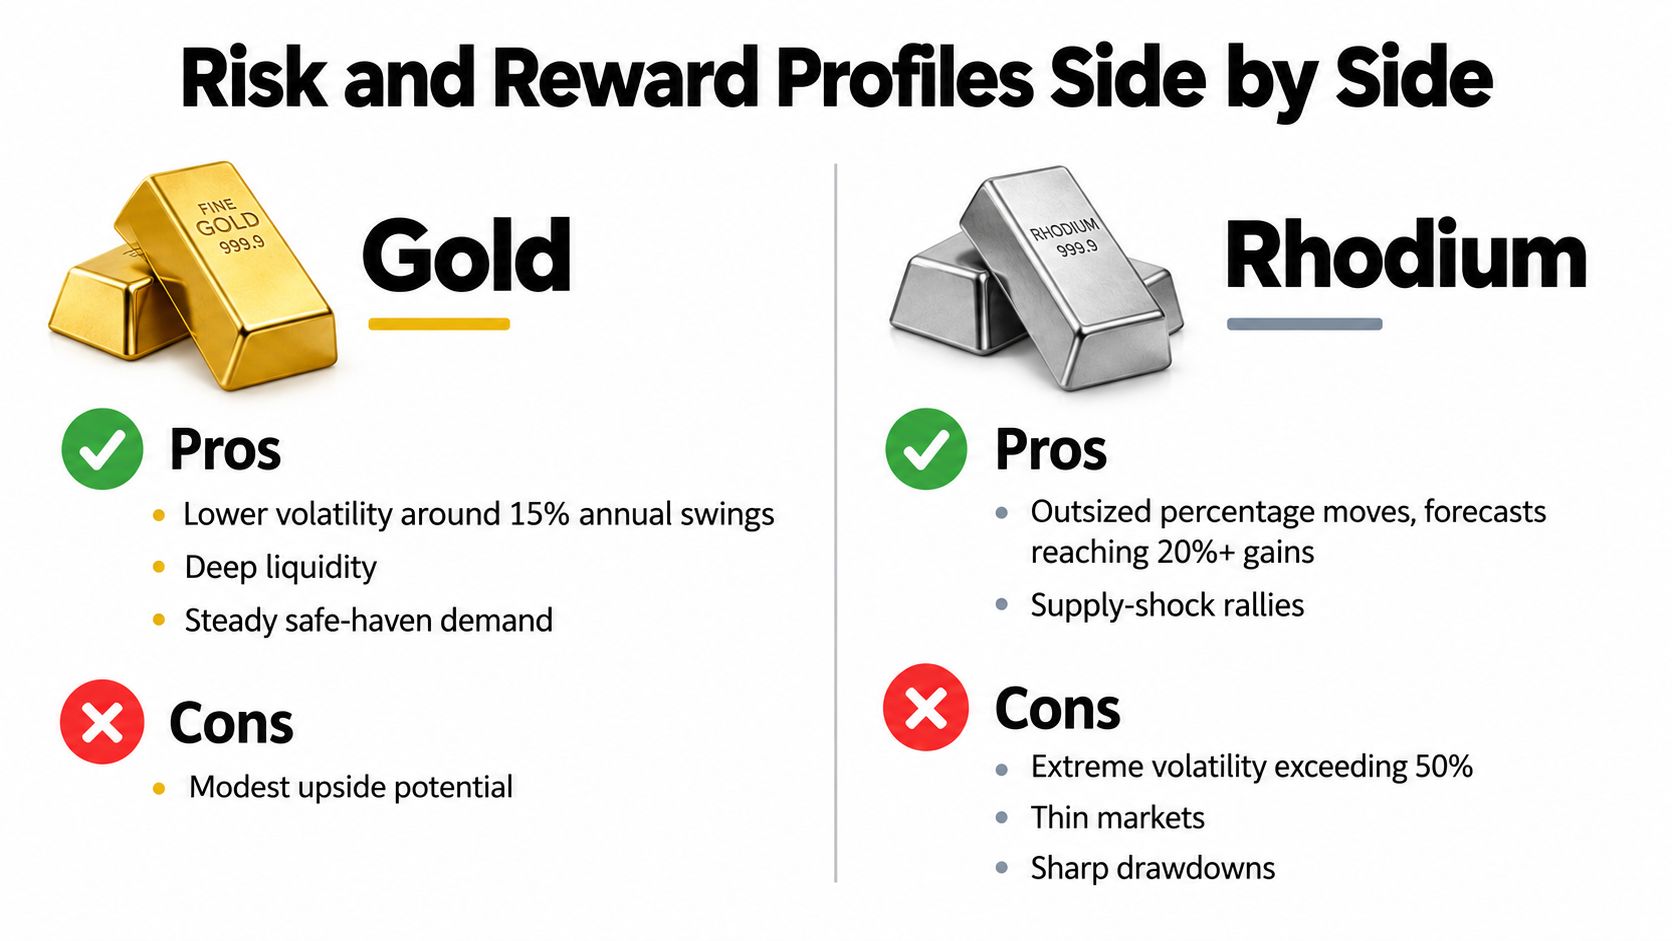
Rhodium's attraction is obvious. A thin market can produce outsized percentage moves when supply tightens or industrial users compete for limited material. A 2026 market note cited Metals Focus forecasting a 62% rise in rhodium during 2026, with a year-end average near $10,200 per ounce, while recent quotes placed rhodium around $8,400 against gold near the low $3,000s, according to Kitco's precious-metals pricing coverage.
That projection is not a trading plan. It's a reminder that rhodium's upside narrative can become powerful when market participants expect a supply-demand imbalance. The same structure can work against a long position. The 2021 fall from $30,000 toward $12,000, documented by Johnson Matthey, shows how quickly an apparently unstoppable move can reverse.
Gold offers less explosive potential, but its market structure supports more predictable position management. A trader can build exposure gradually, define zones with more confidence, and adjust size without assuming that a small order will distort the trade.
Position size is the control mechanism
If rhodium's annualized volatility commonly sits between 50% and 80%, and can move above 100%, the position should be materially smaller than a comparable gold trade, based on the Clear Finances volatility discussion. The exact size depends on the instrument, account, stop distance, and liquidity, so there's no universal percentage to apply.
The practical distinction is more useful than a winner-and-loser ranking:
- Gold is strategic: It suits repeatable setups, gradual exposure, and disciplined compounding.
- Rhodium is tactical: It suits high-conviction situations where the trader accepts gaps, limited liquidity, and sharp reversals.
- Gold rewards process consistency: A trader can focus on location, confirmation, and risk without every position becoming a liquidity experiment.
- Rhodium demands event awareness: A technically attractive level can fail if industrial supply expectations change suddenly.
For a broader framework on comparing opportunity, downside, and market structure before committing capital, this guide to evaluating DeFi opportunities offers a useful decision-making perspective that applies beyond digital assets.
Trading Both Metals with Price Action
Price action works in both metals, but gold usually offers the cleaner chart and rhodium requires more room for error. The setup process should reflect that difference.
Gold's continuous participation often produces clearer supply and demand zones. A sharp move away from a base, a rejection at a prior level, or an engulfing candle after a retest can create a logical entry structure. Mark the zone, wait for price to return, and place invalidation beyond the area instead of using an arbitrary stop distance.
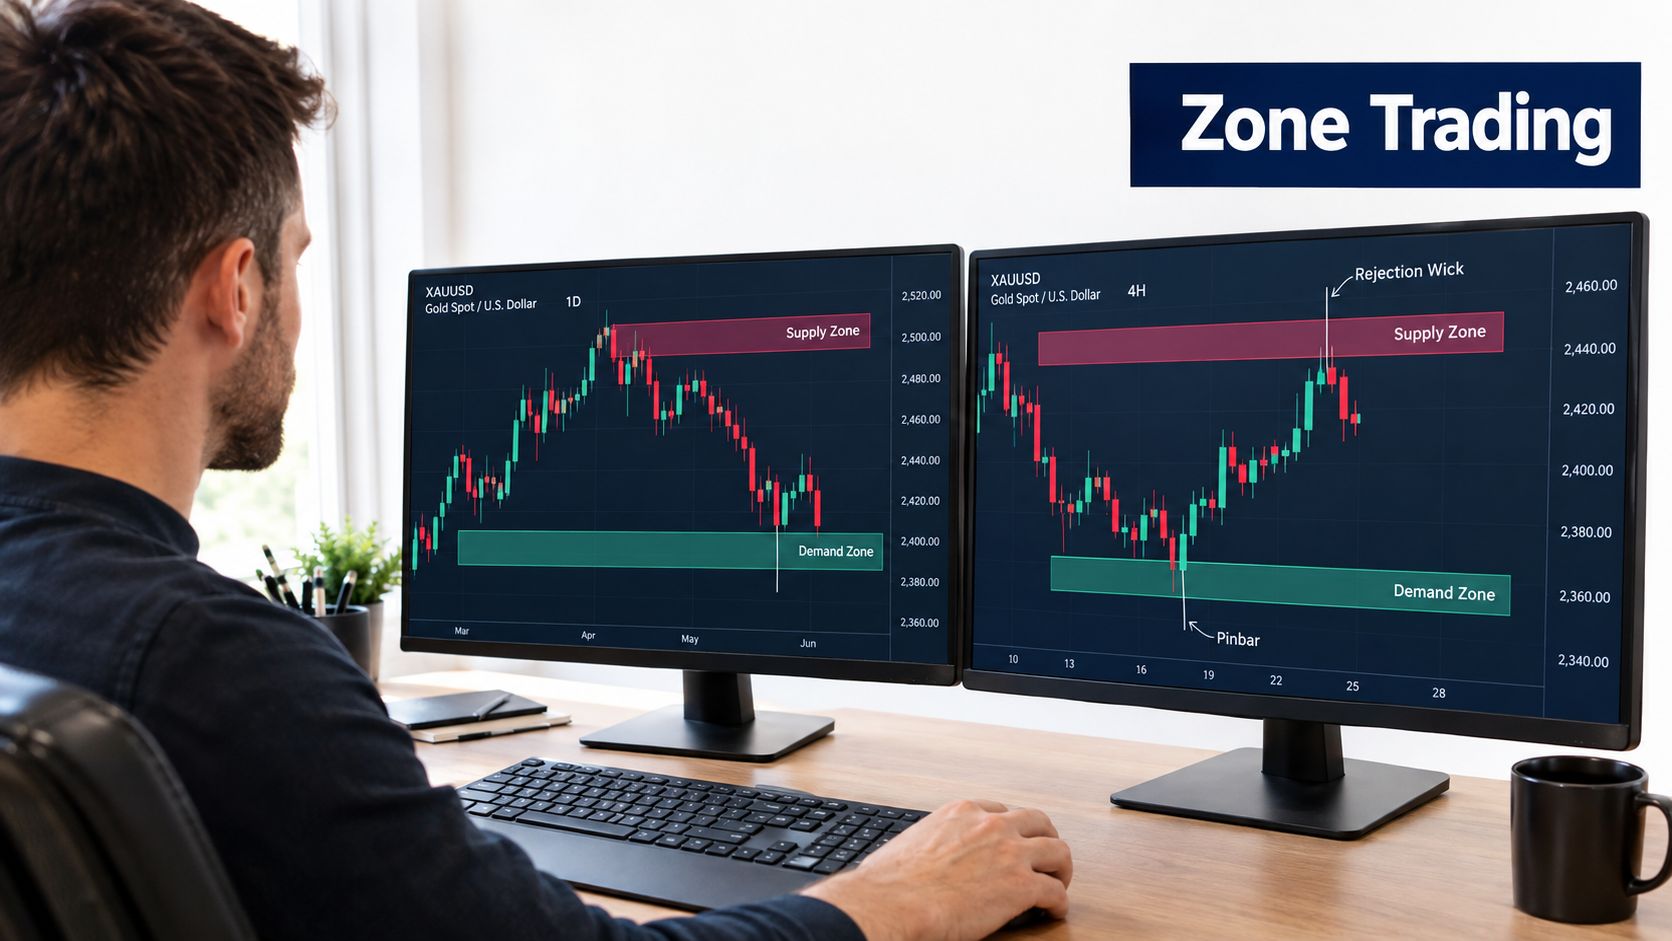
If gold returns to prior demand after a controlled decline, wait for a rejection wick or bullish engulfing candle. Enter after buyers show control, then set invalidation below the zone. A clean departure allows management around visible reactions, with less need to account for an unexpected jump between quotes.
Rhodium calls for stricter setup filters. Thin participation can make a zone look narrower and cleaner than it is. Sudden repricing may also skip the planned entry or stop. Widen the zone, require stronger confirmation, reduce risk per trade, and accept that the fill may differ materially from the chart level.
Execution rule: On a thin instrument, the zone is a region of uncertainty, not a precise line.
A rhodium setup may start with a sharp rally away from demand after a supply shock. Wait for a retest and decisive rejection instead of buying the first touch. Use a smaller position and place invalidation beyond the wider zone. If price gaps through the level, do not add just because the position is cheaper. The original trade thesis has weakened.
Supply zones follow the same process. On gold, bearish rejection followed by an engulfing candle can define a structured short setup. On rhodium, treat the zone as more vulnerable to abrupt failure, and allow for a stop executing beyond the intended level. A detailed price-action trading approach keeps analysis focused on observable price behavior while the trade plan accounts for gaps between available quotes.
Which Metal Fits Your Trading
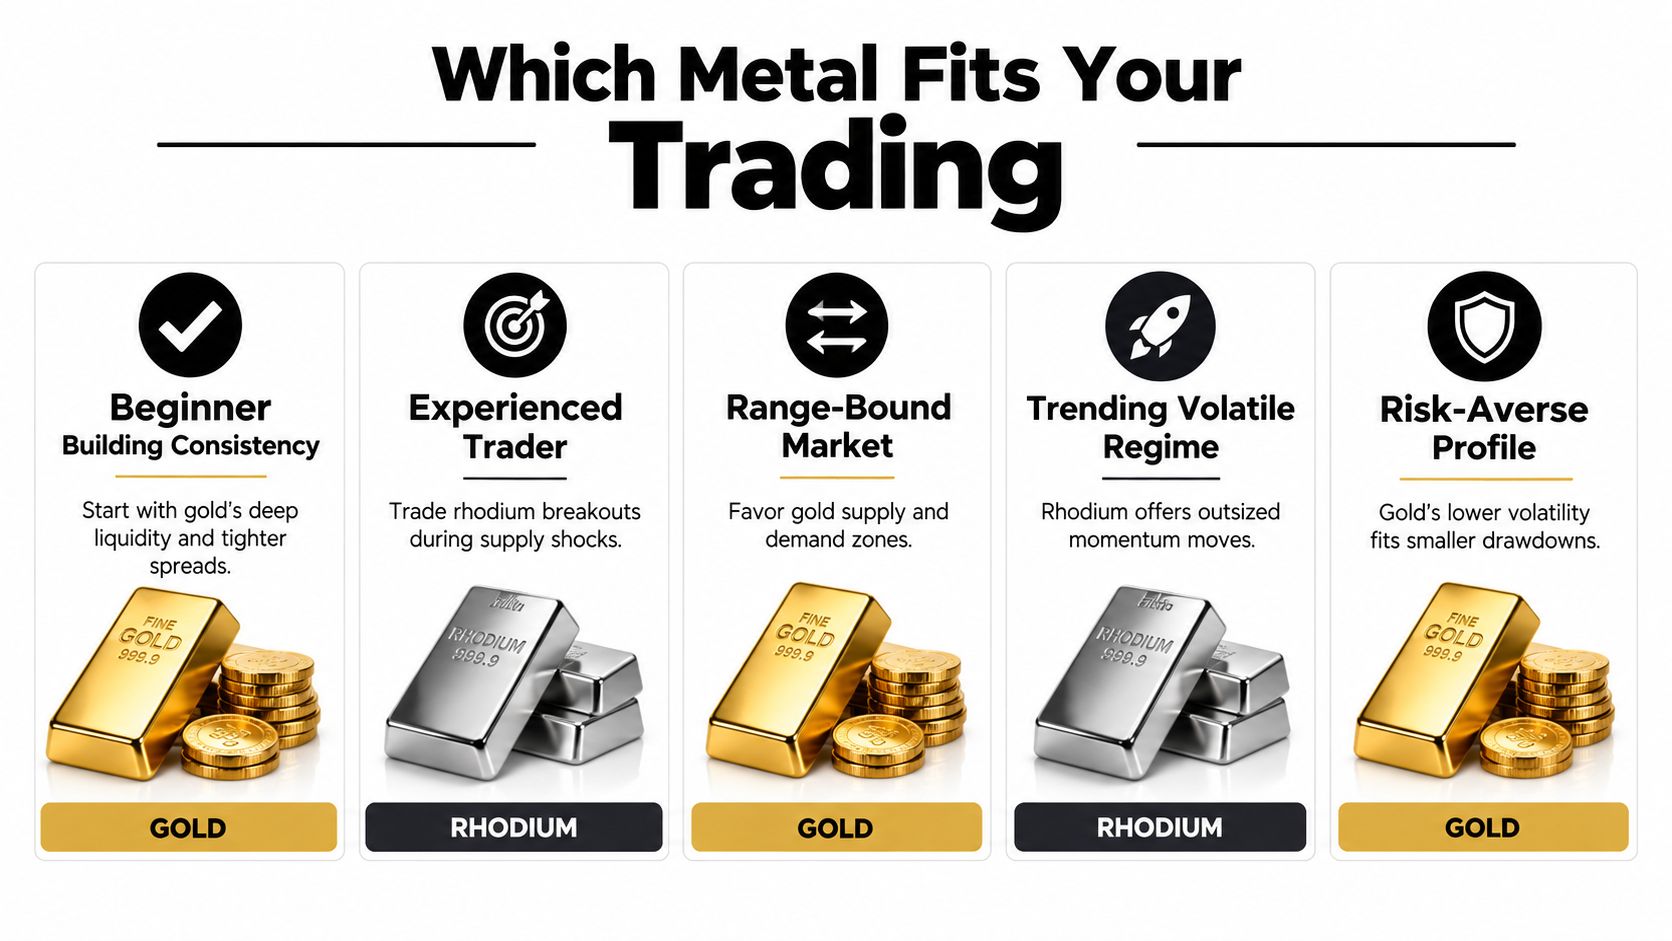
Gold is the better starting point for a beginner building consistency. Its broader liquidity and standardized benchmark structure give a new trader more room to learn location, confirmation, and position management without making every trade depend on specialist execution.
An experienced trader may use rhodium differently. It can function as a small satellite position during a clear supply shock, a sharp automotive-cycle change, or a strong policy-driven catalyst. That doesn't mean buying because the metal is expensive or because a ratio looks unusual. It means waiting for a specific setup and accepting that the position may need to be smaller than expected.
Use this checklist before choosing:
- Account size: Can you keep rhodium exposure small enough to survive a gap?
- Drawdown tolerance: Will a sharp adverse move force you to abandon the plan?
- Instrument access: Do you understand the product, spread, settlement, and exit process?
- Monitoring capacity: Can you respond when the market reprices outside normal trading behavior?
- Trading objective: Are you building repeatable skill, or pursuing a narrowly defined tactical opportunity?
Gold tends to fit range-bound conditions where supply and demand zones hold cleanly. Rhodium becomes more interesting in a volatile directional regime, but its momentum potential comes with less dependable execution. A risk-averse trader should favor gold. A specialist who understands the access constraints may consider rhodium, but only with strict limits.
The next useful step is to test your trading habits rather than chase the more dramatic chart. The free Trading Potential Quiz and the first two chapters of the price-action bestseller at Colibri Trader can help you identify whether your process is ready for gold's structured market or rhodium's harsher execution demands.
Colibri Trader teaches a straightforward, price-action approach built around supply and demand, disciplined risk management, and practical chart reading. Take the free Trading Potential Quiz, read the first chapters, and visit Colibri Trader to build a process that can handle both steady gold setups and rhodium's violent price behavior.