NASDAQ Hits Major Supply Zone: Is This the Best Time to Sell NAS?
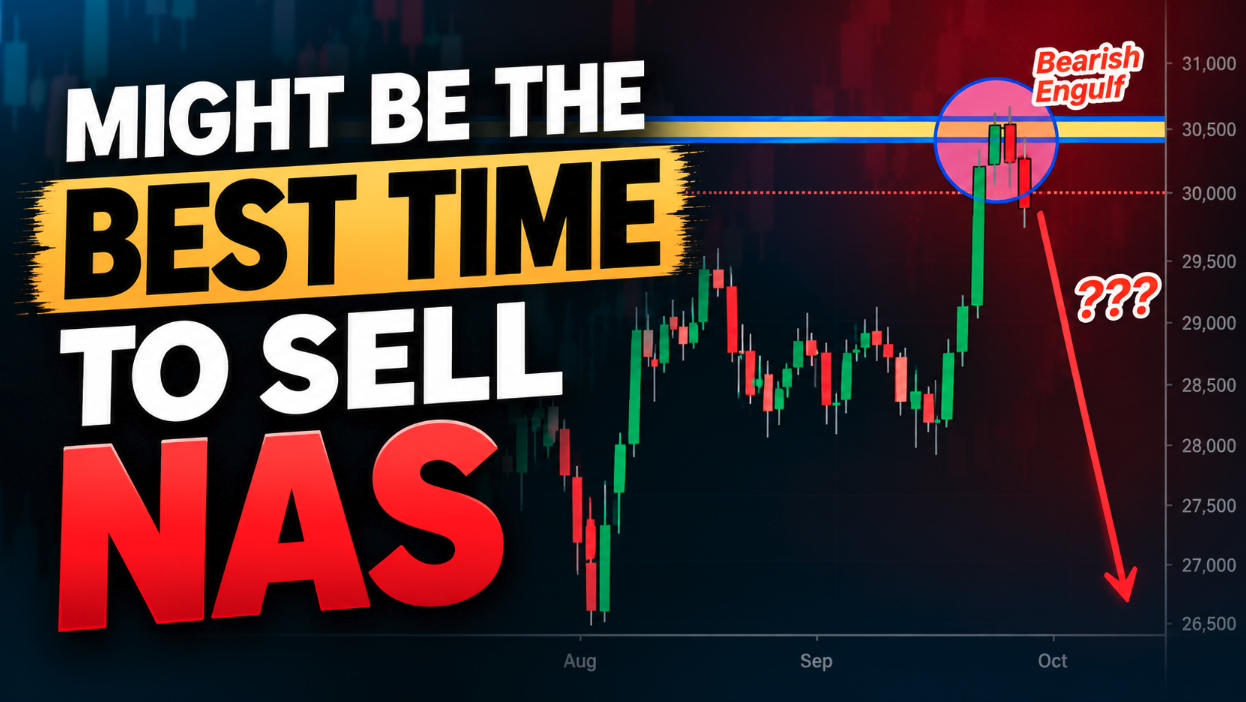
NASDAQ has just reached an area I’ve been watching closely.
And technically, this is where things start to get interesting.
Price has pushed aggressively higher and has now reached a major supply zone around the 30,400–30,750 area.
But reaching a supply zone is not, by itself, a reason for me to sell.
I want to see what price does next.

NAS Has Reached a Major Supply Zone
The chart below shows the area I’m currently watching.
Price has made a very strong move into the zone, but we are already starting to see signs that sellers may be responding.
The important word here is may.
I don’t want to predict the market simply because price has reached resistance.
Instead, I want the market to give me evidence.
And ideally, I would like to see NAS come back towards approximately 30,400.
That would put price back into the area where I can start looking for a potential short opportunity.
What Would Make Me Consider Selling NAS?
If NAS revisits the 30,400 area, I’ll be watching the 4-hour chart very closely.
There are two things in particular I would like to see.
Either a clear rejection candle showing that buyers have attempted to push through the area and failed, or some form of bearish confirmation candle suggesting that sellers are beginning to take control.
I don’t want to sell simply because NAS is “high.”
And I certainly don’t want to assume that the market has to reverse from here.
The zone gives me a location.
Price action gives me the reason to trade it.
That distinction is important.
30,100 Could Be the Key
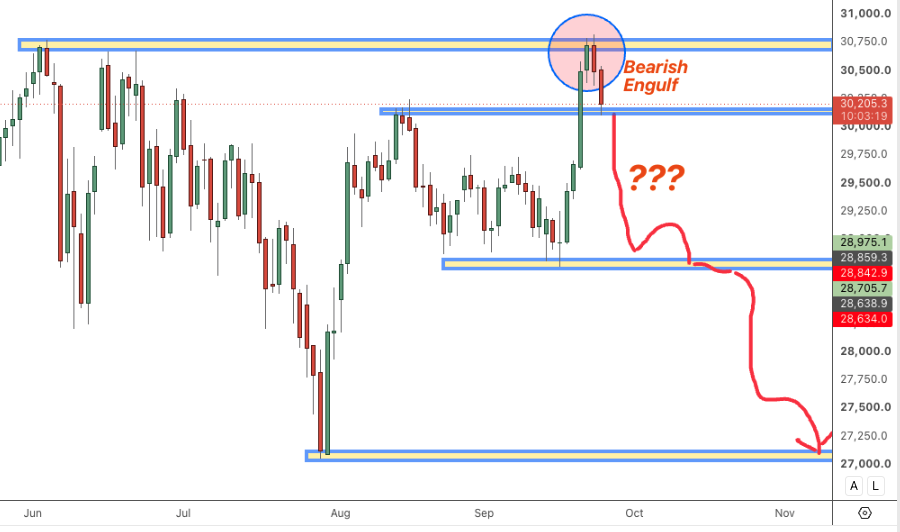
If bearish confirmation appears around the supply zone, my attention would then move towards approximately 30,100.
For me, this is an important area because the reaction there could tell us considerably more about whether this is simply a temporary pullback or the beginning of a larger move lower.
If NAS falls towards 30,100 but buyers step back in aggressively, the bearish scenario becomes much less interesting.
However, if price can break decisively below 30,100, then things could become much more interesting from an asymmetric trading perspective.
At that point, there may be considerably more room below.
Where Could NAS Go Next?
The next major demand zone I’m watching is around 28,750.
That would be the first significant downside area on my radar if 30,100 gives way.
And if sellers remain in control and 28,750 eventually fails as well, the larger move could potentially extend towards the 27,000 area.
So the scenario I’m watching is roughly:
30,400 supply → bearish 4H confirmation → reaction around 30,100 → potential 28,750 → potentially 27,000.
But this is not a prediction that NAS will travel from 30,400 straight down to 27,000.
Each level has to earn the next one.
This Is Where Asymmetric Trading Gets Interesting
This is also exactly the type of situation I like from an asymmetric trading perspective.
I’m not interested in predicting the entire move before it happens.
I’m interested in identifying an area where I can potentially take a relatively small, predefined risk while leaving myself exposed to a much larger move if the market agrees with the idea.
That’s a very different way of thinking about trading.
The question isn’t:
“Can I predict whether NAS will fall to 27,000?”
I can’t know that.
The better question is:
“Can I find a high-quality location where my downside is controlled, but the potential upside of being right is disproportionately large?”
If NAS gives me the right bearish confirmation around this supply zone, that asymmetry could become very interesting.
What Would Invalidate the Idea?
This part is equally important.
If NAS pushes back into the supply zone and buyers simply continue through it, then I have no interest in forcing the short.
A zone is not a guarantee.
And a bearish idea isn’t something I need the market to prove right.
If the price action doesn’t confirm it, I simply don’t have the trade I was looking for.
That’s why I’ll be watching the 30,400 area and the 4H candles first, rather than trying to front-run a reversal.
Final Thoughts
NASDAQ is sitting at one of the more interesting technical areas I’ve seen recently.
The major supply zone has been reached.
Now I want to see whether NAS can revisit approximately 30,400 and produce a meaningful bearish reaction on the 4H chart.
If that happens, 30,100 becomes the next important test.
A convincing break below there could open the door towards the major demand area around 28,750.
And if the bearish momentum becomes significantly larger, 27,000 would be the next major area I would have on my radar.
But none of those targets matter until the market confirms the first part of the idea.
Location first. Confirmation second. Asymmetry third.
That’s the sequence I’ll be watching.
This analysis is for educational purposes only and does not constitute financial advice.
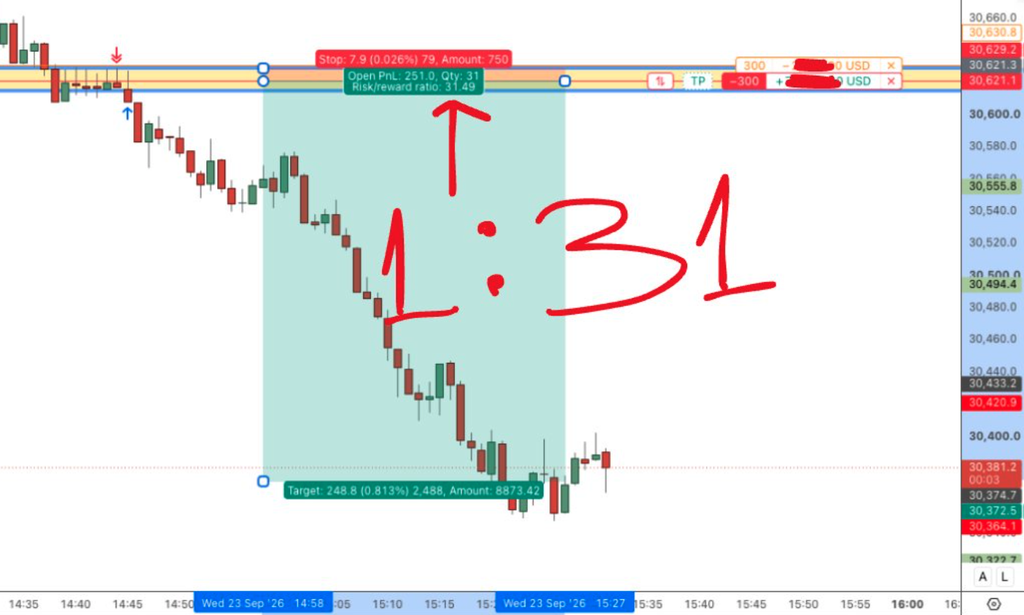
P.S. Here is the 1:31 risk:reward ratio trade we’ve closed in the Asymmetric Day Trading Room yesterday:
If you want to learn more about Asymmetric Trading, you can check if we can work together below: