


3 Black Crows Meaning A Trader’s Guide to Spotting It
When you see three black crows on a chart, it's a powerful signal that the bears are taking over. This pattern is made up of three long, consecutive red candles that march progressively lower, showing a clear shift in control from the buyers to the sellers.
What the Three Black Crows Pattern Really Means

Picture a market that's been enjoying a nice, steady climb. The bulls are in charge. Then, out of nowhere, you get three straight days of selling. That's the story the Three Black Crows tells. It’s not just a small pullback; it's a sustained, three-session assault by the bears that suggests the uptrend has run out of steam.
This is a classic bearish reversal signal. By spotting these three long red (or black) candles closing lower each day, traders get a massive hint that the market dynamics are changing.
To help you get a quick handle on this pattern, here’s a simple breakdown of what it signifies.
Three Black Crows At a Glance
| Characteristic | Description |
|---|---|
| Pattern Type | Bearish Reversal |
| Prior Trend | Must appear after an established uptrend. |
| Candle Count | Three consecutive, long-bodied bearish (red) candles. |
| Market Psychology | Shows a decisive shift from buying pressure to strong, sustained selling pressure. |
| Reliability | Considered a strong and reliable reversal signal. |
This table sums it up nicely, but the real power comes from understanding the story behind the candles.
The Power of Three Candles
So, why three candles? Think about it. One red candle after a strong run-up could just be traders taking a little profit off the table. No big deal.
A second red candle starts to raise some eyebrows. Maybe something is changing.
But by the third consecutive down day, the message is loud and clear: the bears are in control now. This progression shows a complete breakdown of buying pressure. Each "crow" adds more weight to the bearish story, making it a much stronger signal than a single candlestick could ever be.
Core Characteristics to Look For
Spotting this pattern is one thing, but knowing what it means for your trading is another. It’s a visual cue that the market’s mood has turned sour.
- Sustained Selling Pressure: Three full sessions of sellers dominating the action is a big deal.
- Shift in Momentum: It’s a clear visual that power has moved from the bulls to the bears.
- Potential Trend Reversal: This is a strong warning that the prior uptrend is likely over and a downtrend could be starting.
This pattern is a cornerstone of price action analysis. If you want to dig even deeper into how it works, check out our full guide on the three black crows candlestick.
The Psychology Behind a Market Downturn

Candlestick patterns do more than mark price swings. They capture the ebb and flow of trader sentiment in real time. The Three Black Crows setup unfolds like a short, sharp tragedy—bullish hope fades, bears seize control, and what was once a confident uptrend unravels.
To grasp the 3 black crows meaning, picture this: markets cruising upward, dips snapped up by eager buyers. Then, without warning, the first ominous crow lands.
Day One: The Initial Crack In Confidence
On the first day, a long bearish candle slams the close well below the open.
This single bar:
- Marks the first real push from sellers
- Shakes the bulls’ belief that “dips are buying opportunities”
- Plants the seed of doubt in cautious traders
Some optimists chalk it up to profit-taking. Others, however, start wondering if the tide is turning.
Day Two: Doubt Spreads Like Wildfire
When the second crow arrives, it opens inside the previous body and closes even lower. Now the idea that the prior drop was a one-off looks naïve.
As losses mount, a domino effect kicks in:
- Bulls rush to exit, cutting losses
- Early buyers lock in gains before they vanish
- Panic selling accelerates the decline
“This progressive erosion of buyer confidence is the core of the pattern’s power. Each crow builds on the last, creating a cascade of selling pressure that becomes harder and harder for the bulls to overcome.”
Every extra sell order fans the flames, and what began as hesitation turns into outright fear.
Day Three: The Bearish Takeover Is Complete
By the third session, the bears have stamped their authority. Another strong red candle confirms the switch from bullish control to firm bearish momentum. Any lingering hopes of a swift rebound are gone.
This three-day sequence neatly illustrates how traders collectively capitulate—the uptrend not only stalls but reverses into a downtrend. The Three Black Crows pattern, therefore, stands out as a vivid chart signal of psychological surrender.
For a deeper dive into market sentiment, explore our resources on the psychology of trading.
How To Identify The Three Black Crows Pattern With Confidence
Spotting three bearish candles after an uptrend might feel simple, but not every trio of red bars is a genuine Three Black Crows pattern. Misreading this signal can cost you real money.
To grasp the 3 black crows meaning, look beyond color. You need context, structure, and clear momentum. Only when all these pieces align does the signal earn your trust.
The Anatomy Of A Valid Pattern
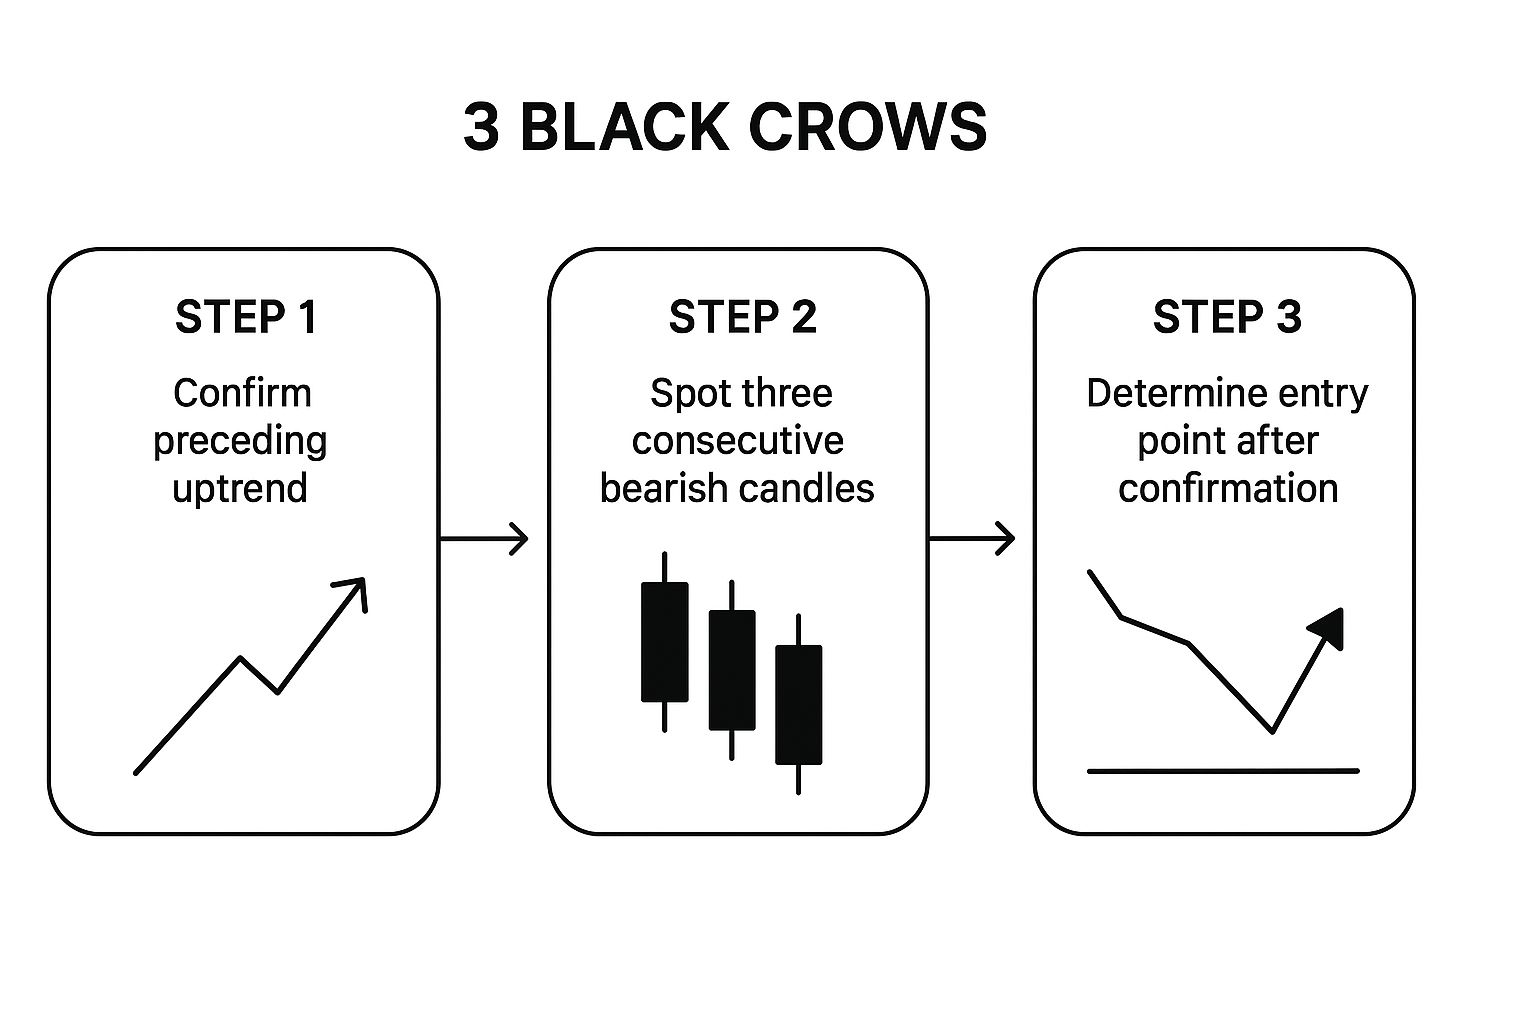
Before you commit to a trade, run through these three non-negotiable checks:
-
An Established Uptrend Must Precede It:
The Three Black Crows only shines when it follows a solid upward move. If you see it in a downtrend or a choppy market, you’re likely chasing noise, not a true reversal. -
Three Consecutive Long Bearish Candles:
Each candle needs a sizeable body, showing sellers dominated the entire session. Tiny bodies—like dojis or spinning tops—simply hint at indecision, not a shift in control. -
Specific Candle Structure:
Look for each candle to open within the previous body and close near its low, carving a clear “stair-step” decline. For a deeper dive into candlestick anatomy, check out Quantified Strategies.
This straightforward checklist helps you filter out weak setups and zero in on the strongest signals.
Visually confirming the uptrend first, then the candle structure, makes your analysis far more reliable.
Look For Minimal Wicks
An ideal Three Black Crows pattern comes with very short—or no—wicks on each candle.
A long lower wick on any of the three candles is a major red flag. It suggests that buyers stepped in before the session closed, fighting back against the sellers and weakening the bearish signal.
Short wicks mean sellers held control from open to close. By verifying these details, you’ll move from simply spotting three red bars to identifying a high-probability reversal signal.
Trading Strategies Using the Three Black Crows Signal
Spotting the Three Black Crows is a great start, but turning that pattern into a real trade? That requires a plan. Think of the pattern as a flashing yellow light—it’s telling you to pay attention, but you shouldn't just barrel through the intersection.
The most straightforward way to trade this is to short the market, but only after the pattern is complete. That means you have to wait for the third crow to officially close. I’ve seen too many traders jump the gun while that third candle is still forming, only to get burned when buyers rush back in at the last minute and push the price up. Patience is key here.
Once you have that confirmation, it’s all about managing your risk.
Entry Points and Stop-Loss Placement
A good trade isn’t just about being right; it's about having a clear plan for when you’re wrong. Solid risk management is the foundation of everything we do as traders.
Here’s a practical way to structure the trade:
- Entry Trigger: Wait for the price to drop just below the low of that third candle. This is your final confirmation that the sellers are still in control before you put any money on the line.
- Stop-Loss Placement: Place your stop-loss just a tick above the high of the first crow. Why there? Because that high represents the peak just before the bears took over. If the price manages to climb all the way back up and break that level, the entire bearish setup is busted.
This approach gives you a very clear risk-to-reward picture right from the start. You know exactly what’s at stake, which is absolutely essential if you want to stay in this game long-term.
The Power of Confirmation
The Three Black Crows pattern tells a story, but it’s a much more believable story when it has other evidence to back it up. Think of the pattern as an accusation in a courtroom; you need other witnesses to corroborate the story before you can reach a verdict.
Relying on the candles alone is a recipe for getting caught in a "false positive"—what looks like a reversal might just be a temporary dip before the uptrend continues.
The best trading setups I’ve ever taken are the ones where multiple, different signals all line up and point in the same direction. When the Three Black Crows appear and an oscillator is screaming "overbought," that’s when a simple pattern transforms into a high-conviction trade.
Here are a few things to look for to stack the odds in your favor:
- Relative Strength Index (RSI): Take a look at your RSI. Is it falling from overbought territory (above 70)? If so, it means the bulls were running out of steam right before the crows showed up. That’s a massive plus for the bearish case.
- Volume Analysis: Did the trading volume get heavier with each of the three bearish candles? Seeing volume pick up on down days shows real conviction from the sellers. If the volume is weak, it might mean the reversal doesn't have enough muscle behind it.
- Moving Average Crossovers: Has a faster moving average just crossed below a slower one? A bearish crossover like this can be the perfect confirmation that the bigger-picture trend is starting to roll over.
- Breaking a Key Support Level: This one is huge. If that third crow smashes through and closes below a major support level, like a previous swing low, it's not just a pattern anymore. It's a structural break in the market, giving you a powerful reason to believe the bears are in charge.
By waiting for just one or two of these extra signals to align, you can filter out the weak setups and focus your capital only on the A+ opportunities.
Common Mistakes Traders Make with This Pattern
The Three Black Crows pattern looks like a powerful bearish signal, and it can be. But far too many traders jump the gun and fall into common traps that turn a great-looking setup into a frustrating loss. Knowing what not to do is just as important as memorizing the pattern's rules.
One of the biggest mistakes I see is trading the pattern in a vacuum. A trader spots three angry red candles, their heart starts pounding, and they slam the sell button without a second thought for the bigger picture. That's a recipe for disaster.
Think about it: a strong bearish reversal appearing after a weak, sputtering uptrend carries a lot more weight than one that pops up in the middle of a runaway bull market. In the second case, it might just be a brief pause before the next leg up. Context is everything.
Ignoring Candle Size and Shape
Another classic error is getting the candle size wrong. Yes, the pattern needs long, bearish bodies to be valid, but there's such a thing as too long.
If the crows are massive, overextended candles stretching way down the chart, it can actually mean the bearish move is already running on fumes. The market might be seriously oversold and ready for a sharp rebound, catching aggressive short-sellers completely off guard.
This is especially dangerous if the candles have blown past a key support level or moving average. That often signals panic selling, and panic can reverse just as fast as it started.
Acting Before Confirmation
Patience is a superpower in trading, but it's one a lot of people lack. A trader might see two big red candles forming and just assume the third is a sure thing. So, they enter a short position before that final candle has even closed.
This is a rookie move. What if buyers rush in during the last few minutes of the session? That third "crow" could end up with a long lower wick, completely changing the story and killing the bearish signal. You have to wait for the third candle to officially close. Always.
Avoiding these common slip-ups can make a huge difference in your trading. Most of these mistakes come from impatience and psychological pressure, but just being aware of them is the first step toward building better discipline. In fact, learning how trading mistakes can fuel your investment journey is a key part of growing as a trader.
A Real World Example of the Three Black Crows in Action

Rules on paper are one thing, but seeing the Three Black Crows pattern play out on a live chart is where the real learning happens. It’s how you get a feel for the market's rhythm. Let's break down a real historical example to see how the pieces—the setup, the pattern, and the confirmation—all came together.
The scene was set with a major stock index in a strong, established uptrend. Bulls were clearly in charge, pushing prices to new highs, and the mood was optimistic. This prior trend is crucial; it's the opening act that gives the reversal pattern its meaning.
Then, the first crow landed. It was a big, beefy bearish candle that closed way below its open. This was the first real sign of force from the sellers. The second crow followed suit, opening inside the first candle's body before driving the price down even further. The third and final crow sealed the deal, completing the sequence and confirming the sellers' dominance.
Putting the Signal in Context
Just seeing the three red candles was a big hint, but the real power of this signal came from the other clues on the chart. Here’s what made this particular pattern a high-conviction setup:
- RSI Was Flashing Red: Right before the crows showed up, the Relative Strength Index (RSI) was screaming "overbought" (trading above 70). This told us the uptrend was running on fumes. As the crows formed, the RSI took a nosedive, confirming the momentum was flipping from bullish to bearish.
- Volume Confirmed the Move: Watch the volume bars. You’ll notice that trading volume jumped up during the second and third crows. This wasn’t a weak drift downward; it was a powerful push backed by serious money. That extra volume gave the signal a ton of credibility.
This is the perfect illustration of the 3 black crows meaning in the wild. It wasn't just a random dip. It was a confirmed, high-conviction reversal signal that nailed the top of the uptrend and kicked off a major move down.
By looking at the whole picture—the tired uptrend, the textbook candle formation, and the confirmation from both RSI and volume—a trader could spot this as a prime opportunity to get ahead of a bearish reversal.
Frequently Asked Questions
Even after you've got a handle on a pattern, a few lingering questions are normal. It’s one thing to understand a concept and another to feel confident enough to act on it when real money is on the line.
Let's clear up some of the most common questions traders have about the Three Black Crows.
Is the Three Black Crows Pattern Always Bearish?
Yes, the 3 black crows meaning is always bearish. Think of it as a big, flashing red light on your charts. It's a classic reversal pattern warning that an uptrend might be over and sellers are storming the gates.
You would never interpret this as a bullish signal.
That said, context is everything in trading. A pattern's reliability can change depending on the bigger market picture, so always get a second opinion from another tool before you jump into a trade.
The Three Black Crows pattern is widely respected as a reliable bearish signal. I've found it's most powerful on higher timeframes, like the daily or weekly charts, where the market noise is filtered out and the signal is much cleaner.
What Is the Opposite of This Pattern?
The polar opposite of the Three Black Crows is another classic pattern: the Three White Soldiers.
- Three Black Crows: This pattern screams "potential top!" It's a warning that a new downtrend could be starting.
- Three White Soldiers: This one signals a potential bottom. It suggests buyers have wrestled back control and a new uptrend is beginning.
Both patterns are built from three strong, consecutive candles and show a decisive, multi-day shift in who's in control of the market.
Can This Pattern Give False Signals?
Absolutely. No pattern in trading works 100% of the time, and the Three Black Crows is no exception. It can definitely throw you a false signal.
A classic trap is seeing this pattern form in the middle of a monster uptrend. More often than not, it ends up being just a temporary breather—a pullback—before the buyers rush back in and push prices even higher.
To sidestep these fake-outs, you need confirmation. Before you even think about entering a trade, look for other clues like a spike in selling volume or a bearish divergence on an indicator like the Relative Strength Index (RSI).
Ready to stop relying on confusing indicators and start reading the market's story directly from the charts? At Colibri Trader, we teach a straightforward, price-action-based approach to help you trade with confidence. Learn the strategies that allow you to profit in any market condition. Start your journey to consistent trading at Colibri Trader.