


What Is Profit Factor In Trading? A Trader’s Guide
In the trading world, the profit factor is one of the purest, most honest scorecards for your strategy. It cuts through the noise and tells you exactly how much money your winners are making for every dollar your losers are costing you.
It's a straightforward look at your true profitability, moving beyond the simple—and often misleading—metric of just counting wins and losses.

Decoding Your Trading Performance
So many traders get fixated on their win rate. They chase that high percentage, thinking that winning more often is the golden ticket. I’ve seen it time and time again, and it’s a costly mistake.
A high win rate is completely hollow if a few catastrophic losses can wipe out dozens of your hard-earned gains. This is precisely where the profit factor becomes a game-changer for your analysis.
Think of it like this: your trading operation is a small business. Your winning trades are your revenue (gross profit), and your losing trades are your expenses (gross loss). A business isn't healthy just because it makes a lot of sales; it's healthy when the money coming in is significantly more than the money going out. The profit factor gives you that exact P/L statement for your trading.
The Core Formula
At its heart, the calculation is refreshingly simple. To get your profit factor, you just divide your total profits by your total losses.
Profit Factor = Gross Profit / Gross Loss
So, if your winning trades brought in $10,000 and your losing trades cost you $5,000, your profit factor is 2.0.
What does that 2.0 mean? It means for every $1 you risked and lost, your strategy generated $2 in profit. Simple as that. You can dig deeper into this core trading metric with the folks over at BabyPips.com.
To make it even clearer, here’s a quick breakdown:
Profit Factor At A Glance
| Metric | What It Measures | Example |
|---|---|---|
| Gross Profit | The total sum of money from all winning trades. | A trader makes three winning trades for +$200, +$300, and +$500. Gross profit is $1,000. |
| Gross Loss | The total sum of money from all losing trades. | The same trader has two losing trades for -$150 and -$250. Gross loss is $400. |
| Profit Factor | The ratio of Gross Profit to Gross Loss. | Using the numbers above, the calculation is $1,000 / $400, resulting in a profit factor of 2.5. |
This single number gives you a much richer story about your strategy's health than win rate ever could.
A profit factor greater than 1.0 technically means you're profitable. But in the real world, a truly robust strategy usually needs a score of 1.75 or higher to create a real edge.
Why the buffer? That extra cushion is critical for absorbing the unavoidable costs of trading that eat into your bottom line, like commissions and slippage.
Profit factor forces you to look at the magnitude of your wins and losses, not just how often they happen. While it’s a reflection of past performance, it’s a vital tool for assessing your risk and the future viability of your approach. It works hand-in-hand with other key metrics, which you can learn more about in our guide on what is maximum drawdown.
Calculating Your Profit Factor Step by Step
Okay, so the theory makes sense. But the real magic happens when you calculate your own profit factor. That’s where you start getting real insights into your trading.
The good news? You don't need any fancy software. The process is surprisingly simple—all you need is your trading history and a basic calculator. It really just boils down to a three-step process that gives you a crystal-clear snapshot of your performance.
This infographic breaks down that simple, three-step journey.
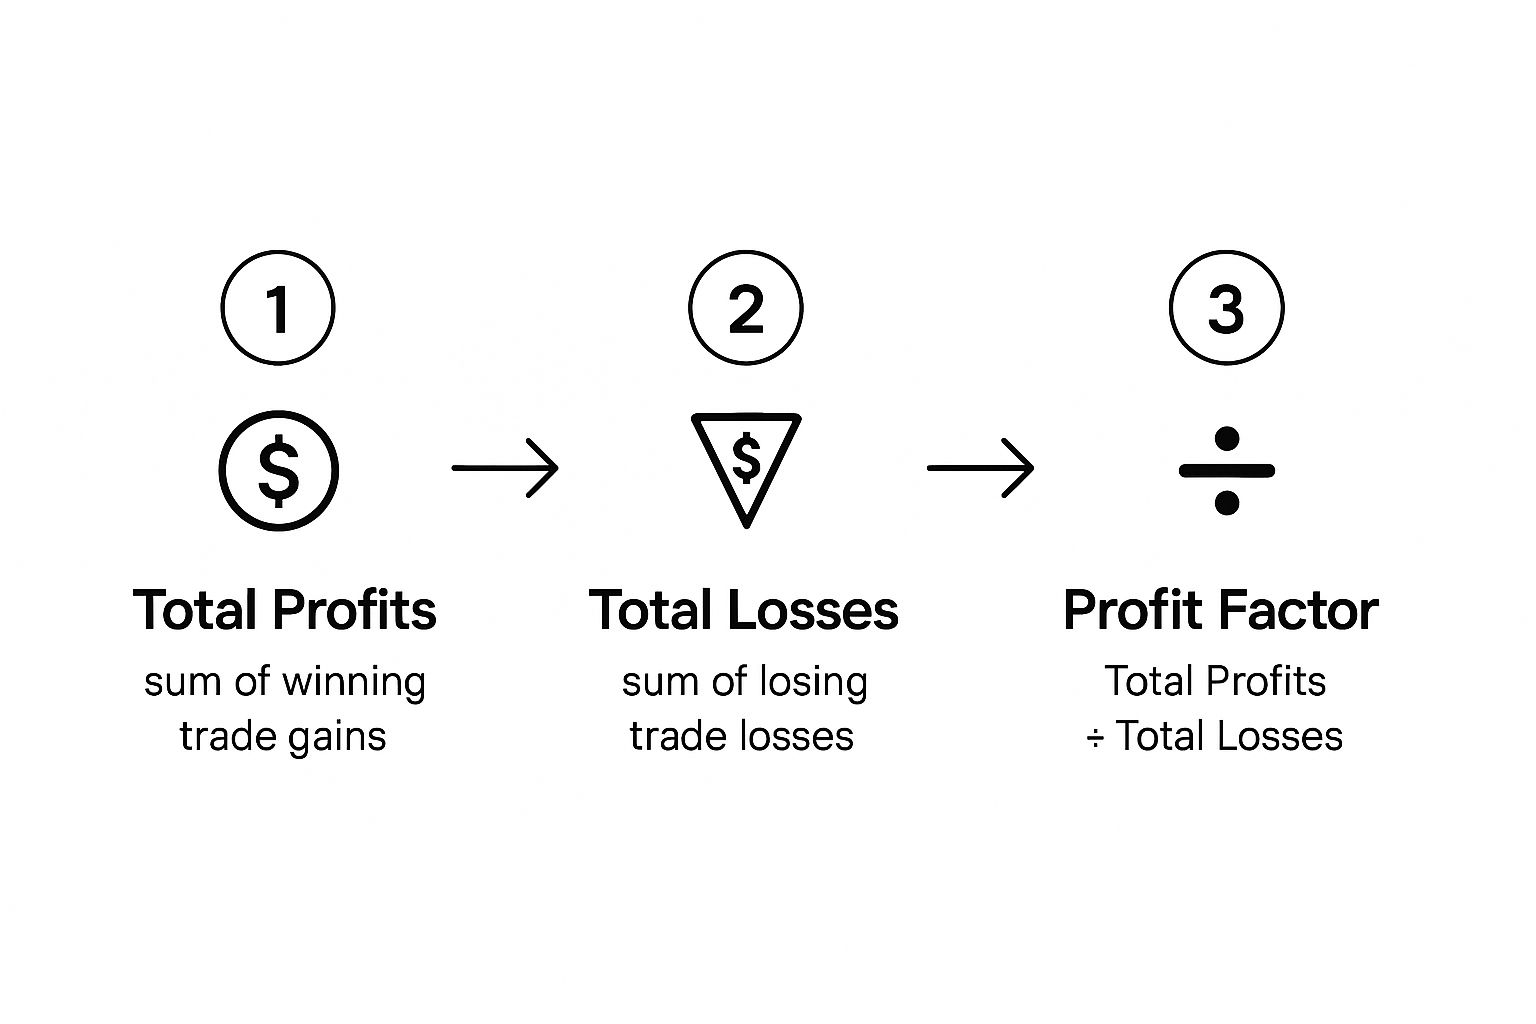
As you can see, it’s a direct line from adding up your wins and losses to understanding the powerful relationship between them.
A Practical Walkthrough
Let’s run the numbers with a hypothetical trading log. Imagine you’ve just closed out ten trades, and the results look like this:
- Winning Trades: +$300, +$550, +$220, +$400, +$280
- Losing Trades: -$150, -$200, -$100, -$250, -$120
Now, we can walk through the three steps to figure out our trading profit factor.
Step 1: Calculate Your Gross Profit
First thing's first, add up all the money you made from your winning trades. This is your total gross profit.
$300 + $550 + $220 + $400 + $280 = $1,750 (Gross Profit)
Step 2: Calculate Your Gross Loss
Next, do the same for your losing trades. Just add up all the losses. For this part of the calculation, treat them as positive numbers—we just need the total amount of money lost.
$150 + $200 + $100 + $250 + $120 = $820 (Gross Loss)
Step 3: Divide Gross Profit by Gross Loss
Finally, the moment of truth. Divide your gross profit by your gross loss. The result is your profit factor.
$1,750 / $820 = 2.13
A profit factor of 2.13 is a really strong result. It tells you that for every $1 this strategy lost, it made $2.13 in profit. That’s the sign of a healthy, robust system.
Most traders I know aim for a profit factor of at least 2.0 to give themselves a solid cushion. Looking back at historical data, a score between 1.75 and 4.0 often hits that sweet spot between profitability and risk. For more on benchmarks, the experts at BabyPips.com have some great insights.
This simple calculation is a cornerstone of performance analysis, which is why it's so important to learn how to backtest a trading strategy the right way.
What Your Profit Factor Score Really Means
Once you've calculated your profit factor, you're left with a single, powerful number. But what story is that number actually telling you about your trading strategy? This is where the real work begins—turning that data point into something you can actually use.
Think of it like a quick health check for your trading. A score below 1.0 is an immediate red flag—it means your strategy is losing money. Period. If you land exactly on 1.0, you're at break-even before commissions and slippage. In the real world, that’s also a losing strategy.
But just knowing you're above 1.0 isn't enough. The real insights come from digging into the nuances.
Benchmarking Your Performance
Most traders quickly discover that a score barely inching above 1.0 won't cut it for a sustainable career. A profit factor of 1.25, for instance, means for every $1 you lose, you’re only making $1.25. That thin margin can get wiped out in a hurry by trading costs or a short losing streak.
To build a strategy that can actually weather the markets, most pros are aiming much higher. This is where meticulous record-keeping becomes non-negotiable. A detailed trading journal in Excel is one of the best ways to track your performance with the accuracy you need.
To give you a better feel for what the numbers mean, here’s a quick guide to help you interpret your score.
Profit Factor Interpretation Guide
| Profit Factor Value | Strategy Health | Actionable Insight |
|---|---|---|
| Below 1.5 | The Danger Zone | Likely unprofitable after costs. This strategy needs a major overhaul or should be abandoned entirely. |
| 1.5 to 1.75 | The Proving Ground | Shows some potential but lacks a strong edge. It might be profitable but is very vulnerable to market shifts. |
| 1.75 to 3.0 | The Healthy Range | Considered robust and healthy. This indicates a solid edge that can withstand drawdowns and trading costs. |
| Above 4.0 | The Cautionary Tale | This can be a warning sign. It often means the strategy was over-optimized on past data and may fail in live markets. |
These ranges help put your performance into context. You can see there's a sweet spot.
A profit factor in the 1.75 to 3.0 range generally signals a well-balanced system. It's consistently profitable without being so perfect that it raises suspicions of being unrealistic for future performance.
Why Profit Factor Beats Win Rate Every Time
It's a classic rookie mistake. New traders get obsessed with their win rate, thinking that winning a high percentage of trades is the holy grail. But chasing a high win rate, while it feels great for the ego, tells a dangerously incomplete story about your strategy.
In reality, it's one of the most common and costly errors you can make.
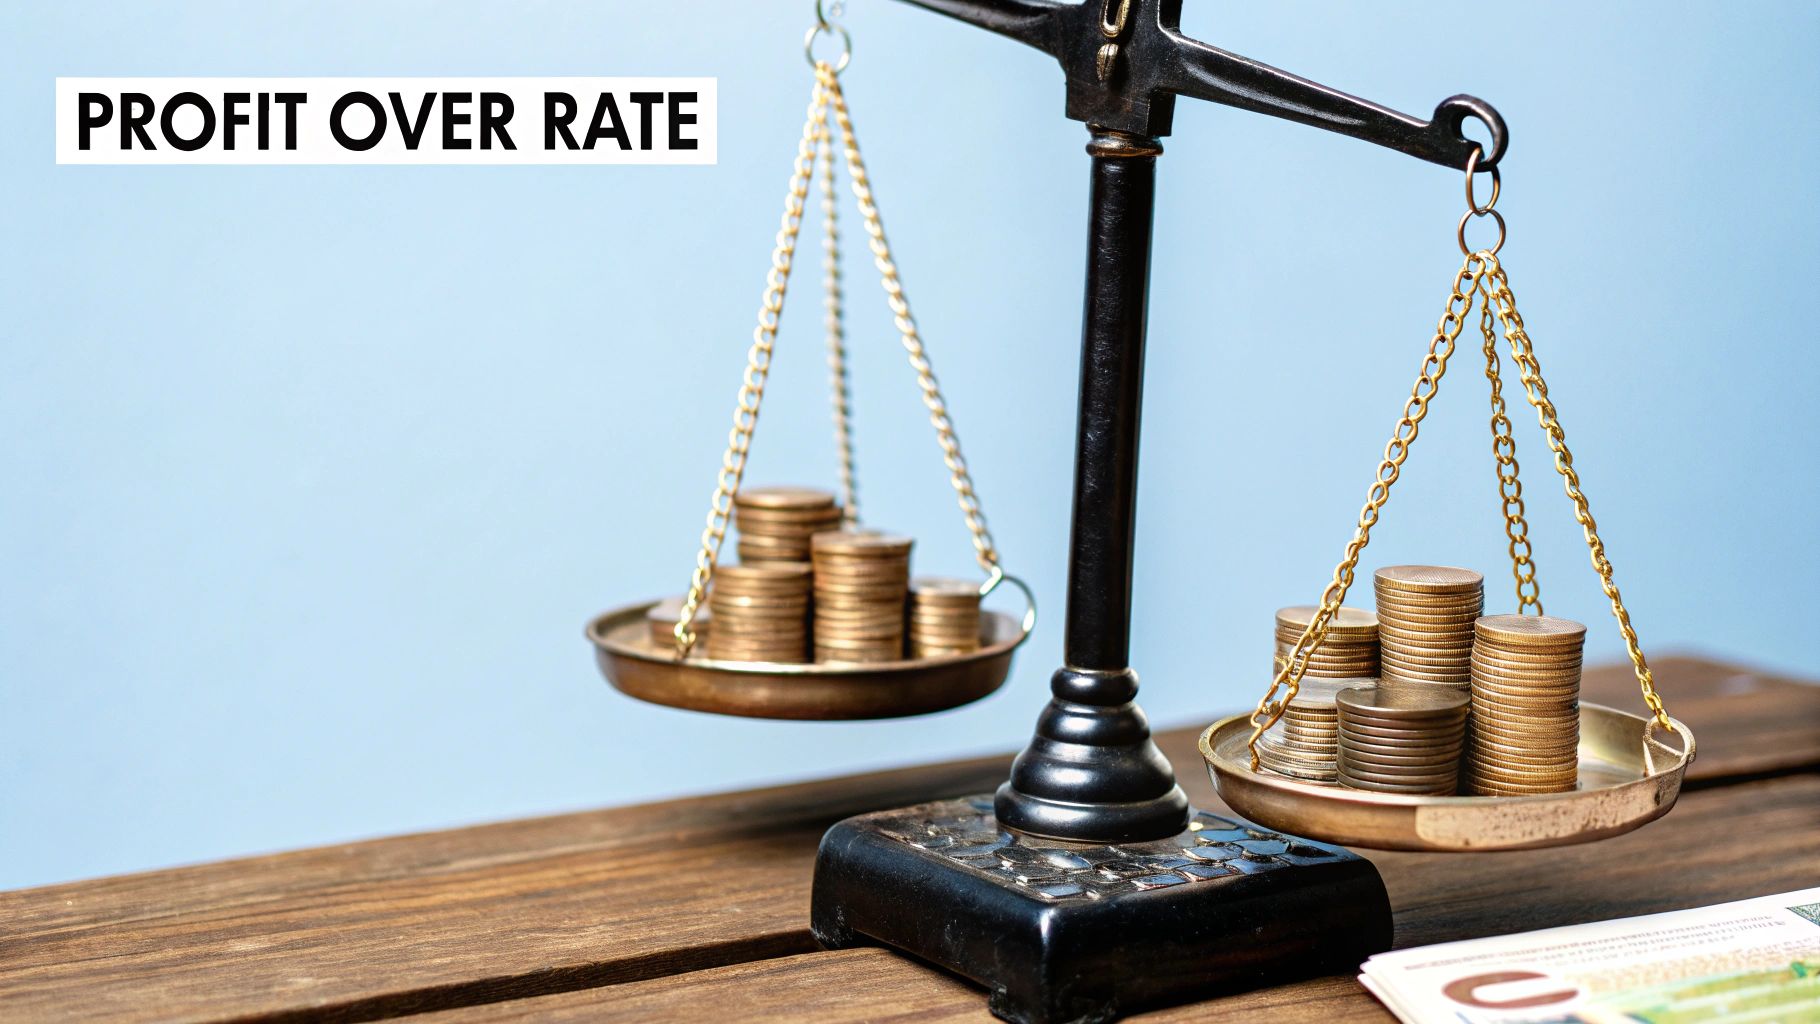
The profit factor, on the other hand, gives you a much more honest picture. Why? Because it weighs the size of your wins against the size of your losses, not just how often they happen. It answers the single most important question in trading: are you making more money than you're losing?
Let's look at a tale of two traders to really drive this home.
A Tale of Two Traders
Trader A: The High-Frequency Winner
Meet Trader A. She has a beautiful 80% win rate. Out of ten trades, she wins eight. On the surface, she looks like a trading superstar.
But here’s the catch. Her strategy is all about scalping small, quick profits. Her average winning trade nets her just $50. Meanwhile, she has a bad habit of letting losers run, hoping they’ll turn around. Her average losing trade is a painful -$400.
Let's do the math on ten trades:
- Total Profits: 8 wins x $50 = $400
- Total Losses: 2 losses x $400 = $800
- Profit Factor: $400 / $800 = 0.50
Despite winning most of the time, Trader A is bleeding money. Her impressive win rate is just a vanity metric hiding a fundamentally broken strategy. While a win rate is a percentage, its value can be misleading without more context. For a good refresher on the basics, check out this guide on understanding percentages.
A profit factor below 1.0 means your strategy is a losing one. Trader A’s 0.50 score shows that for every dollar she loses, she only makes back 50 cents. It's not sustainable.
Trader B: The Patient Performer
Now, let's look at Trader B. His win rate is only 40%. He loses more often than he wins, which can be tough on the psyche.
But Trader B's entire philosophy is different. He cuts his losses short and lets his winners run, aiming to capture major moves. His average loss is a manageable -$100, while his average win is a powerful $450.
Here's how his ten trades stack up:
- Total Profits: 4 wins x $450 = $1,800
- Total Losses: 6 losses x $100 = $600
- Profit Factor: $1,800 / $600 = 3.0
Trader B, with his "low" win rate, is absolutely crushing it. His massive profit factor of 3.0 reveals the true health and power of his approach.
This comparison makes it crystal clear why focusing on profit factor is essential. Studies of real trading accounts consistently show that profitable traders maintain profit factors between 1.2 and 2.5. It's the metric that rewards solid risk management and separates the gamblers from the pros.
Common Mistakes When Using The Profit Factor
The profit factor is a fantastic tool, but like any metric, it's only as good as the trader using it. It's easy to fall into a few common traps that can give you a false sense of security, leading straight to poor decisions and costly errors.
Knowing these pitfalls is the first step to using the metric wisely and avoiding a blown-up account.
One of the biggest mistakes I see is calculating a profit factor based on a handful of trades. A few lucky wins can create an incredibly high score, but it’s statistically meaningless. You really need a large enough sample size—think 50 trades or more—to get a reliable picture of a strategy's true potential.
Another major oversight is ignoring the hidden costs that quietly eat into your bottom line.
A profitable strategy on paper can easily become a losing one in the real world once you account for commissions, platform fees, and slippage—the difference between your expected fill price and the actual price.
These costs directly chip away at your gross profits and inflate your gross losses. For a strategy with a borderline profit factor, they can be the kiss of death.
Over-Optimizing And Curve Fitting
Perhaps the most dangerous trap of all is curve-fitting. This is what happens when you tweak a strategy’s parameters so much that it perfectly matches historical data. The result? A phenomenal back-tested profit factor that looks amazing but is completely useless for future trading.
The strategy hasn't found a real market edge; it's just been "fit" to past noise.
This is a common issue for traders using automated systems. A profit factor below 1.75 often signals that a strategy needs work, but trying to artificially inflate it through over-optimization is a recipe for disaster. This metric is a global standard for a reason—it helps traders build solid systems that work across different markets.
To effectively navigate the complexities of trading and sidestep these common pitfalls, it's crucial to cultivate strong critical thinking skills.
Ultimately, your goal isn't to create a perfect backtest. It's to find a robust strategy with a healthy profit factor that actually holds up in live market conditions, not just in a spreadsheet.
Frequently Asked Questions About Profit Factor
Jumping into a new trading metric always brings up a few questions. To help you start using the profit factor with confidence, I've put together some clear answers to the most common things traders ask. This should help you apply it correctly and see where it fits in your analysis.
What Is a Good Profit Factor in Trading?
Technically, anything over 1.0 means you're profitable. But in the real world, that's cutting it way too close. Most professional traders I know are looking for a profit factor of at least 1.75.
Here’s a simple breakdown:
- Healthy Range (1.75 – 4.0): This is the sweet spot. It tells you that your strategy has a real edge and can handle the costs of trading like commissions and slippage.
- Danger Zone (Below 1.5): A number this low is a major red flag. It shows a very weak edge that is likely a money-loser once you factor in real-world trading costs.
- A Word of Caution (Above 4.0): An extremely high profit factor can be too good to be true. It often means the strategy was over-optimized on past data and probably won't hold up in a live market.
How Is Profit Factor Different From the Risk-Reward Ratio?
It’s easy to mix these two up, but they measure completely different things.
Think of the risk-reward ratio as a plan. It's something you figure out before you even place a trade. You're comparing what you could make to what you could lose (for example, aiming for a 2:1 reward for every unit of risk you take).
The profit factor, on the other hand, is a report card. It's calculated after a whole series of trades are done. It tells you what your actual gross profits were compared to your actual gross losses. It’s a historical review of your entire strategy's performance, not just a single trade idea.
In short, risk-reward is about potential, while the profit factor is about proven performance.
Does Profit Factor Work For All Types Of Trading?
Yes, absolutely. The beauty of the profit factor is its simplicity—it just looks at the raw relationship between total profits and total losses. That fundamental concept works no matter what market or style you trade.
It doesn't matter if you're into:
- Day Trading
- Swing Trading
- Long-Term Investing
- Forex, Stocks, or Crypto
It gives you a standard benchmark to measure real profitability, whatever your approach may be.
How Many Trades Do I Need To Calculate A Reliable Profit Factor?
You need a decent sample size for the number to mean anything. Calculating it after just a handful of trades is useless—a couple of lucky wins will give you a wildly inflated score that isn't realistic.
Most analysts agree you need a minimum of 30 to 50 trades to get a result that truly reflects your strategy's potential. For context, top-performing quant funds and algorithmic traders often show profit factors above 2.5, which proves how well their gains are covering their losses over time. You can learn more about how top traders analyze performance at TraderSync.
Ready to build a trading strategy with a healthy profit factor? At Colibri Trader, we teach a straightforward, price-action approach that helps you achieve consistent results without relying on complicated indicators. Discover your trading potential today. https://www.colibritrader.com