


What Is Price Action Trading A Beginner’s Guide
Price action trading is all about making decisions based on the movement of an asset's price over time, straight from a “clean” chart. It’s a method that strips away the clutter of lagging indicators and focuses on reading the raw story the market is telling—the constant tug-of-war between buyers and sellers.
Decoding The Market’s Language
Imagine trying to understand a live conversation by only reading a summary someone wrote down ten minutes later. That's essentially what you're doing when you trade with indicators like moving averages or RSI. They're telling you what happened.
Price action, on the other hand, is like listening to that conversation in real-time. You learn to interpret every candlestick as a word and every pattern as a sentence. This gives you a direct, unfiltered view into market psychology and momentum.
Instead of analyzing a mathematical formula derived from past prices, you analyze the price itself. This simple shift allows you to react to what the market is doing right now, not what it was doing twenty candles ago.
A Quick Look Back
This idea isn’t some new fad; it’s been around for centuries. The roots of price action trading can be traced all the way back to 17th-century Japan. A legendary rice trader named Munehisa Homma developed candlestick charts because he realized that trader emotions, not just simple supply and demand, were the real drivers of market prices.
By plotting the open, high, low, and close, he could actually see patterns in crowd psychology taking shape. It’s a timeless method because it’s based on the one constant in any market: human behavior. You can read more about this fascinating history over at Optimus Futures.
Price Action vs Indicators
So, what's the real difference in practice between a price action trader and someone who relies on indicators? At their core, they represent two fundamentally different philosophies for analyzing the market.
One approach is direct and minimalist, focusing on the "now." The other is derivative, looking for confirmation from past data. Let's break down the key distinctions.
Price Action vs Indicator-Based Trading At a Glance
| Aspect | Price Action Trading | Indicator-Based Trading |
|---|---|---|
| Data Source | Raw price movements on a clean chart | Mathematical calculations of past price data |
| Timing | Real-time, leading information | Lagging, provides delayed confirmation |
| Decision Basis | Context, patterns, and market structure | Crosses, overbought/oversold signals |
| Chart Appearance | Minimalist and clean | Often cluttered with lines and oscillators |
Ultimately, a price action trader believes the price itself contains all the information needed to make a sound decision. An indicator-based trader, conversely, uses tools to simplify that price data, but often at the cost of being a step behind the live action.
The Three Pillars of Price Action Analysis
If you want to read a chart without clogging it up with indicators, you first have to learn the market's language. Price action analysis really boils down to three core components that, when used together, show you what the market is thinking and where it might be headed next. Getting these pillars down is your first real step toward trading with confidence.
Think of it this way: the pillars are the grammar, vocabulary, and sentence structure of the market's story. Once you see how they connect, you can start making sense of the narrative playing out on your screen.
Candlesticks as Storytellers
Every single candlestick on your chart is more than just a blip of data. It’s a miniature story—a snapshot of the battle between buyers and sellers over a specific period. The candle's body size, its shape, and those wicks sticking out the top and bottom give you massive clues about who's winning.
A long green candle? That’s buyers in complete control, shoving the price up with conviction. A long red one tells the opposite story: sellers are dominating. But what about the short-bodied candles with long wicks? Those are the interesting ones. They scream indecision or a sharp rejection of a price level, often hinting that the momentum is about to shift.
Support and Resistance Levels
Support and resistance are basically the historical floors and ceilings of the market. These are price levels where, in the past, buying or selling pressure was so intense that it was enough to halt or completely reverse the price.
Support: A price "floor" where demand (the buyers) is strong enough to keep the price from dropping any lower.
Resistance: A price "ceiling" where supply (the sellers) is strong enough to stop the price from climbing higher.
Learning to spot these key zones is absolutely fundamental to trading with price action. They are high-probability areas where you can anticipate a reaction. This is where you zoom in and look for those revealing candlestick patterns to confirm a potential trade.
Understanding Market Trends
The final pillar is figuring out the market's overall direction, or trend. It's just common sense: trading with the primary trend dramatically stacks the odds in your favor. The easiest way to spot a trend is by looking at the sequence of peaks and troughs on the chart.
- Uptrend: This is a series of higher highs and higher lows (HHHL). Picture yourself walking up a staircase—each step up is higher than the one before it.
- Downtrend: This is identified by a pattern of lower highs and lower lows (LHLL). It's like walking down that same staircase, where every step down is lower than the last.
This simple sequence of highs and lows is the foundation of what we call market structure. Being able to recognize these patterns is a cornerstone of any price action strategy. If you want to go deeper on this, check out our detailed guide on what is market structure.
And this isn't just theory. An in-depth study of the USDJPY market revealed that trades taken on HHHL patterns at key retracement levels hit a 68% win rate with a great risk-reward ratio over a ten-year span. You can read more about these powerful findings over at Learn to Trade the Market.
Common Price action Patterns You Can Spot Today
Once you've got a handle on the core pillars—candlesticks, support/resistance, and trends—you can start spotting recurring formations on your charts. Think of these price action patterns as common phrases in the market's language. Each one tells a specific story about the ongoing tug-of-war between buyers and sellers.
Learning to recognize them is how you graduate from theory to actually trading what you see. These patterns aren't magic signals; they're just visual maps of market psychology. Some suggest a trend is losing gas, while others point to a quick pit stop before the momentum continues.
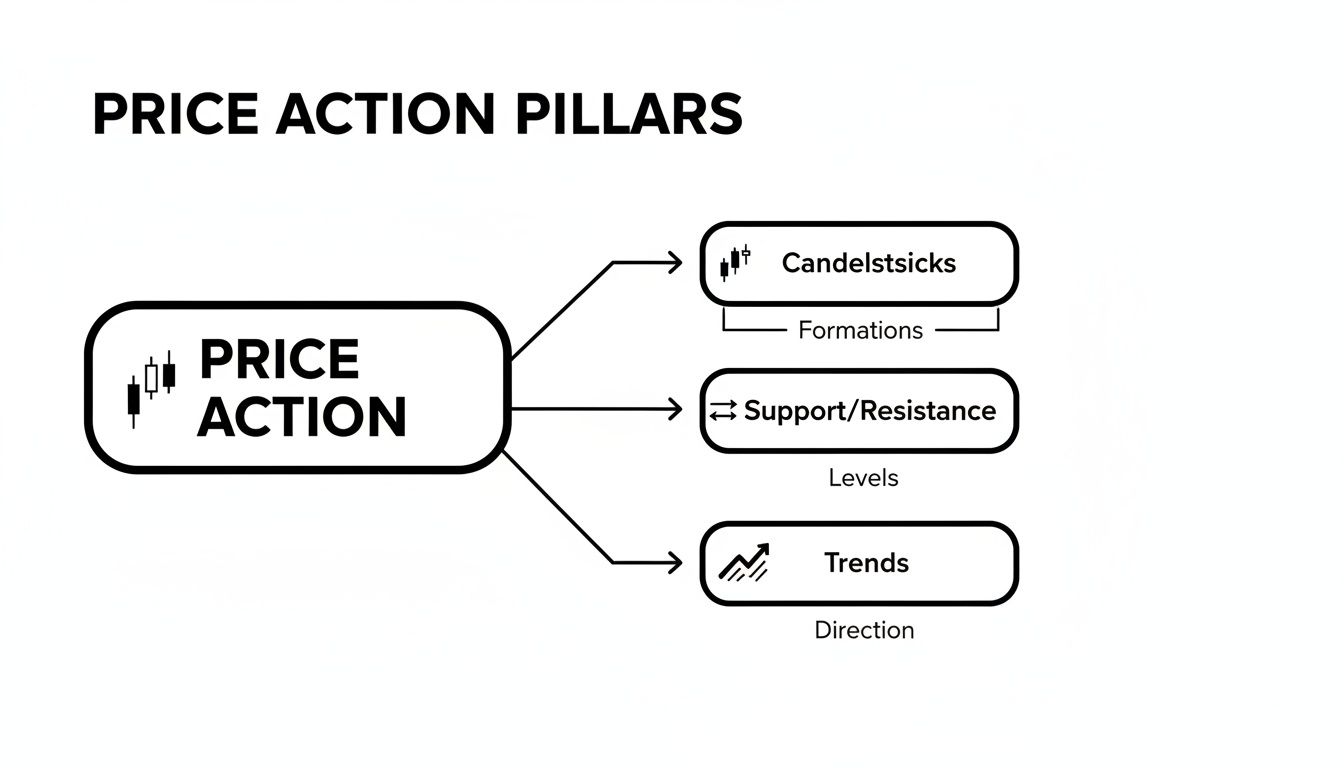
This visual shows exactly how those three pillars work together. They're not separate concepts; they combine to give you the full picture.
Reversal Patterns: The Signs of a Turning Tide
Reversal patterns are exactly what they sound like: signals that the current trend might be running out of steam and a change of direction is on the cards. Catching one of these at a key support or resistance level can be a golden, high-probability trading opportunity.
Two of the most powerful reversal signals you'll see are:
- The Pin Bar: This candle has a long wick (some call it a "tail") and a small body. It screams rejection. The price tried to push hard in one direction but was aggressively shoved all the way back by the opposing side. It’s a crystal-clear sign of a failed push and a potential reversal.
- The Engulfing Bar: This is a two-candle pattern where the second candle completely "engulfs" the body of the one before it. It shows a sudden, decisive shift in power. A bullish engulfing bar (green) swallows a red one, while a bearish engulfing bar (red) swallows a green one.
These patterns really do tell a story of exhaustion and takeover. A pin bar is the market yelling "NO!" to a certain price. An engulfing bar shows one side being completely steamrolled by the other.
This isn't just theory, either. Analysis of S&P 500 futures showed that classic reversal patterns like the head-and-shoulders broke down successfully 64% of the time. Better yet, they hit their price targets within an average of 10 days, especially when a spike in trading volume came in to confirm the move.
Continuation Patterns: When the Market Takes a Breath
Not every pattern signals a dramatic U-turn. Sometimes, the market just needs to pause and catch its breath before continuing in the same direction. We call these continuation patterns.
One of the most common you'll encounter is the Inside Bar. This setup happens when a candle (or even a few) forms entirely within the high-to-low range of the previous, larger candle.
An Inside Bar shows a moment of indecision or a temporary drop in volatility. I like to think of it as a coiled spring, building up tension for the next move. Traders watch for the price to break either above or below the range of that big "mother bar" as a signal that the original trend is back in business.
By learning to identify both reversal and continuation setups, you can begin to build a complete playbook of powerful price action patterns.
Building Your First Price Action Trading Strategy

Reading price patterns is one thing. Turning that knowledge into a repeatable plan is where the real work starts.
A strategy gives you structure and keeps emotion in check. It’s your roadmap from spotting an idea to hitting exit.
Before we dig into each step, here’s a quick checklist to guide your first price action trade.
Your First Price Action Trade Checklist
| Step | Action Item | Key Question to Ask Yourself |
|---|---|---|
| 1 | Choose Your Timeframe | Am I suited to intraday trades or multi-day swings? |
| 2 | Identify Key Support and Resistance Zones | Which price levels have stopped moves before? |
| 3 | Wait For A High-Probability Pattern | Is a clear pattern forming at my level? |
| 4 | Define Entry, Stop-Loss, & Profit Target | Have I pre-set entry, stop, and target? |
| 5 | Review and Journal Your Trade | What lesson will I take from this trade? |
Keep this checklist handy as we work through the steps below.
Step 1 Choose Your Timeframe
First, decide if you can focus on charts all day or prefer checking in occasionally. That choice will shape whether you hunt for fast, 5-minute moves or capture wider swings on the daily chart.
- Day Trader: Use 5-minute to 15-minute charts and aim to open and close positions within hours.
- Swing Trader: Study 4-hour or daily charts and hold positions for days or weeks.
Your timeframe sets the pace and the kinds of price action you’ll recognize.
Step 2 Identify Key Market Structure
Once your timeframe is locked in, step back and spot the major support and resistance zones. Think of them as the chart’s natural “floors” and “ceilings.”
Imagine scouting a forest for the best vantage points. You’re not trading yet—just marking the areas where price has turned around before. Draw simple horizontal lines to keep your view uncluttered.
Step 3 Wait For A High-Probability Pattern
Patience is the trader’s best ally. With zones in place, do nothing but let price come to you.
The magic happens when a reliable pattern—like a Pin Bar or Engulfing Bar—forms right on a key level. Patterns in isolation carry far less weight than those at a significant price point.
When that confluence shows up, you have a setup worth your attention.
Step 4 Define Your Trade Parameters
As soon as a valid pattern appears, lock in your plan before entering. You need three things nailed down:
- Your Entry Point
- Your Stop-Loss
- Your Profit Target
Setting these parameters in advance strips emotion out of the picture. It also enforces consistent risk management on every single trade.
Step 5 Review And Journal Every Trade
Whether you win or lose, close the loop by writing it down. A trading journal is your key tool for long-term growth.
Note the setup, why you took the trade, and the final outcome. Over time, you’ll see your strengths, spot repeating mistakes, and fine-tune your strategy.
Refer back to this checklist before each trade to keep your process disciplined and your mindset clear.
Common Mistakes To Avoid When Trading Price Action
Knowing what to look for in price action trading is one thing. Knowing what not to do is a completely different skill—and arguably, it's even more important. I've seen countless aspiring traders fall into the same traps, the ones that slowly sabotage their progress and bleed their accounts dry.
The good news? These pitfalls are usually born from simple things like impatience or fear, and they are entirely avoidable once you know what they are. Let's break down the most common mistakes I see traders make.
Overcomplicating Your Charts
The single biggest mistake I see from new traders is "analysis paralysis." This is what happens when your chart is so cluttered with trend lines, Fibonacci levels, moving averages, and oscillators that you can barely see the candlesticks themselves. It’s a mess.
The whole point of learning what is price action trading is to embrace simplicity. Your job is to listen to what the market is telling you, not to drown it out with a dozen conflicting indicators. A clean chart with just the key horizontal support and resistance levels lets the raw price action shine through. If your screen looks like a tangled mess, you're doing it wrong. Strip it all back.
Ignoring The Broader Trend
Another classic blunder is finding a picture-perfect pin bar on a 5-minute chart and getting completely tunnel-visioned, all while ignoring the fact that the daily trend is roaring in the opposite direction. It’s like trying to paddle a canoe against a raging river. You might make a tiny bit of headway, but eventually, the current is going to win.
Always, always start your analysis on a higher timeframe, like the daily chart. Figure out the market's main direction first. Only then should you zoom into a lower timeframe to find an entry signal that actually agrees with that bigger picture. The trend is your greatest ally.
Forcing Trades Out Of Boredom
This one is purely psychological. A lot of traders feel like they have to be in a trade to be productive. This leads them to take mediocre, "good enough" setups just because they're impatient and bored.
Successful price action trading is a waiting game. Think of yourself as a sniper, not a machine gunner. You're waiting patiently for that one high-probability setup to appear at a critical level.
If there's no obvious signal, the right move is to do nothing. Your number one job is to protect your capital. To build the right habits, you have to understand the most common trading mistakes to avoid. That knowledge will save your account more times than any single winning trade ever will.
Some Lingering Questions You Might Have
Even with a solid game plan, a few questions always pop up when you start putting theory into practice. Let's tackle some of the most common ones I hear from traders, so you can move forward with total clarity.
Think of this as clearing up any final bits of fog before you step onto the trading floor.
Can I Use Price Action On Any Timeframe?
Absolutely. The beauty of price action is that it’s universal. It’s all based on raw human psychology—the constant tug-of-war between buyers and sellers—and that dynamic is the same whether you're looking at a 1-minute chart or a 1-month chart. The patterns just scale up or down.
- A scalper will see these battles play out on the 1-minute and 5-minute charts, jumping in and out of the market.
- A day trader is typically living in the 15-minute to 1-hour world.
- Swing traders and long-term investors are zooming out, analyzing the daily and weekly charts to catch those huge, sweeping market moves.
The core skill doesn't change. You're still just reading the story the candles are telling you, no matter the timeframe.
Do I Need Any Indicators At All?
This is a big one. A price action "purist" would tell you to wipe your charts completely clean. No indicators, no oscillators, nothing but the raw price. And honestly, there's a lot of power in that minimalist approach.
However, a lot of very successful traders I know use a hybrid model. They might add a single 20-period Exponential Moving Average (EMA) to their chart. They're not using it to generate buy or sell signals, but more as a quick visual reference—a simple line that shows them the market's short-term trend or where price might find a bit of dynamic support.
The key is to avoid "analysis paralysis." If you do add an indicator, it must have one, single, clear purpose. It should support your price action analysis, not clutter it or contradict it.
How Long Does It Take To Get Good At This?
There’s no magic number here. Getting good at price action trading isn't about marking days on a calendar. It's about accumulating screen time and practicing deliberately.
Your progress depends entirely on your dedication to studying charts, keeping a detailed trade journal, and staying disciplined even when it's tough. Some traders click with the core concepts in a few months; for others, it takes longer. The goal shouldn't be some imaginary finish line. It's about showing up, putting in the work, and learning something from every single trade you take. It's a journey, not a race.
Ready to stop guessing and start trading with a clear, repeatable process? At Colibri Trader, we specialize in teaching a straightforward, price-action-based approach that just works. Discover your trading potential with us today.