


What Is Maximum Drawdown in Trading
Every trader knows the thrill of watching their account hit a new high. But what about the gut-wrenching feeling of watching it fall? The Maximum Drawdown (MDD) is the metric that measures exactly that—the biggest single drop your investment has taken from its highest peak to its lowest point.
Think of it as the ultimate stress test. It shows you the worst possible loss you would have experienced if your timing was perfect in all the wrong ways—buying at the absolute top and panic-selling at the absolute bottom. More than just a number, MDD reveals the true downside risk hiding within a trading strategy.
Understanding the Core Concept of Drawdown
Let's imagine your trading account's equity curve is like a mountain range. The highest point you reach is a "peak." But the journey is never a straight line up; you'll inevitably hit valleys and dips along the way. Your maximum drawdown is simply the deepest, most significant drop from one of those peaks down into a valley before the climb starts again.
This metric is so powerful because it cuts through the noise of daily volatility. Instead of just looking at day-to-day fluctuations, it zeroes in on the most painful period of sustained loss. It answers a critical question every trader should ask: "Historically, what's the most I could have lost with this strategy?"
Why Drawdown Matters More Than You Think
A great strategy on paper might show fantastic average returns, but a high MDD tells you the ride was anything but smooth. It might have been a white-knuckle rollercoaster. Knowing the MDD is essential for matching a strategy to your actual risk tolerance, not just your theoretical one.
Can you really handle a 30% drop in your account without abandoning your plan? A lower MDD generally points to a more stable, less nerve-wracking journey, helping you stay in the game long enough to see your strategy play out.
Key Takeaway: Maximum drawdown isn't just a historical stat; it’s a measure of both financial pain and emotional resilience. It quantifies a worst-case scenario, helping you decide if you can genuinely stomach the risks before you put real money on the line.
Maximum Drawdown At a Glance
To put it all together, here's a quick breakdown of what makes up the maximum drawdown.
| Component | Description |
|---|---|
| Peak Value | The highest point (high-water mark) an investment's value reaches. |
| Trough Value | The lowest point the investment's value hits after reaching the peak. |
| Recovery | The point at which the investment's value surpasses the previous peak. |
| The Formula | Calculated as (Trough Value - Peak Value) / Peak Value to get the percentage drop. |
This historical data gives you a clear picture of how a strategy performed under the most challenging conditions it ever faced.
Specifically, the MDD quantifies this largest percentage decline before a new peak is achieved. The calculation is straightforward: you identify the highest portfolio value and the subsequent lowest value before it recovers. For a deeper dive into the numbers, Wall Street Prep offers a great guide to the MDD formula and its components.
Calculating Your Maximum Drawdown Step by Step
Knowing what maximum drawdown is conceptually is a good start, but the real power comes from being able to calculate it yourself. This process puts a hard number on the potential risk of a trading strategy, and it’s much simpler than it might seem.
The formula is pretty straightforward: (Trough Value – Peak Value) / Peak Value. This gives you a percentage that represents the biggest hit your account has ever taken from a high point. Let's walk through an example to make this crystal clear.
Identifying the Peak and Trough
First things first, you need a record of your account's value over time. Let's say you began the year with $10,000. Here’s a hypothetical look at how the year played out:
| Month | Portfolio Value |
|---|---|
| January | $10,000 |
| February | $11,500 |
| March | $12,500 (Peak) |
| April | $11,000 |
| May | $9,500 |
| June | $8,750 (Trough) |
| July | $9,800 |
| August | $10,500 |
| September | $11,200 |
| October | $12,000 |
| November | $13,000 |
| December | $14,000 |
Looking at the table, your account hit its peak value of $12,500 in March. After hitting that high, it began to drop, eventually bottoming out at its lowest point—the trough value—of $8,750 in June. These two numbers are all we need.
This visual guide breaks down the simple, three-step process.
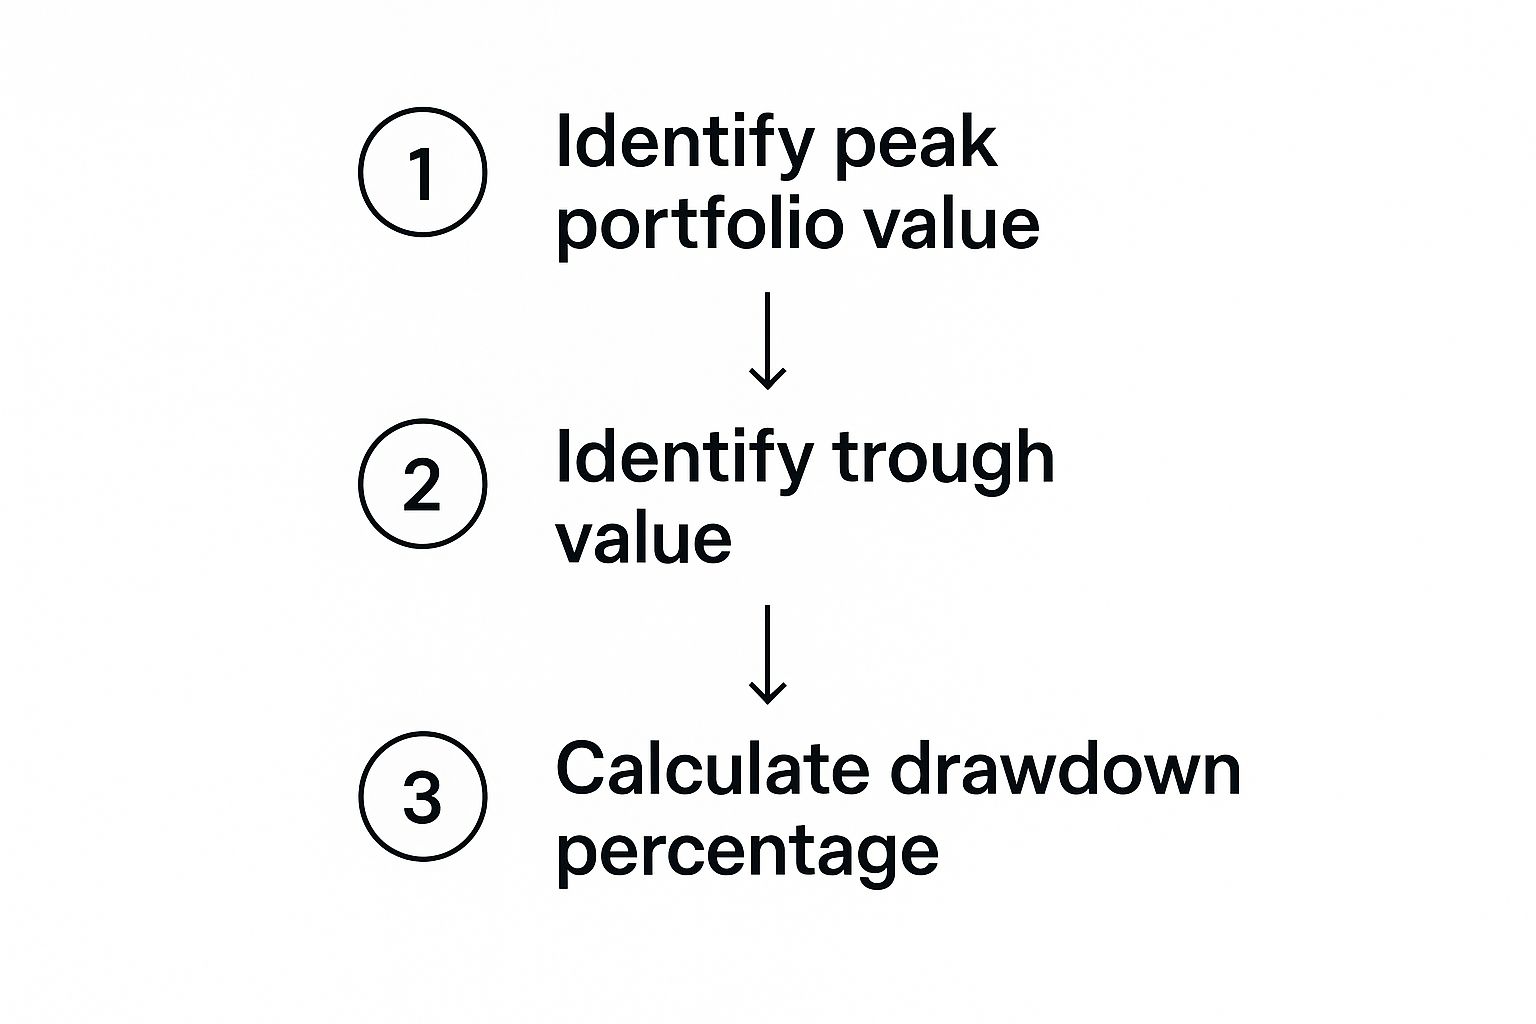
As you can see, it all starts with pinpointing that absolute high and the subsequent low. Once you have those, you can figure out the actual percentage loss.
Putting the Formula to Work
Now it’s time to plug our peak and trough values into the MDD formula.
- Get the formula:
MDD = (Trough Value - Peak Value) / Peak Value - Plug in the numbers:
MDD = ($8,750 - $12,500) / $12,500 - Do the subtraction:
MDD = -$3,750 / $12,500 - Get your answer:
MDD = -0.3or -30%
The maximum drawdown for this trading period was 30%. This tells us that, at its worst, the portfolio was down 30% from its last peak. This is a crucial piece of information when you learn how to backtest a trading strategy.
That single number gives you a much richer understanding of a strategy’s risk than just looking at average returns. It represents the historical "pain point"—a vital metric for any serious trader's risk management toolkit.
Why MDD Is More Revealing Than Volatility
Many traders get hung up on what is market volatility, that day-to-day choppiness of a stock or strategy. While volatility is an important piece of the puzzle, it doesn’t tell the whole story.
Maximum drawdown (MDD) measures something far more personal and painful: the real financial damage you would have suffered during the absolute worst-case scenario. It gets right to the heart of a trader's biggest fear.
Think of it this way: volatility shows you the general ups and downs, but MDD quantifies the single biggest loss you would have had to sit through. It’s a raw, unfiltered look at how a strategy holds up when things get really ugly.
Let’s imagine two trading strategies that both boast an average annual return of 12%. On paper, they might seem equally appealing. But a quick look at their MDD reveals two completely different experiences for the trader.
The Tale of Two Strategies
Strategy A has a maximum drawdown of -15%. Sure, there are dips, but they are manageable. The journey is relatively smooth, and it doesn't trigger the kind of gut-wrenching panic that leads to bad decisions. You can stick with the plan.
Strategy B, on the other hand, has an MDD of -45% despite that same 12% average return. Getting that return meant enduring a catastrophic drop that wiped out nearly half the account's value at its lowest point. How many traders would realistically hold on through that? Most would have panicked, sold everything at the bottom, and locked in a devastating loss.
Maximum drawdown reveals the psychological burden of a strategy. A lower MDD often means a smoother, less stressful ride, making it far easier to stay disciplined and actually see your long-term goals through.
This distinction is about more than just numbers on a screen; it's about survivability and risk-adjusted performance. It’s entirely possible for two strategies to have identical returns and volatility, yet wildly different maximum drawdowns.
Given the choice, traders will almost always prefer the strategy with the smaller drawdown. It implies less severe losses and, just as importantly, a quicker path to recovery.
Ultimately, MDD helps you set realistic expectations and match a trading strategy to your actual risk tolerance—not just the one you think you have on a good day.
Maximum Drawdown in the Real World
Theory is one thing, but seeing how maximum drawdown plays out in a real trading account is where the lesson truly hits home. Let's look at two completely different investment strategies that, on paper, both deliver a 15% average annual return. At first glance, you might think they're equally good choices. But once you look at their MDD, you'll see they tell two very different stories about risk.
Strategy A is a conservative, slow-and-steady approach. Strategy B is an aggressive, high-octane strategy gunning for quick profits. Even though their long-term returns are identical, the experience of holding each one is night and day. The MDD is the metric that shines a light on this hidden, and frankly crucial, difference.
Comparing Investment Strategies Using Maximum Drawdown
To really see the difference, let’s compare how two hypothetical investment strategies perform. This helps illustrate why MDD is such a critical piece of the puzzle when you're evaluating where to put your money.
| Metric | Strategy A (Low Volatility) | Strategy B (High Volatility) |
|---|---|---|
| Starting Capital | $100,000 | $100,000 |
| Peak Value | $120,000 | $150,000 |
| Trough Value | $102,000 | $75,000 |
| Maximum Drawdown | -15% | -50% |
| Investor Experience | A manageable dip, minimal stress. | A gut-wrenching drop, high stress. |
As you can see, the numbers don't lie. An investor in Strategy A had to stomach a -15% drawdown. While never fun, this is a fairly standard market correction that a disciplined investor could ride out without hitting the panic button.
The investor in Strategy B, however, watched their account get chopped in half with a brutal -50% drawdown. This is the kind of drop that causes sleepless nights and often forces people to sell everything at the absolute worst moment, locking in devastating losses. This is the "pain" that MDD measures.
The Steep Climb Back to Breakeven
Here's where the danger of a large drawdown really compounds: it makes getting back to where you started exponentially harder. This is a mathematical truth that trips up so many traders. The climb out of a deep hole is way steeper than the fall that got you there.
It’s a common mistake to think a 50% loss only needs a 50% gain to recover. The math is much harsher. A 50% drawdown requires a 100% gain just to get back to even.
Let’s apply this to our two strategies:
- Strategy A (15% Loss): To recover from its 15% drop, this portfolio needs to gain 17.6% to return to its previous peak. It's a challenge, but it's absolutely doable.
- Strategy B (50% Loss): After falling by half, this portfolio needs to double in value—a 100% gain—just to get back to where it was. That kind of return could take years, if it happens at all.
This powerful contrast shows that controlling your maximum drawdown isn't just about playing defense. It’s about keeping your capital intact so it can actually compound and grow over time. A strategy that protects you from the big one-way drops is what keeps you in the game, making your path to consistent profitability much more realistic.
Practical Ways to Keep Drawdowns in Check
Knowing what your maximum drawdown is is one thing; doing something about it is what really matters. This is where the theory ends and the practical work of building a resilient trading portfolio begins. It’s how you protect your hard-earned capital from those inevitable rough patches.
Let's be clear: the goal isn’t to eliminate drawdowns entirely. That's a fantasy. The real objective is to keep them within a manageable limit that you've defined ahead of time, one that aligns with your personal risk tolerance. Taking a proactive stance here ensures that one bad losing streak doesn’t knock you out of the market for good.
Use Stop-Loss Orders Intelligently
One of the most powerful tools in your arsenal for controlling drawdowns is the stop-loss order. Think of it as your automatic exit strategy. It’s a pre-set order to sell a position once it hits a specific price, effectively putting a hard cap on how much you can lose on any single trade. It takes the emotion out of the equation when a trade goes against you.
But a stop-loss is only as smart as the strategy behind its placement. If you set it too close to your entry, you'll get kicked out of perfectly good trades by random market noise. Set it too far away, and it's not really protecting you at all. A well-placed stop-loss is a fundamental part of disciplined trading.
Pro Tip: Never, ever move your stop-loss further away from your entry price to give a losing trade more "room to breathe." This is a classic emotional blunder that can quickly turn a small, controlled loss into a devastating one. Your discipline is your best defense against a massive drawdown.
Master Your Position Sizing
Even a winning strategy will fail if your position sizing is reckless. Position sizing is simply deciding how much of your capital to risk on a single trade. If you bet too big on one idea—no matter how confident you feel—you’re putting your entire account in jeopardy.
A time-tested rule of thumb is to risk no more than 1-2% of your total trading capital on any single trade. It's a simple guideline with a massive impact:
- It prevents one bad trade from blowing a huge hole in your account.
- It helps you stay calm and think clearly because you know your maximum loss is small and manageable.
- It forces you to be selective and focus on high-quality trade setups, not just trading for the sake of it.
Getting your position sizing right is a non-negotiable part of managing trading risk and staying in the game long-term.
Diversify Across Assets That Don’t Move Together
You've heard it a million times: don't put all your eggs in one basket. This is especially true if all those baskets tend to drop at the same time. Diversification is about smoothing out the bumps in your equity curve by spreading your risk across different assets that don't always move in the same direction.
The secret is finding non-correlated assets. For example, if your portfolio is heavy on tech stocks, think about adding something like commodities or bonds, which often behave differently during the same economic events. This approach can seriously dampen the impact of a drawdown when one specific sector gets hit hard.
By weaving these three strategies together, you move from being a passenger to being the pilot, actively managing your drawdown and building a trading approach that can withstand the market's inevitable storms.
Common Questions About Maximum Drawdown
Even after digging into how maximum drawdown works, a few questions tend to pop up again and again. Let's walk through them to make sure the concept is crystal clear.
Think of this as tying up the loose ends. Getting these answers straight will help you feel much more confident using MDD to evaluate your own trading.
Is a High Maximum Drawdown Always Bad?
Not necessarily, but it always signals significant risk. Whether that risk is "bad" really comes down to your personal trading style, your stomach for risk, and how long you plan to stay in the market.
For instance, a trader chasing aggressive growth in a volatile sector might see a high MDD as just part of the game. If you're young and have years to make back any losses, that might be a risk you're willing to take. But for someone trading to supplement their income, that same drawdown could be a disaster. Context is king.
How Is Maximum Drawdown Different From Volatility?
This is a great question. Volatility gives you a sense of the overall price movement—both the ups and the downs. It measures the general "wobble" in an asset's price.
Maximum drawdown, on the other hand, zeroes in on one specific thing: the single worst loss from a peak down to a subsequent low.
An asset can swing wildly day-to-day (high volatility) but never actually suffer a catastrophic, sustained drop, giving it a relatively small MDD. Conversely, a stock that seems stable could slowly drift downward for months, racking up a huge drawdown without ever looking particularly volatile on a day-to-day chart. MDD cuts through the noise and shows you the worst-case pain.
What Is a Good Maximum Drawdown Percentage?
There's no magic number here. What's considered "good" is entirely relative to the market and the strategy you're trading. A 10% MDD might be terrifying for a bond portfolio, but a 50% MDD could be pretty standard for a hot cryptocurrency.
A better way to think about it is to compare an asset's MDD to its peers or a benchmark index. If a strategy produces similar returns to the S&P 500 but with a much lower MDD, that tells you its risk management is top-notch. It’s all about judging the drawdown relative to the potential reward.
At Colibri Trader, we teach you how to build robust trading strategies with risk management at their core. Learn to master price action and control your drawdowns by visiting us at https://www.colibritrader.com.