


What Is Market Volatility and How to Navigate It
Let's talk about market volatility.Let's talk about market volatility.
In the simplest terms, it’s just the speed at which prices change. Think of it as a measure of financial turbulence.
Is the market calm and predictable, or is it a raging storm with prices swinging wildly up and down? That's what volatility tells you.
Decoding Market Volatility: A Simple Weather Analogy
I like to think about the market like the weather.
Some days are sunny and calm. The temperature is steady, and you know exactly what to expect. Other days, a storm rolls in out of nowhere, bringing howling winds and massive, sudden changes.
Market volatility is the financial world's weather report. It tells you how intense the market's "weather" is.
Now, it’s crucial to understand that volatility isn't inherently "good" or "bad." It’s just a natural force that every trader has to learn to read.
A calm, low-volatility market might feel safe, but it often means slower growth and fewer opportunities. On the other hand, a stormy, high-volatility market feels risky, but it can create some of the best trading setups for those who know how to navigate the chaos.
The real key is learning to read the forecast before you get caught in the rain.
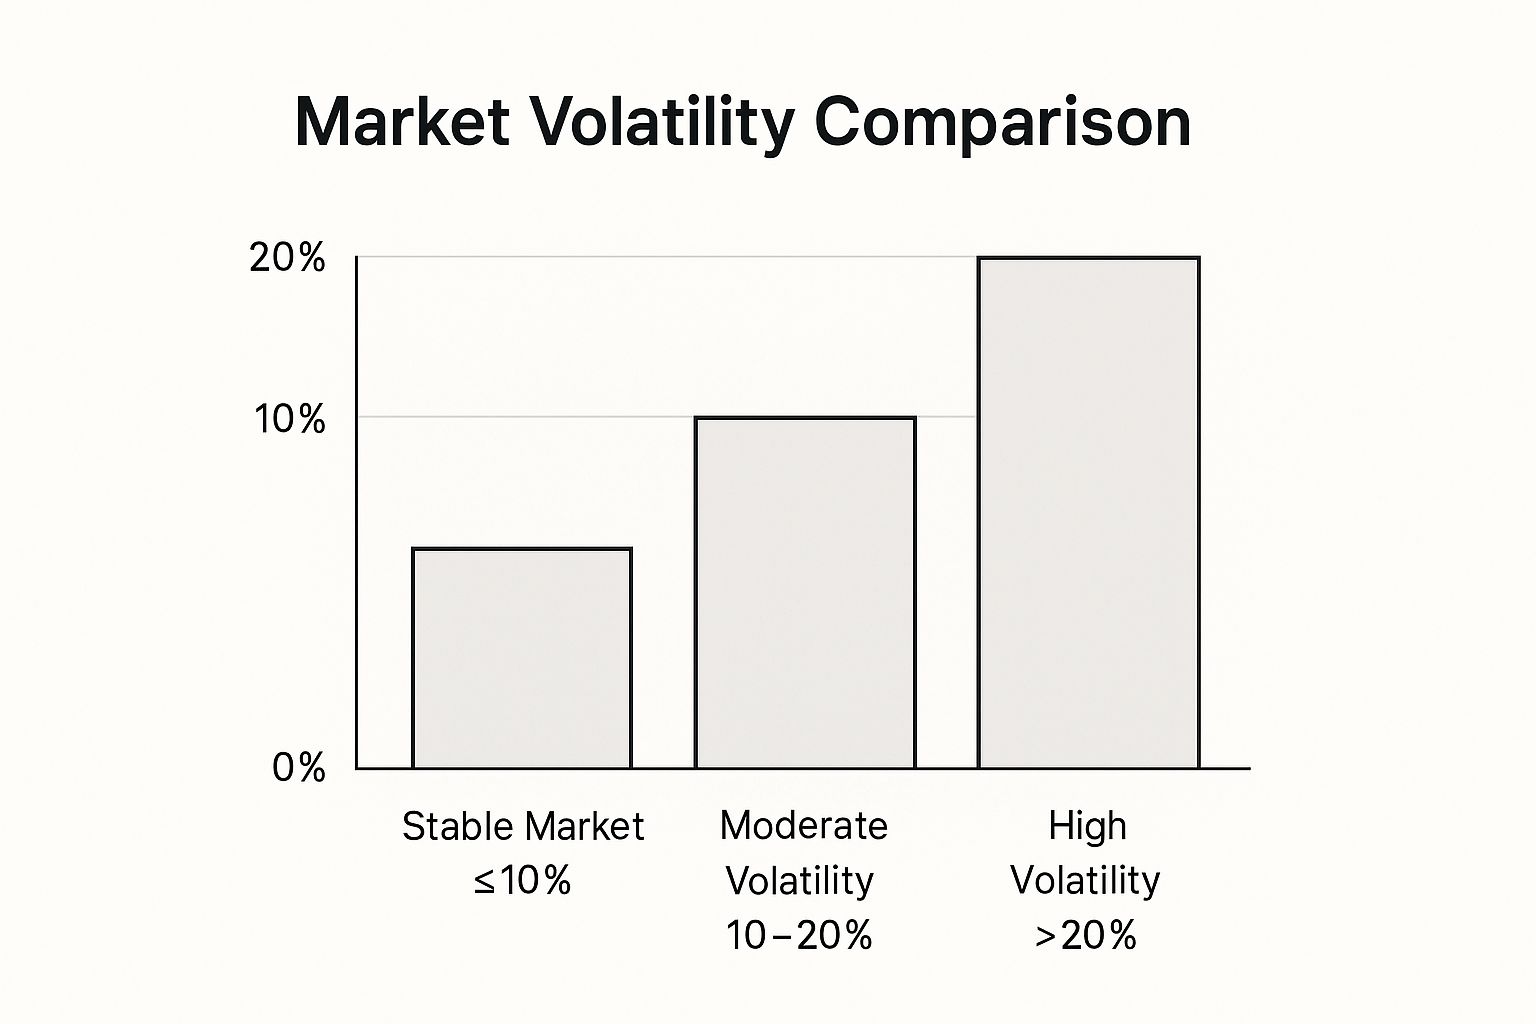
As this image shows, things start getting really interesting when volatility climbs. A level above 20% is a clear signal of a turbulent market, the kind we often see during major economic shake-ups.
A Quick Look at High vs Low Volatility
To make it even clearer, let's break down the characteristics of these two market "weathers." This table gives you a quick snapshot of what to expect in each environment.
| Characteristic | Low Volatility (Calm Market) | High Volatility (Turbulent Market) |
|---|---|---|
| Price Action | Small, predictable price movements. | Large, erratic price swings. |
| Pace | Slow, often range-bound trading. | Fast-paced, with rapid changes. |
| Risk | Lower immediate risk, but also lower reward. | Higher risk, but also higher potential reward. |
| Trader Psychology | Confidence, sometimes bordering on complacency. | Fear, panic, and uncertainty are common. |
| Opportunities | Good for range trading, less for breakouts. | Ideal for breakout and trend-following strategies. |
Seeing it laid out like this really drives home how different your approach needs to be depending on the market's mood. You wouldn't wear a t-shirt in a blizzard, and you shouldn't use a low-volatility strategy in a turbulent market.
From Analogy to Application
So, moving past the weather analogy, what is volatility in technical terms? It's a statistical measure of how much an asset's price moves away from its average. You'll usually see it expressed as a percentage.
For example, back in 2021, the U.S. stock market had an average volatility of around 24.99%. That number reflects the typical size of the price swings investors were dealing with that year.
At its core, volatility is a raw measure of fear and greed. When fear takes over, traders sell in a panic, and prices plummet. When greed or optimism is high, they buy aggressively, and prices shoot up. These emotional tides are what create the price action we see on our charts.
Understanding this is absolutely critical.
These price movements, driven by pure emotion, are what you see on your trading charts. If you’re just starting out, the single most important skill you can develop is learning how to read candlestick charts. They tell the visual story of the battle between buyers and sellers.
Mastering this skill turns abstract volatility data into something you can actually see and act on. It’s like learning to see the storm clouds gathering before the rain starts, allowing you to make smart decisions instead of just reacting to scary headlines.
The Hidden Forces Behind Market Swings
Market volatility doesn’t just happen. It's the market's gut reaction to new information, a frantic scramble to find a new price that everyone can agree on.
Think of a perfectly still pond. Toss in a single stone, and ripples spread in every direction. In the financial markets, these "stones" are the key drivers that kick off those sudden, violent price swings we call volatility.
These catalysts are the hidden forces that dictate the market's weather. Learning to spot them is the first step toward anticipating volatility instead of just reacting to it. When you understand the triggers, you can put the daily headlines into context and get a real feel for their potential impact.
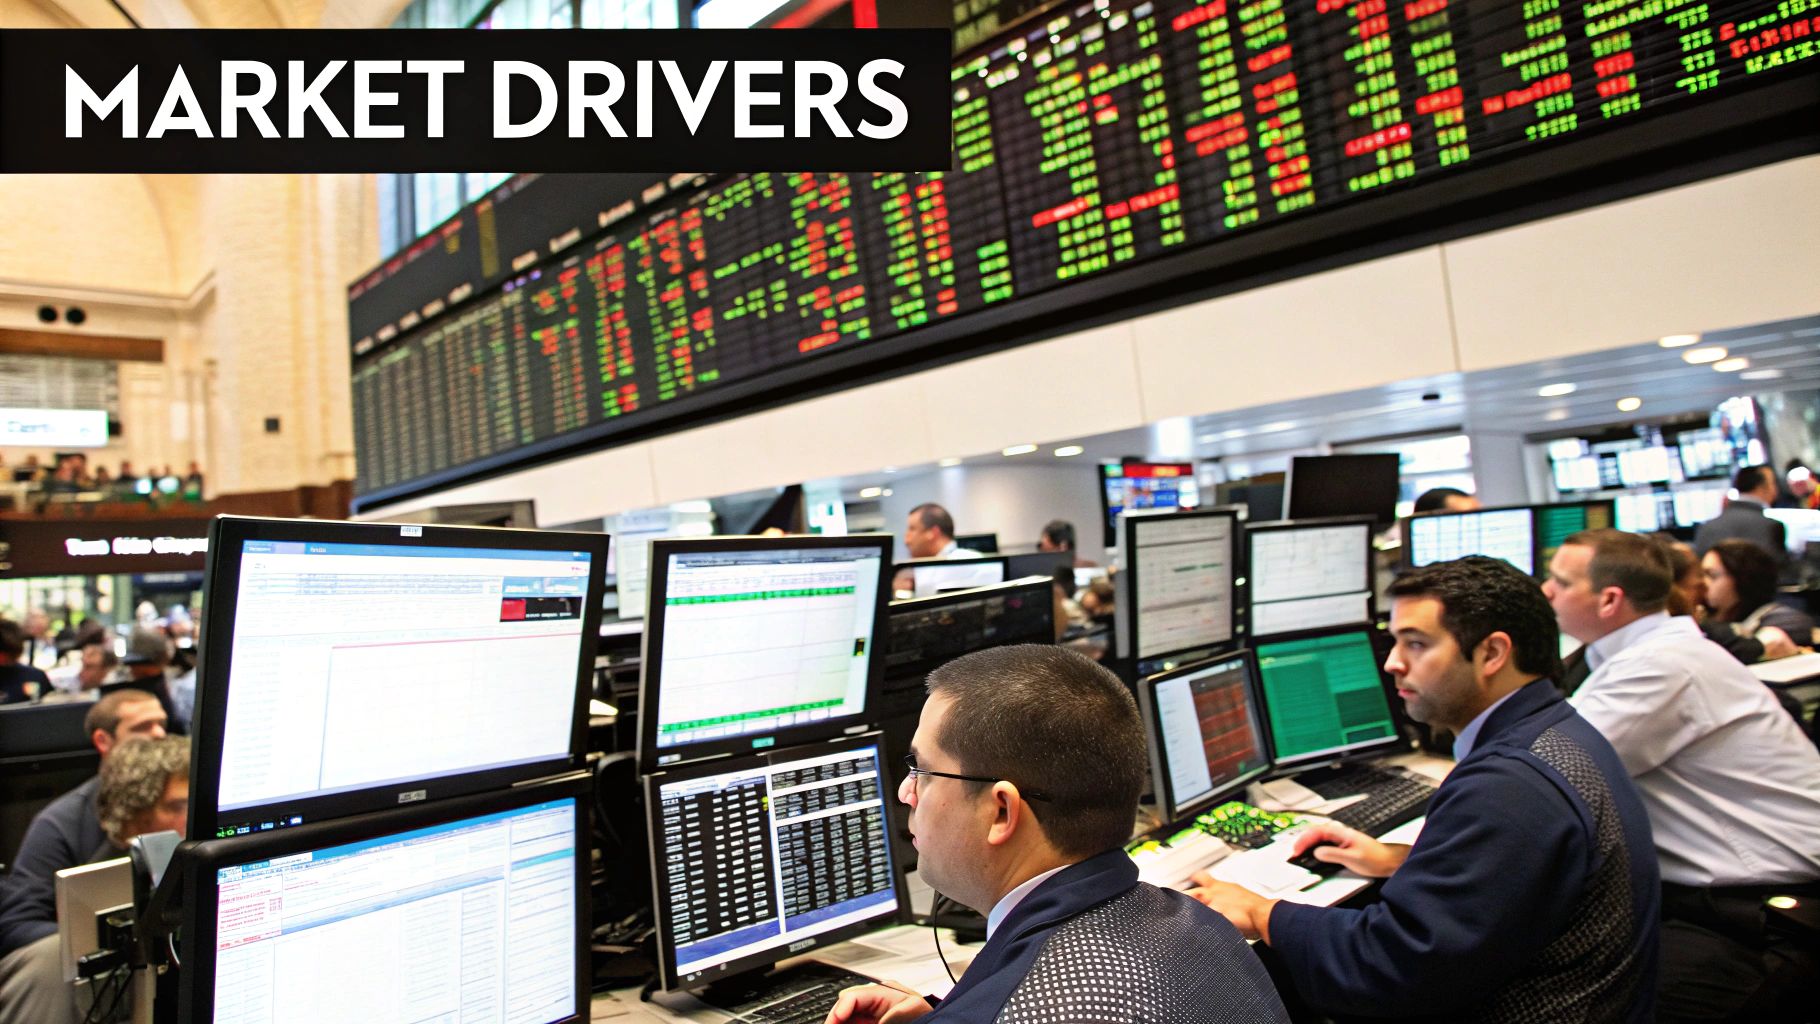
Economic and Political Triggers
The biggest waves are almost always created by economic and political events. These are the game-changers that alter the fundamental outlook for entire economies, which then ripples down to corporate profits and investor confidence. A few key examples include:
- Central Bank Decisions: When a central bank like the Federal Reserve tinkers with interest rates, it immediately changes the cost of borrowing for everyone. A surprise rate hike can send a jolt through the market, instantly raising the stakes.
- Economic Data Reports: Think of reports on inflation (CPI), employment (Non-Farm Payrolls), and manufacturing (PMI) as the economy's vital signs. A sudden fever spike in inflation or an unexpected jump in unemployment can trigger a massive sell-off.
- Geopolitical Events: Nothing spooks investors like uncertainty. Wars, trade disputes, and political chaos create massive question marks about the future. The rush to safety can cause sharp, erratic moves that are nearly impossible to predict.
These events force a complete rewrite of the assumptions investors were working with. The market has to quickly re-price everything to reflect the new reality, and that process is what creates the turbulence.
The market is a forward-looking machine. Volatility spikes when the vision of the future suddenly becomes blurry. The greater the uncertainty about future earnings, inflation, or political stability, the wider the price swings will be as investors struggle to find solid ground.
Company-Specific News and Investor Psychology
While big-picture economic events create market-wide tsunamis, news about specific industries or companies can whip up intense, localized storms. A tech company announcing a revolutionary new product might see its stock shoot for the moon, while an ugly court ruling can send it crashing back to earth.
Corporate earnings reports are a huge catalyst here. When a giant like Apple or Amazon reports earnings that miss the mark, it doesn't just hurt their stock. It can drag down the entire sector as traders start fearing the same weakness in similar companies.
And finally, we have the most powerful—and often irrational—force of all: investor psychology.
Fear and greed are contagious. Widespread panic can easily become a self-fulfilling prophecy, sparking sell-offs that go way beyond what the original news ever justified. This herd mentality is a massive amplifier of volatility, capable of turning small ripples into tidal waves.
How to Measure the Market's Mood
When the market gets choppy, professionals don't just rely on a gut feeling. They use specific tools to measure the mood, turning the abstract idea of "volatility" into a hard number you can actually track. This helps you figure out if fear or greed is in the driver's seat.
There are really two ways to look at volatility. The first is historical volatility, which is like looking in the rearview mirror. It crunches the numbers on past price swings over a certain period to tell you just how bumpy the ride has been.
The second, and what many traders consider more powerful, is implied volatility. This is a forward-looking metric. Think of it less like a history report and more like a weather forecast for the stock market, trying to predict the size of the storm before it hits.
The Market's "Fear Gauge"
When it comes to measuring what the market thinks is coming, the most famous tool out there is the CBOE Volatility Index, known to traders simply as the VIX. It’s so widely watched it’s earned the nickname the "Fear Gauge."
So what is the VIX, really? It's not a stock. You can't buy shares in "VIX, Inc." It’s a real-time index that shows the market's expectation of 30-day volatility.
The VIX gets its number from the prices of options on the S&P 500 index. When traders think big moves are on the horizon, they start buying up options to either protect their positions or to speculate. This increased demand drives up option prices. The VIX takes these option prices and translates them into a single number—giving you an instant snapshot of market anxiety.
A low VIX suggests investors are feeling pretty relaxed, expecting calm seas. But when the VIX starts climbing, it's a sign that fear is creeping in and traders are bracing for some serious price action.
What Do the VIX Numbers Actually Mean?
Okay, so you see a number, but what's it telling you? Here’s a simple way to break it down:
- Below 20: This is generally considered a calm, low-volatility environment. Investor confidence is usually high, and the market feels stable.
- Between 20 and 30: Things are getting a bit tense. This range signals more uncertainty and caution, often seen when there are economic worries bubbling up.
- Above 30: This is high-alert territory. A VIX above 30 means there's significant fear in the market. Readings this high are almost always tied to major market drops or financial stress.
The VIX was first introduced back in 1993, so we have a lot of history to see how it behaves. During quiet times, it can chill out around 10. But during a full-blown crisis? It can go parabolic.
For instance, the VIX shot past 80 during the 2008 financial crisis. It did it again in March 2020, spiking over 82 during the COVID-19 pandemic lockdown, which perfectly captured the extreme panic that had gripped investors. You can check out all the major spikes yourself and see the VIX's historical data on CBOE's website.
Keeping an eye on the VIX gives you a powerful read on the market's emotional state. It helps you see whether fear or complacency is steering the ship. That way, you can adjust your own strategy instead of getting blindsided by a sudden mood swing.
Why Market News Can Be Surprisingly Calming
It’s a common scene in the trading world: a big economic news announcement is on the calendar, and everyone braces for impact. Whether it’s a fresh inflation report or new manufacturing data, many traders assume it will automatically send the market into a chaotic spin.
But what if that assumption is backward?
Here's a counterintuitive idea that can seriously shift how you see these events: scheduled news often has a calming effect. It sounds wrong, I know, but major data releases frequently reduce market volatility instead of cranking it up. The reason is actually quite simple.
Markets absolutely hate a vacuum of information. The hours and days before a major announcement are filled with speculation, anxiety, and pure guesswork. That anticipation is what creates jittery, unpredictable price action. The announcement itself, even if the news isn't great, fills that void. It replaces rampant uncertainty with a concrete fact.
Think of it like waiting for a grade on a final exam. The anxiety and stress are usually at their peak in the days leading up to the results. Once you finally get the grade—even if it's not the A+ you hoped for—the uncertainty is gone. You now have a clear reality to deal with, and that clarity brings a sense of relief.
This is precisely how markets often behave when scheduled data drops.
Certainty Trumps Bad News
Believe it or not, the evidence strongly supports this. Contrary to popular belief, studies on key volatility indices show they often decline on days with major economic releases like ISM manufacturing updates or PCE inflation data.
In fact, over a sample spanning more than three decades, these "fear gauges" ended the day higher only about 45% of the time on data release days. This suggests that more often than not, the news provides a stabilizing dose of clarity.
This doesn't mean the market likes bad news; it just means it prefers a known negative over an unknown possibility. Once the number is out, traders can finally stop guessing and start pricing the new reality into the market, which often leads to a more stable environment.
True Shocks vs. Scheduled News
It is absolutely crucial to distinguish between scheduled reports and genuine, out-of-the-blue shocks. These are two completely different animals when it comes to driving what is market volatility.
- Scheduled News (The Stabilizer): These are the events on the economic calendar. Everyone knows they’re coming. The market has time to build expectations and prepare. The release of the data provides a resolution to all that built-up tension.
- True Shocks (The Catalyst): These are the events that nobody sees coming. Think of a surprise geopolitical conflict, a sudden banking crisis, or a natural disaster. There’s no warning, no time to prepare, and no clear endpoint.
These true shocks are what inject pure, unadulterated fear and uncertainty into the system, causing volatility to spike dramatically. The key difference is the element of surprise.
Understanding this distinction is a major step in developing a more mature trading psychology and mastering your mind to beat the market. It helps you filter out the everyday noise from the rare events that truly move the needle.
Practical Strategies to Navigate Turbulent Markets
Knowing what causes market volatility is one piece of the puzzle. Actually trading through it is something else entirely. When the markets get choppy, the difference between a successful trader and one who's up all night is a solid game plan.
This isn't about reacting with panic when prices swing. It's about having a set of proactive strategies you can pull from your playbook when things get wild. The goal is to build a portfolio that can take a punch and keep moving forward.
Instead of dreading volatility, you can learn to see it for what it is: a normal part of the market cycle. A part that, if you're prepared, can even spell opportunity. Let's get into a few core strategies to turn that knowledge into action.
Embrace True Diversification
Your first and most powerful shield against volatility is genuine diversification. I’m not just talking about owning a handful of different tech stocks. True diversification means spreading your capital across different asset classes that don't all move in the same direction when the pressure is on.
Think of it like building a well-rounded sports team. You don't want a team of only strikers. You need defenders and a solid goalkeeper, too. In your portfolio, this might look like:
- Stocks: The strikers, there for long-term growth.
- Bonds: The defenders, often moving up when stocks are down, providing stability.
- Commodities: Assets like gold can act as a goalkeeper, defending against inflation and market-wide uncertainty.
- Geographic Variety: Spreading investments across different countries protects you if one single economy hits a rough patch.
When one player on your team is having a bad day, the others can pick up the slack, smoothing out the overall performance of your portfolio.
Turn Volatility into an Advantage with Dollar-Cost Averaging
Wild price swings can be scary, no doubt. But a simple technique called dollar-cost averaging (DCA) can flip the script and turn that fear into a powerful advantage. The strategy is straightforward: you invest a fixed amount of money at regular intervals, no matter what the market is doing.
Let’s say you commit to investing $200 every single month.
When prices are high, your $200 buys you fewer shares. But when prices take a nosedive during a volatile spell, that same $200 automatically buys you more shares. Over the long run, this disciplined buying can seriously lower your average cost per share. It allows you to actually benefit from downturns instead of just fearing them.
The real magic of dollar-cost averaging is that it takes emotion out of the driver's seat. It forces you to buy when others are panicking and to be more measured when everyone else is getting greedy—all without the impossible task of trying to perfectly time the market.
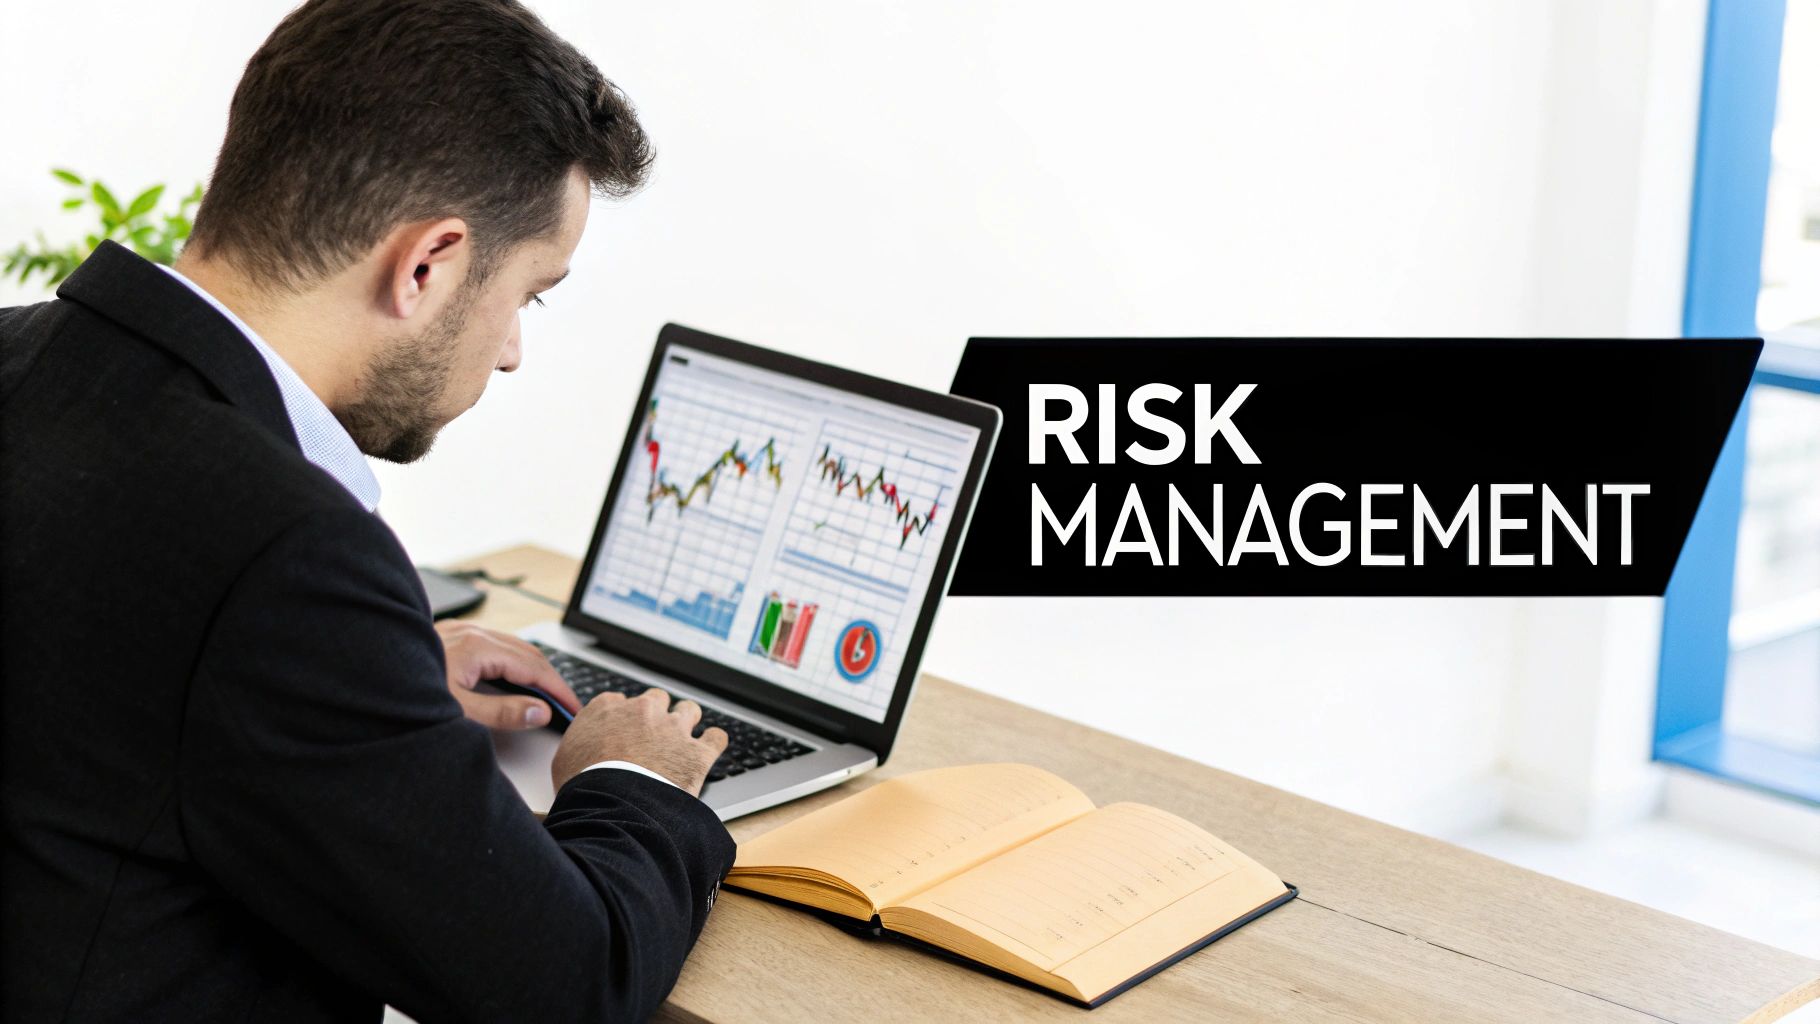
Rebalance Your Portfolio Regularly
As markets ebb and flow, your carefully designed asset mix will naturally drift. After a strong bull run, your stocks might swell to become a much bigger slice of your portfolio pie than you initially planned. This quietly exposes you to a lot more risk than you might be comfortable with.
This is exactly where portfolio rebalancing comes into play. On a regular schedule—maybe once or twice a year—you take a hard look at your portfolio. The idea is to sell a bit of what has done well and use the proceeds to buy more of what has lagged behind.
It's a disciplined process that locks in some of your gains and, crucially, brings your portfolio back in line with your original risk tolerance. Think of it like a pilot making small, constant adjustments to stay on course through turbulence. A foundation of strong risk management to keep your money safe is the bedrock of any successful long-term trading career.
Answering Your Top Questions About Volatility
We've covered a lot of ground on what volatility is, where it comes from, and how to deal with it. Now, let's nail down some of the most common questions I hear from traders. Think of this as your quick-reference FAQ to really solidify these concepts and help you trade with more confidence, no matter what the market throws at you.
Is High Volatility Good or Bad for Investors?
This is the big one, the question I get asked most often. The truth is, it’s not that simple. High volatility isn't automatically "good" or "bad"—it's both.
It's a classic double-edged sword.
For a long-term investor who can keep their cool, a volatile market can be a massive opportunity. It’s when you see fantastic companies go on sale, letting you pick up shares at bargain-bin prices. But for a short-term trader, that same volatility can be a nightmare, increasing the chances you'll get stopped out or make a bad trade based on emotion.
The real key isn't to chase volatility or run from it. It's to have a trading plan that you know can handle it.
Can I Invest Directly in Market Volatility?
Yes, you can get direct exposure to market volatility. The most common way is through financial products that are linked to the VIX index. These include instruments like VIX-linked Exchange-Traded Funds (ETFs) and Notes (ETNs), as well as VIX options and futures contracts.
Important: Let me be very clear—these are highly complex, specialized tools. They are built for sophisticated traders, mainly for hedging or very short-term speculation. They are absolutely not for beginners or long-term retail investors because of how they are structured and the potential for fast, catastrophic losses.
How Does Market Volatility Affect My Retirement Savings?
It's natural to get a pit in your stomach when you see the value of your 401(k) or other retirement accounts bouncing around during volatile periods. But how much it actually matters really comes down to your time horizon.
- Far from Retirement: If you've got decades to go, volatility is just noise. It's part of the journey. In fact, market dips are a good thing—your regular contributions are now buying more shares for the same amount of money.
- Nearing Retirement: This is where volatility becomes a serious risk. A big market crash right before you plan to start drawing an income can do permanent damage to your nest egg. This is precisely why financial advisors typically recommend shifting your portfolio towards more conservative assets, like bonds, as you get closer to retirement. It's all about protecting the capital you've worked so hard to build.
Which Markets Are Typically the Most Volatile?
Volatility is not the same across the board. Different asset classes have completely different personalities, and knowing them is crucial for building a balanced portfolio.
Generally speaking, some of the most volatile markets include:
- Cryptocurrencies: Famous for their wild and incredibly fast price swings.
- Emerging Market Stocks: They can offer explosive growth potential, but that comes with the baggage of political and economic instability.
- Small-Cap Stocks: Smaller companies tend to have much bigger price moves compared to their large-cap, blue-chip cousins.
- Commodities: Assets like crude oil are extremely sensitive to global supply, demand, and whatever geopolitical drama is unfolding that week.
On the other end of the spectrum, assets like government bonds and stable, blue-chip dividend stocks are usually much less volatile. They can act as a stabilizing anchor for your portfolio when other markets are going haywire.
At Colibri Trader, we teach you how to read the market's story directly from the price chart, so you can confidently navigate any level of volatility. Our proven, price-action based approach helps you build the skills and discipline needed for consistent results, free from confusing indicators or jargon. Find out more at https://www.colibritrader.com.