


What Is Market Sentiment? A Trader’s Guide

Ever walked into a room and just felt the mood? Maybe it was a tense meeting or an exciting party. You can't see it, but you can feel the collective energy. That's exactly what market sentiment is.
It's the overall attitude of traders and investors toward a market or a specific asset. It's the crowd's financial mood—are they feeling optimistic and buying everything in sight, or are they pessimistic, selling off in a panic?
Decoding the Crowd and Market Sentiment
Think of a live auction. You can instantly pick up on the vibe. Is the room buzzing with excitement, bids flying, and prices soaring? Or is the atmosphere heavy and cautious, with hesitant buyers and falling prices? That blend of greed, fear, optimism, and panic is the heart of market sentiment.
In the financial markets, this mood is just as real, even though traders are scattered all over the world. It’s the shared psychological state of everyone involved. This collective mindset is incredibly powerful because it directly fuels buying and selling, which is what actually moves the price.
The Battle Between Bulls and Bears
At its core, market sentiment is a constant tug-of-war between two opposing forces: the bulls and the bears.
-
Bullish Sentiment (Optimism): When investors are feeling good, they expect prices to go up. This confidence leads to more buying, which increases demand and—you guessed it—pushes prices higher. It often becomes a self-fulfilling prophecy, usually kicked off by positive news or strong economic data.
-
Bearish Sentiment (Pessimism): On the flip side, when pessimism takes over, investors expect prices to fall. This triggers selling, which floods the market with supply and drives prices down. Fear, negative headlines, or economic worries are the typical culprits here.
This emotional undercurrent is a huge piece of the trading puzzle. While fundamental analysis looks at a company’s balance sheet and technical analysis studies charts, sentiment analysis tunes into raw human emotion. The psychology of trading is a massive driver of market behavior, and getting a handle on it can give you a serious edge.
Market sentiment often acts as a counterweight to pure logic. In the short term, widespread fear or greed can yank prices far away from their "fair value" as determined by traditional metrics.
To help you visualize the key differences, here's a quick breakdown of what defines bullish and bearish sentiment.
Bullish vs Bearish Sentiment at a Glance
This table simplifies the core characteristics of the market's two primary moods.
| Characteristic | Bullish Sentiment (Optimism) | Bearish Sentiment (Pessimism) |
|---|---|---|
| Market Expectation | Prices are expected to rise. | Prices are expected to fall. |
| Dominant Emotion | Greed, confidence, FOMO (Fear Of Missing Out). | Fear, anxiety, uncertainty. |
| Primary Action | Buying (going "long"). | Selling (going "short"). |
| Price Action | Higher highs and higher lows (uptrend). | Lower lows and lower highs (downtrend). |
| News Impact | Positive news is amplified; negative news is ignored. | Negative news is amplified; positive news is dismissed. |
| Investor Behavior | Eager to buy dips, hold positions. | Quick to sell rallies, exit positions. |
Understanding these distinctions helps you quickly assess the prevailing mood and anticipate potential crowd behavior.
Ultimately, reading market sentiment isn't about having a crystal ball. It’s about taking the market's emotional temperature. By figuring out whether the crowd is leaning toward greed or fear, you can better anticipate shifts in supply and demand. This adds a crucial layer of context to your trading, helping you see not just what the market is doing, but what it might do next.
How We Measure the Market's Mood
Trying to measure something as vague as a "mood" across an entire market sounds a bit like trying to catch fog in a net, doesn't it? Yet, for decades, traders and economists have been doing exactly that, finding clever ways to turn those widespread feelings into concrete, usable data.
One of the oldest and most reliable methods is through survey-based indices. You can think of these as large-scale polls for the economy, designed to take a regular census of optimism and pessimism.
They work by directly asking people how they feel about their own financial situation and where they think the broader economy is headed.
This diagram breaks down the core idea. The overall market sentiment is essentially a tug-of-war between two primary forces: the bulls (optimists) and the bears (pessimists).
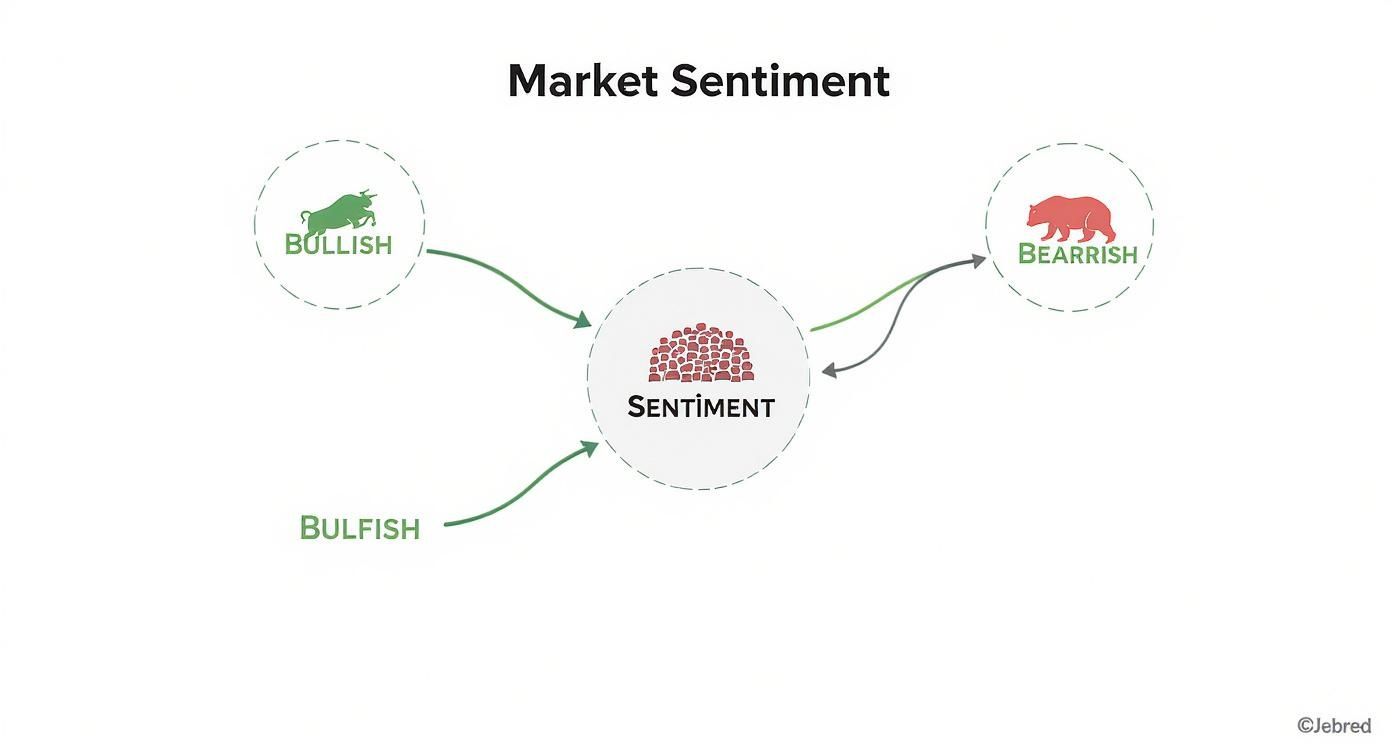
This constant battle between the bull and the bear is what really drives the crowd psychology that we see playing out on the charts every single day.
Diving into Consumer Confidence Surveys
Two of the heavyweights in this space are the University of Michigan Consumer Sentiment Index and the Conference Board’s Consumer Confidence Index. These aren't just small-time surveys; they poll hundreds of households every month, asking some very direct questions:
- Personal Finances: Are you better or worse off financially than you were a year ago?
- Economic Outlook: Do you expect business conditions to improve or get worse over the next year?
- Buying Conditions: Is now a good time to pull the trigger on big-ticket items like a car or new appliance?
The answers get crunched into a single index number. If that number is on the rise, it’s a sign of growing optimism, which often leads to more consumer spending and a healthier economy. But if it starts to fall, it signals creeping pessimism, which can mean wallets are about to tighten up, potentially slowing things down.
For instance, you might see a headline that the eurozone consumer confidence index is holding at -14.2, a touch below what the market was expecting. That one number gives us a powerful snapshot of the collective mood of millions of people.
These surveys cut right to the chase, giving us a direct look into the psychological state of the economy. They aren't based on what the market did, but on how everyday people feel. That makes them a unique and powerful leading indicator.
For any trader, these data releases are dates to circle on the calendar. A surprisingly low sentiment reading can be an early warning shot, suggesting that the economic tailwinds that were pushing a trend along might be starting to die down. Learning to spot these shifts is a massive part of figuring out how to identify market trends before the crowd catches on.
Of course, traditional surveys are just one piece of the puzzle. For a more granular, data-heavy perspective, modern approaches like AI stock market analysis are completely changing the game. These tools can sift through news, social media, and other data points in real-time.
By combining the old-school surveys with these newer, faster methods, you get a much richer, more complete picture of what's really driving the market.
The Trader's Real-Time Sentiment Toolkit
While broad economic surveys give us a general sense of the mood, active traders need to know what's happening right now. We need a real-time pulse of the market's heartbeat.
This is where technical indicators come into play. Instead of asking people how they feel, these tools cut straight to the chase, measuring sentiment directly from market activity. They provide an instant snapshot of fear and greed as it unfolds.
Two of the most powerful instruments in this toolkit are the Volatility Index (VIX) and the put-call ratio. Think of them as your personal weather forecast for the market, signaling potential storms or clear skies ahead.
Gauging Fear with The VIX
Often called the "fear gauge," the CBOE Volatility Index (VIX) measures the market's expectation of volatility over the next 30 days. Crucially, it’s not looking at past price swings; it’s a forward-looking measure derived from options prices on the S&P 500.
Here’s a simple way to think about it: when investors get nervous, they buy "insurance" in the form of options to protect their portfolios. This sudden demand for protection is what drives the VIX higher.
- A high VIX (above 30) tells you there's significant fear and uncertainty in the air. Traders are bracing for large price swings, which often happens during sharp market sell-offs.
- A low VIX (below 20) suggests complacency and confidence. Investors aren't too worried about big downward moves, signaling a more stable or bullish environment.
Remember early 2020? As the COVID-19 pandemic began to unfold, the VIX spiked to levels not seen since the 2008 financial crisis. It was screaming extreme investor anxiety long before the full economic impact was clear.
Reading the Bets with The Put-Call Ratio
Another essential real-time tool is the put-call ratio. This metric is beautifully simple: it compares the total trading volume of put options (bets that an asset will fall) to call options (bets that it will rise). It gives you a direct, unfiltered look at whether the market is leaning bearish or bullish.
A straightforward interpretation looks like this:
A put-call ratio above 1.0 suggests bearish sentiment is taking over, as the volume of puts outweighs calls. Conversely, a ratio below 0.7 often indicates that bullish sentiment is dominant, with more traders piling into calls.
However, many contrarian traders use this tool differently. They see extremely high or low readings as potential reversal signals. An unusually high put-call ratio might actually mean that pessimism has hit its peak, creating a fantastic buying opportunity for those brave enough to step in.
These indicators are invaluable for adding context. They help you understand the story behind the price action you see on the charts, like the one told by candlestick patterns for intraday trading. By combining these tools, you can get a much clearer picture of the emotional drivers pushing the market.
Listening to the Digital Chatter

While the big surveys and market indicators give us a solid snapshot, they can be slow to react. They often miss the rapid-fire shifts in mood that happen minute-by-minute. A huge part of understanding market sentiment today involves tuning into the massive, ongoing conversation happening online across news sites, forums, and social media.
This is where modern technology really shines. Instead of polling a few hundred people, algorithms can now sift through millions of text-based data points in real-time. This method, usually called sentiment analysis or opinion mining, uses artificial intelligence to pick up on the emotional tone of written content.
Think of it as having an AI-powered ear to the ground. It reads articles, blog posts, and social media updates, automatically classifying the language as positive, negative, or neutral. What you get is an immediate, unfiltered pulse on how investors and the public feel about a particular stock, index, or the market as a whole.
Turning Words into Data
This process lets us actually quantify the collective mood of the digital crowd. For example, a sudden spike in negative language about a company across financial news sites and Twitter could be a powerful early warning sign of falling investor confidence. This shift might show up online hours or even days before it hits the price charts.
The real power here is in the scope and speed. It helps you spot emerging narratives and emotional shifts before they become mainstream news, giving you a unique edge. This isn't just noise; it has a measurable impact. A 2024 study on news sentiment and market volatility found that periods of negative news were directly linked to increased market instability and a greater chance of price corrections. You can read the full research on news sentiment's market impact to see the data for yourself.
By analysing the digital chatter, we move from observing past price action to anticipating future sentiment-driven moves. It’s like seeing the storm clouds gather before the rain starts to fall.
To pull meaningful insights from this flood of online discussion, you really need specialised platforms. There are various social media sentiment analysis tools designed to filter the signal from the noise, turning raw online conversation into something you can actually use in your trading. This real-time analysis offers a dynamic layer of information that perfectly complements traditional methods, giving you a much more complete picture of the market’s psychological state.
How to Trade with Market Sentiment
Knowing the market's mood is one thing, but actually using that insight to place smarter trades is a whole different ball game. Understanding what market sentiment is gives you a powerful layer of context, but it isn't a crystal ball.
Think of it as a tool to help you anticipate potential shifts in supply and demand. The real key is weaving sentiment analysis into your existing trading strategy, not just trading on a hunch. There are really two ways to go about it: you can trade with the crowd, or you can trade against it. Both work, but only if you know when to use them.
The Contrarian Approach: Betting Against the Herd
Contrarian trading is the art of going against the grain. This entire strategy is built on a simple idea: when sentiment swings to an extreme—whether that’s overwhelming fear or just plain irrational greed—the market is often coiled up for a reversal.
Imagine a crowded lifeboat. When everyone panics and rushes to one side (that's your extreme sentiment), the boat becomes dangerously unstable. It’s almost guaranteed to tip back the other way.
-
Extreme Fear as a Buy Signal: When panic is running rampant and everyone is dumping their positions, indicators like the VIX will be screaming. A contrarian doesn't see this as a reason to run for the hills. They see a potential buying opportunity. With most of the sellers already out of the market, there's often very little downward pressure left, which can create a solid price floor.
-
Extreme Greed as a Sell Signal: On the flip side, when euphoria takes hold and it seems like a stock can only go up, the contrarian gets nervous. This "irrational exuberance" is often a sign that every possible buyer is already in the market. Who’s left to push the price higher? This can be a great signal to take profits or even consider a short position.
A core belief of contrarian trading is that the majority is almost always wrong at major market turning points. By spotting those moments of peak pessimism or optimism, you can position yourself for the correction that inevitably follows.
This isn’t an easy path. It takes real discipline and courage to buy when everyone you know is panic-selling. But that’s often where the biggest opportunities are hiding.
The Trend Following Approach: Riding the Wave
The polar opposite is trend following. Here, you're not fighting the current; you're swimming with it. The goal is to align your trades with the dominant market sentiment. This approach works on the assumption that a strong trend, fueled by powerful sentiment, is far more likely to continue than it is to reverse.
When you're a trend follower, sentiment indicators aren't for spotting reversals. They're for confirming the strength and health of the trend you're already in.
For example, during a powerful uptrend, you'd want to see consistently low volatility (a low VIX reading) and bullish signals from put-call ratios. These signs would confirm that optimistic sentiment is firmly in control, giving you the confidence to hold your long positions or even add to them on small dips. It's all about riding that wave of positive momentum for as long as it lasts.
Both strategies have their place. A contrarian approach can be incredible for nailing major market tops and bottoms. Trend following, on the other hand, is perfect for profiting from those long, sustained moves.
Here at Colibri Trader, our price action methodology is all about reading sentiment directly from the charts. We teach traders to understand the story the candlesticks are telling—it's a direct reflection of the ongoing battle between fearful sellers and greedy buyers. This helps you develop the instinct to know when to follow the crowd and, more importantly, when it's time to bet against it.
Common Questions About Market Sentiment
Once you get the hang of the core ideas, a few practical questions always pop up. It's one thing to understand a concept, another to actually apply it. Let's tackle some of the most common ones I hear from traders, so you can see how sentiment fits into a solid trading plan and avoid the usual traps.
Is Market Sentiment a Reliable Trading Signal?
This is the big one, and the answer isn't a simple yes or no. Market sentiment is not a crystal ball. Let me be clear: it won't magically predict where the price is headed next.
Think of it more like a weather forecast for the market. A forecast calling for heavy rain doesn’t mean your picnic is definitely ruined, but it sure tells you to bring an umbrella. That's what sentiment does—it gives you crucial context.
Sentiment indicators are at their best when they confirm (or challenge) what you’re already seeing. For instance, if your price action analysis suggests a bottom is forming and sentiment indicators are screaming extreme fear, that's a much more powerful buy signal than either piece of information on its own.
Relying only on sentiment is a fast way to blow up your account. Its real power comes from adding a layer of crowd psychology to your technical or fundamental strategy. It helps you understand the why behind the price moves.
How Can a Beginner Start Using Sentiment Analysis?
You don't need to get bogged down with complex AI tools or fancy data feeds to get started. A beginner can build a real feel for sentiment with a few simple habits.
- Track the VIX: Make checking the CBOE Volatility Index (VIX) part of your daily routine. Just watch its level and see how it reacts to big news. Seeing it spike during a market sell-off is a live-fire drill in how fear looks and feels.
- Follow Major News: It's not just what the news says, but how it says it. Pay attention to the tone of headlines on major financial sites. Is the language euphoric and overly positive, or is it all doom and gloom? This is a raw, basic form of sentiment analysis.
- Monitor One Key Ratio: Pick a single indicator to follow, like the put-call ratio for the S&P 500. After a while, you’ll start to get a gut feeling for when bullish or bearish bets are getting too crowded and lopsided.
The goal here isn't to immediately find perfect trade signals. It's about getting in tune with the market’s collective mood. Start small, just observe, and see how these forces push and pull on price.
What Are the Biggest Mistakes Traders Make?
Knowing what not to do is just as important as knowing what to do. When traders start using market sentiment, they often stumble into a few predictable traps that can cost them dearly.
The single biggest mistake is throwing all other analysis out the window. I've seen traders see extreme fear on the VIX and immediately jump into a long position, completely ignoring a brutal underlying downtrend or terrible fundamental news. Sentiment has to be weighed against the bigger picture.
Another huge pitfall is misinterpreting the data. A very low put-call ratio, for example, signals extreme bullishness. A trend-follower might see this as confirmation to buy, but a contrarian trader sees it as a flashing red light of over-optimism—a sign that a top might be near. You have to know how you're using the indicator, otherwise you risk trading directly against the insight it's trying to give you.
At Colibri Trader, we don’t get lost in external indicators. We teach you how to read sentiment directly from price action itself. By focusing on the core principles of supply and demand, you can learn to see the footprints of crowd psychology right on your charts, giving you a much clearer and more direct path to confident trading.
Learn more about our approach at https://www.colibritrader.com.