


What Is Drawdown in Forex? A Guide to Risk, Control, and Recovery

When you’re trading forex, you’ll inevitably run into the term drawdown. In simple terms, it's the dip your account takes from a peak high to a subsequent low point. It’s the journey through the valley before your account (hopefully) climbs to a new mountain peak.
Getting your head around this concept is absolutely the first step toward managing your risk like a professional.
What is a Forex Drawdown and Why Does It Matter So Much?
Picture your trading account like a mountain climbing expedition. The highest point you’ve reached is your account’s peak equity. When you have a few losing trades and descend into a valley before climbing again, that descent is your drawdown.
Let’s be clear: drawdowns are a totally normal part of trading. No strategy on earth wins 100% of the time. Every single trader, from the newbie to the hedge fund pro, experiences them.
But ignoring drawdowns is like climbing without a safety rope. They are arguably the single most important measure of the risk baked into your trading strategy. A small, manageable drawdown is fine—it's a sign of a healthy, active strategy. A deep, long-lasting drawdown? That’s a massive red flag that something is seriously wrong and your capital is in danger.
The Basic Drawdown Formula
Calculating a simple drawdown is pretty straightforward. You're just measuring the percentage drop from your account's highest point (the peak) to its lowest point (the trough) after that peak.
Drawdown (%) = (Peak Equity – Trough Equity) / Peak Equity * 100
For example, let's say your account hits a new high of $15,000. A string of losses then drops it down to $10,000. Your drawdown would be 33.33%. This simple calculation shows you the real-world hit that volatility can have on your account. You can find more great insights on mastering drawdown over at nurp.com.
Drawdown at a Glance
To really get what drawdown means in forex, it helps to break down the main terms you'll keep hearing. Getting these down will help you read your account's performance like a pro.
Here's a quick cheat sheet to make sense of it all.
| Concept | Simple Explanation |
|---|---|
| Peak | The absolute highest value your trading account has ever reached. |
| Trough | The lowest point your account hits after reaching a new peak. |
| Recovery | The climb back up from a trough to your previous peak. |
| Risk Metric | Drawdown is a key number used to measure the historical risk of a strategy. |
Think of these as the vital signs of your trading strategy. They tell you a story about how your approach handles the inevitable ups and downs of the market.
How to Calculate and Interpret Your Drawdown
Knowing that drawdowns are a part of trading is one thing. Actually measuring it in your own account is something else entirely. That’s where you gain real control.
When you calculate your drawdown, you're turning that gut-wrenching feeling of loss into a hard number you can actually work with. It’s the first step toward using data, not emotion, to steer your trading ship.
The math itself is refreshingly simple. You just need two numbers: the highest point your account equity ever reached (the peak) and the lowest point it fell to afterwards (the trough).
The Simple Drawdown Formula
To get your drawdown percentage, you’ll use this straightforward formula:
Drawdown (%) = (Peak Equity – Trough Equity) / Peak Equity * 100
Let's walk through a quick example. Say you started with $10,000, and a great run of trades pushed your account up to a new high of $15,000. That’s your peak. But then the market turns, and a few losing trades drag your account down to $10,000. That’s your trough.
Plugging those numbers into the formula:
- ($15,000 – $10,000) / $15,000 = $5,000 / $15,000 = 0.333
- 0.333 * 100 = 33.3% Drawdown
This means your account fell by 33.3% from its highest point. This journey from peak to trough is exactly what the chart below shows.
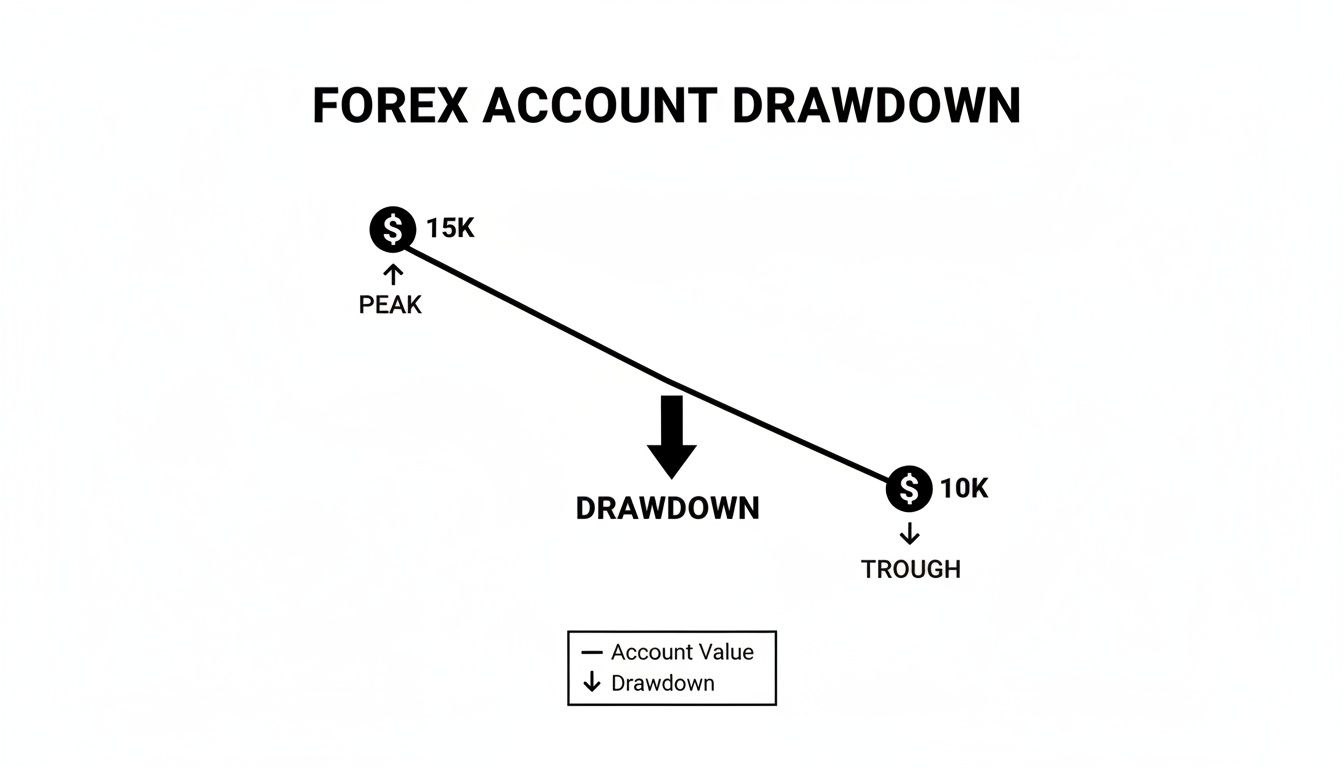
The key thing to remember is that drawdown is always measured from the absolute peak, not your starting balance. This gives you the most honest picture of the risk you're taking.
What Do Your Drawdown Numbers Mean?
Getting the number is the easy part. Knowing what it means is what separates disciplined traders from gamblers. A drawdown percentage isn't just some random statistic; it’s a vital health check for your trading strategy and your risk management.
Here's a practical way to think about the different levels:
- 5-15% Drawdown: This is generally healthy and perfectly normal for most conservative or moderate trading strategies. Think of these as the expected bumps in the road.
- 20-30% Drawdown: A dip this significant is a clear signal to stop and seriously review what you're doing. Some very aggressive strategies might live in this territory, but for most, it’s a major warning sign.
- 40%+ Drawdown: This is a five-alarm fire. A drawdown this deep means your risk management has likely failed, and climbing out of that hole will be incredibly difficult.
It's not just about one single drawdown, either. You have to keep an eye on the maximum drawdown your strategy has ever faced over its lifetime. You can learn more about why understanding your maximum drawdown is crucial for long-term survival in the markets.
When you track this data, your equity curve becomes more than just a line—it becomes a map. It shows you exactly when your strategy is struggling and tells you when it's time to adjust course before a small dip turns into a disaster.
Understanding The Different Types of Drawdown
To really get a handle on drawdown, you can't just look at a single number. Not all drawdowns are created equal, and different types tell you very different parts of your risk story. Think of it like a doctor running multiple tests to check a patient's health; a trader needs to look at different drawdown metrics to properly diagnose the risk in their trading system.
Getting familiar with these variations takes you from simply knowing you lost money to understanding how, when, and from what point that loss happened. That deeper insight is what separates a fragile trading plan from a resilient one. Each type is like a different lens, giving you a unique view of how your account holds up under pressure.
Maximum Drawdown (MDD): The Ultimate Stress Test
Maximum Drawdown (MDD) is probably the single most important drawdown metric for any trader. It measures the biggest single drop your account has ever taken from a peak to a subsequent low. In simple terms, it's the worst-case loss your strategy has had to stomach in its history.
Let's say your account grew from an initial $10,000 to a new peak of $25,000, but then hit a rough patch and fell to $15,000 before it started climbing again. Your MDD would be $10,000, or a 40% hit from that $25,000 peak. This isn't just a dry statistic—it’s a very real measure of the kind of financial and psychological pain you might have to endure to stick with your strategy.
Relative and Absolute Drawdown
While MDD gives you the big-picture view of historical risk, two other types offer more specific insights: Relative and Absolute Drawdown. They help you look at risk from different starting points.
-
Relative Drawdown: This is a more dynamic metric. It measures the largest drop relative to an account high, much like MDD, but it also takes into account floating (unrealized) profits and losses. It’s often used in platforms like MetaTrader to show the biggest percentage drop from the highest equity point, making it critical for traders who are actively managing open positions.
-
Absolute Drawdown: This one is much simpler. It only cares about one thing: the difference between your initial deposit and the lowest point your account ever fell below that starting amount. If you started with $10,000 and your account dipped to $8,000 at its lowest point, your absolute drawdown is $2,000. It doesn't matter if the account later grew to $50,000; this metric is purely about how much you were "underwater" compared to your starting capital.
To make these distinctions crystal clear, let's break them down side-by-side.
Comparison of Drawdown Types
This table compares Maximum, Relative, and Absolute Drawdown to clarify their distinct roles in risk analysis.
| Drawdown Type | What It Measures | Why It Matters for Traders |
|---|---|---|
| Maximum Drawdown | The largest peak-to-trough drop in account history. | Shows the biggest historical loss a strategy has endured. It's a key indicator of potential risk and helps you set realistic expectations. |
| Relative Drawdown | The largest percentage drop from the highest equity point (including floating P/L). | Crucial for active trade management, as it reflects risk on open positions and gives a real-time view of performance under pressure. |
| Absolute Drawdown | The biggest loss measured from the initial deposit. | Tells you how far your account has ever gone into the red compared to your starting capital. It's a simple measure of "did I lose my own money?" |
By looking at all three, you build a much more complete and honest risk profile for your trading.
MDD shows you the strategy's historical resilience, Relative Drawdown tracks your risk while trades are live, and Absolute Drawdown measures performance against your initial stake. This multi-faceted view is the foundation of truly sophisticated risk management.
The Trading Habits That Cause Severe Drawdowns
Let's get one thing straight: catastrophic drawdowns don't just happen. They're almost never a surprise. Instead, they are the predictable, painful result of specific, high-risk trading habits.
While small dips in your equity are a normal part of the game, a massive drawdown is almost always self-inflicted. It’s not the market that blows up an account; it’s the trader’s undisciplined reaction to a losing streak.
The good news is that recognizing these destructive patterns is the first step to avoiding them entirely. Most of these mistakes come from a breakdown in discipline, usually when fear and greed take the wheel. Your rule-based plan is the only thing standing between you and these psychological traps.
Over-Leveraging Your Trades
Leverage is the definition of a double-edged sword. Yes, it can amplify your winning trades, but it magnifies your losses at the exact same terrifying speed. A trader who gambles a huge chunk of their account on a single idea, hoping for a home run, is really just setting the stage for disaster.
Think about it. If you risk 10% of your capital on one trade, it only takes a handful of consecutive losses to get you into deep trouble. A string of just three or four bad trades—which happens all the time in forex—could wipe out nearly half your account. This habit alone is responsible for more blown accounts than anything else.
A disciplined trader knows that survival is the name of the game. By consistently risking a small, fixed percentage—like 1-2% of their capital per trade—they guarantee that no single market move can ever cause a catastrophic loss.
This simple rule forces you to focus on your process and execution, not just the random outcome of one single trade.
The Dangers of Emotional Trading
When discipline breaks down, raw emotion takes over. Two of the most destructive emotional responses are revenge trading and ignoring your stop-loss rules, and both are guaranteed to accelerate a drawdown.
- Revenge Trading: This is what happens after a particularly frustrating loss. Instead of stepping away to clear your head, you jump right back into the market, often with a bigger position size, desperate to "win back" what you just lost. This isn't trading; it's pure gambling, and it's a recipe for disaster.
- Ignoring Stop-Losses: Your stop-loss is your non-negotiable safety net. Moving it further away because you feel the market is about to turn around is a fatal mistake. It turns a small, manageable loss into an uncontrolled and potentially devastating one.
- Inconsistent Position Sizing: Bouncing between risking 1% on one trade and 5% on the next creates chaotic, unpredictable swings in your equity. Consistency in how much you risk is absolutely vital for maintaining a smooth equity curve and avoiding those deep, gut-wrenching drawdowns.
Each of these habits violates the most fundamental rules of risk management. By identifying and consciously avoiding them, you can build a trading plan that puts capital preservation first, keeping your drawdowns small and your trading career long.
Proven Strategies to Manage and Minimize Drawdown
Knowing what drawdown is is one thing. Learning how to control it is where the real power lies. Think of proactive risk management as your playbook for turning theory into practice, making sure the small, inevitable losing streaks never spiral into account-threatening disasters.
This isn't about chasing some mythical "no-loss" strategy. It's about building a durable trading system that can absorb the market's natural punches. The real goal is to bake drawdown control into every single decision you make, creating a foundation for consistent, long-term trading.
Implement The 1-2 Percent Rule
The single most powerful defense you have against a killer drawdown is disciplined position sizing. The 1-2% rule is a true cornerstone of professional trading, and it’s simple: never risk more than 1% to 2% of your account balance on any one trade.
If you're trading with a $10,000 account, this means your maximum loss per trade is capped at just $100 to $200. This one rule makes it mathematically impossible for a few bad trades to cripple your account. It shifts your focus to the quality of your setups, not the quantity of your wins.
The statistics are grim but telling: a staggering 70-80% of severe drawdowns are caused by poor risk management, almost always from risking far more than this conservative limit. Historical backtests also confirm that strategies keeping maximum drawdowns under 20% are overwhelmingly more likely to survive in the long run.
Set Intelligent Stop-Loss Orders
A stop-loss is your non-negotiable exit door when a trade goes south. But just slapping it on at an arbitrary percentage isn't the way to go. The most effective stop-losses are based on market structure—the actual story that price action is telling you.
Intelligent placement means finding key levels where the market has reacted before. These are your logical lines in the sand.
- Supply and Demand Zones: Placing a stop just beyond a proven zone gives your trade a natural, logical buffer.
- Recent Swing Highs/Lows: Setting your stop just past a recent peak or valley aligns your risk with the current market flow.
- Technical Levels: Major support and resistance lines also provide obvious, logical points to define your maximum risk.
This approach lets the market's own behavior dictate your stop-loss, not a random number you picked out of thin air.
A stop-loss isn't admitting failure; it’s a pre-planned business expense. It's the cost of discovering your trade idea was wrong, and paying that cost quickly is how you preserve capital for the next great opportunity.
Follow a Comprehensive Trading Plan
Finally, every move you make must be guided by a written trading plan. This document is your trading constitution, outlining exactly how you’ll operate before you ever risk a single dollar. Your plan must pre-define your entry, exit, and risk management rules for every single trade. No exceptions.
A solid plan takes emotion and guesswork completely out of the picture. It specifies your strategy for lot sizing, which is essential for properly executing the 1-2% rule. You can learn more about how to calculate lot sizing in our detailed guide.
When a losing streak inevitably hits—and it will—your trading plan is the anchor that keeps you grounded. It stops you from revenge trading, widening your stop-loss, and all the other destructive habits that turn minor drawdowns into major catastrophes.
The Psychology of a Successful Drawdown Recovery
Climbing out of a drawdown is as much a mental battle as it is a mathematical one. Let's be honest, a string of losses takes an emotional toll on anyone. It’s that gut-punch feeling that can push even seasoned traders toward the very habits that caused the mess in the first place—revenge trading, oversized positions, you name it.
The very first step is to accept the brutal, unforgiving math of recovery. A 20% drawdown doesn't just need a 20% gain to get back to breakeven; it requires a 25% gain. Suffer a devastating 50% loss? You now need a massive 100% return just to get your capital back to where you started.
This simple arithmetic shows exactly why aggressive, emotional attempts to "win it all back fast" are almost always doomed to fail.
Rebuilding Your Discipline and Confidence
Instead of desperately chasing profits, you have to shift your focus to rebuilding discipline and trust in your process. A drawdown recovery isn't just about the percentage points on your screen; time and psychology are the real heavy lifters here.
Forex data paints a stark picture: while good systems can recover from average drawdowns of 22%, an alarming 70% of retail traders throw in the towel after a dip of 30% or more. Why? The emotional strain becomes unbearable. According to these forex drawdown recovery statistics at volity.io, strategies that keep their maximum drawdown under 20% have a dramatically higher chance of long-term survival.
A healthy comeback needs a clear, strategic roadmap. Not a panicked reaction.
- Take a Strategic Break: Seriously, step away from the charts. Clear your head. This isn't quitting; it's a tactical pause to stop emotional decisions from digging the hole deeper.
- Conduct a Thorough Review: Go through every single trade that contributed to the drawdown. Be brutally honest. Where did you break your rules? What patterns of error do you see?
- Cut Your Trade Size: This is non-negotiable. Cut your position size in half, or even more. The goal right now is not to hit a home run. It’s to regain your confidence with small, consistent, well-executed wins.
By focusing on flawless execution with reduced risk, you shift your entire mindset. You stop chasing losses and start reinforcing the good habits that make you a successful trader. This process turns a painful drawdown into your most valuable trading lesson.
Mastering the mental game is what separates consistently profitable traders from everyone else. For a much deeper dive into this critical topic, check out our comprehensive guide on mastering trading psychology. This approach is how you transform a painful setback into a stronger foundation for all your future success.
Your Questions About Forex Drawdown Answered
Even experienced traders have questions, especially when it comes to the nitty-gritty of risk. Let’s tackle some of the most common questions I hear about drawdown to make sure these concepts are crystal clear.
What Is a Good Maximum Drawdown in Forex?
This is a question I get asked all the time, and the honest answer is: it depends on your strategy and stomach for risk. However, there are some solid benchmarks in the professional trading world.
Most seasoned traders I know aim to keep their maximum drawdown (MDD) below 20%. A figure in this range usually signals a robust strategy with risk firmly under control.
If your strategy is a bit more aggressive, you might see drawdowns creep into the 20-30% range. This isn't necessarily a disaster, but it demands your full attention and very strict oversight. Anything tipping over 40% is a massive red flag. It tells you the strategy has a dangerously high risk of wiping out your account, and clawing your way back from that deep of a hole is a monumental challenge, both mathematically and mentally.
How Can I Use Drawdown to Improve My Trading?
It’s easy to see a drawdown as just a painful loss. But the best traders reframe it. Think of a drawdown period as a free diagnostic report on your entire trading system.
Instead of just waiting for it to be over, you need to dive in and analyze it. Pull up the trades that created the dip. Are there patterns?
This is a powerful learning opportunity. Were you revenge trading? Bending your rules on a specific pair? Forcing trades in choppy, unpredictable markets? This kind of honest review helps you patch the holes in your strategy and fine-tune your risk rules. It turns a negative event into one of your most valuable trading lessons.
Is It Possible to Avoid Drawdown Completely?
In a word: no. It's completely impossible to avoid drawdowns in trading, and anyone who tells you otherwise is selling snake oil.
Trading, by its very nature, involves taking calculated risks to generate profit. Losses are a natural, unavoidable part of that process. Even the most legendary traders on the planet deal with drawdowns. It’s just part of the game.
The goal isn't to chase the fantasy of a strategy with zero losses. The real goal is to manage drawdowns—to keep them within limits you’ve defined before you even enter a trade. Solid money management ensures that when drawdowns happen, they're just small, recoverable bumps in the road, not catastrophic events that threaten your career.
At Colibri Trader, our entire approach to price action is built on a foundation of disciplined risk management. We don't just teach you how to find trades; we teach you how to protect your capital so you can stay in the game long enough to win.
Explore our trading programs and start building a resilient strategy today.