


What Is a Retracement in Trading A Guide to Spotting Pullbacks
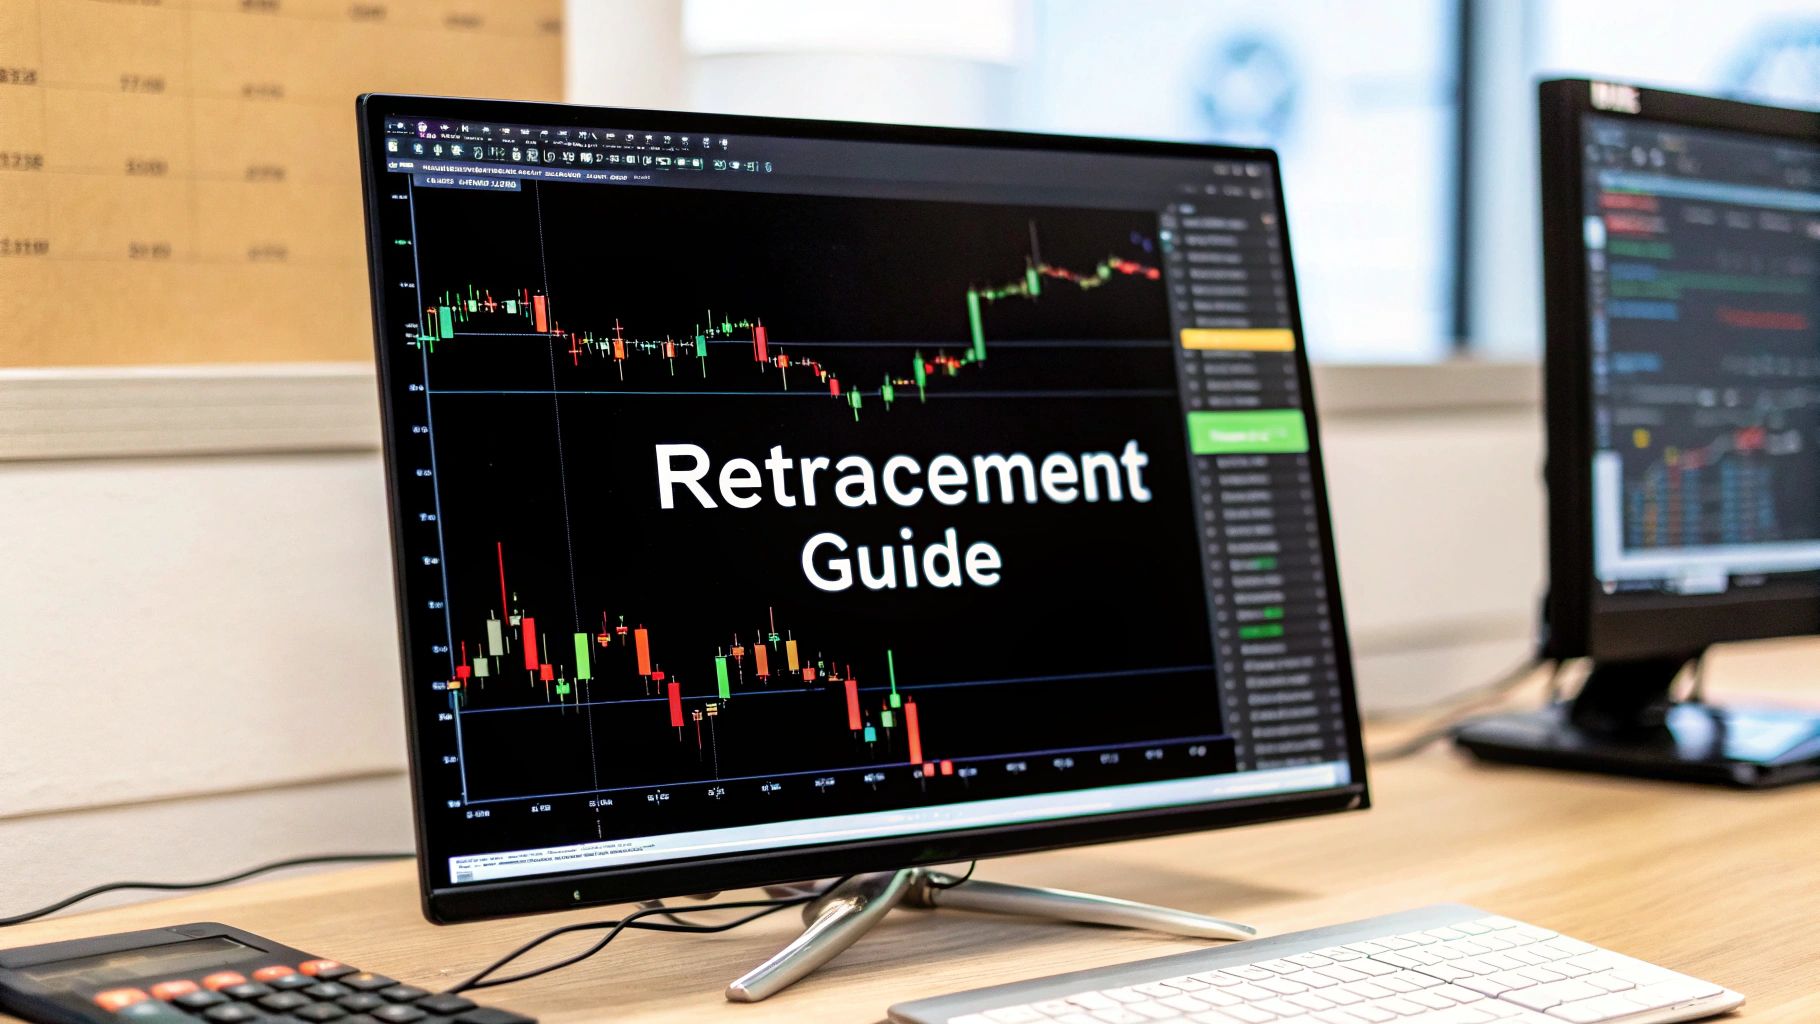
A retracement is just a temporary pullback against the main trend. Think of it like a market catching its breath.
During a strong run-up, prices don’t just shoot up in a straight line. They often pause and dip slightly as some of the early investors decide to cash in and take profits. This little dip is the retracement, and it happens right before the trend kicks back into gear.
Defining a Retracement in Trading

Picture yourself watching the waves at the beach. A big wave crashes onto the sand—that’s your main trend. But before the next big one rolls in, you see the water pull back toward the ocean. That’s the retracement.
This pullback is a completely natural and healthy part of the ocean's rhythm. In trading, this "receding water" is golden. It gives traders who missed the initial move a chance to jump in at a much better price.
This temporary dip is not a red flag that the trend is over. It's just a short-term counter-move, usually fueled by a bit of profit-taking. It’s absolutely critical to tell this apart from a reversal, which is a major change in the market's direction.
Understanding retracements is a core part of technical analysis in trading because they help you pinpoint smart entry points to ride the bigger trend.
A retracement is simply the market pausing for breath. It's a temporary interruption in the primary trend, not a change in its long-term direction. Understanding this difference is the first step toward trading with the trend, not against it.
Retracement vs Reversal
Mixing up a retracement with a reversal is one of the most common—and expensive—mistakes a trader can make. One is a brief price correction, but the other signals a deep, long-term shift in market psychology and direction.
Knowing the difference is everything when it comes to managing your risk and placing successful trades.
At its core, a retracement keeps the market structure intact (think higher highs and higher lows in an uptrend). A reversal, on the other hand, shatters that structure completely.
This table gives you a quick rundown of the key distinctions.
Retracement vs Reversal Key Differences
| Characteristic | Retracement | Reversal |
|---|---|---|
| Duration | Temporary and short-lived | Long-term and sustained |
| Price Movement | Moves against the primary trend | Completely changes the primary trend |
| Underlying Cause | Minor profit-taking or consolidation | A fundamental shift in market psychology |
| Outcome | The original trend is expected to resume | A new trend begins in the opposite direction |
So, while they might look similar in the heat of the moment, their causes and outcomes couldn't be more different. One is a pause; the other is a full stop and a U-turn.
Understanding the Market's Natural Rhythm
To really get what a retracement in trading is, you first have to understand what drives the market: human psychology. A healthy, trending market never moves in a straight line. It’s more like the tide, an ebb and flow of buying and selling. Retracements are the natural heartbeat of that rhythm.
Picture a stock that’s been on a tear, rallying hard for days. The traders who got in early are sitting on some nice profits. What’s the natural thing for them to do? They start selling to lock in those gains. This sudden wave of selling puts temporary pressure on the price, causing it to dip.
But this dip isn’t a sign of trouble. It’s actually a vital part of a healthy trend.
The Psychology of Pullbacks
This profit-taking creates a window of opportunity. All the traders who missed the initial move up are now watching from the sidelines, kicking themselves. When they see the price pull back, they see it as a discount—a second chance to jump on board. As these new buyers step in, their demand quickly overwhelms the early sellers, and the price starts climbing again, resuming the original trend.
This cycle of profit-taking followed by new buying is what gives a trend its staying power.
A retracement is just a temporary imbalance in the market. Early winners cash out, creating a small dip. This dip then attracts fresh money from sideline buyers, which ultimately gives the trend more fuel to continue.
This constant push-and-pull creates "price memory" zones on the chart where the market has reacted before. These areas become critical support and resistance levels that experienced traders watch like a hawk. You can learn more about how to spot these key zones by understanding the role of resistance and support in stocks.
In short, a retracement does two crucial jobs for a trend:
- It relieves pressure: It lets the market breathe and digest the recent gains, preventing it from getting too frothy and collapsing.
- It attracts new blood: The lower prices pull in fresh buyers, providing the necessary fuel for the next leg up.
When you start looking at retracements through this lens, you stop seeing them as threats. Instead, you see them for what they are: logical and predictable opportunities to join a strong, established trend. This mindset is the key to anticipating these moves without cluttering your charts with lagging indicators.
How to Identify Retracements with Price Action
Let's forget about indicators and fancy algorithms for a minute. The most effective way to spot a retracement is to simply learn how to read the story the market is telling you through its price movements. This is called price action analysis, and it lets you pinpoint potential pullbacks using nothing but a clean chart.
The first thing you need to do is confirm you're actually in a healthy, established trend. A strong uptrend isn't just a line going up; it’s a clear pattern of higher highs and higher lows. A downtrend is the opposite, printing a series of lower lows and lower highs. As long as that structure holds, any move against the trend is likely just a temporary breather.
Once you’ve confirmed the trend, the real art is in spotting the market’s "footprints"—those key zones where the price has reacted before. These aren't random spots. They are critical areas of supply and demand where buying or selling pressure has historically shown up in force. To really get a grip on this, check out our guide on how to read price action and build a solid foundation.
Pinpointing Supply and Demand Zones
Supply and demand zones are the battlegrounds where the war between buyers and sellers is won or lost. In an uptrend, for example, a previous peak that once acted as a ceiling (resistance) will often flip to become a new floor (support). When the price pulls back to test this old peak, that's a high-probability area to watch for the retracement to end and the trend to resume.
Think of it like price memory. The market remembers where the big fights happened, and it tends to react at those same levels again. Your job is to mark these horizontal zones on your chart and patiently wait for the price to come back to them. This is where you can see the market’s natural rhythm play out.
This simple infographic shows you exactly how that three-step rhythm works.
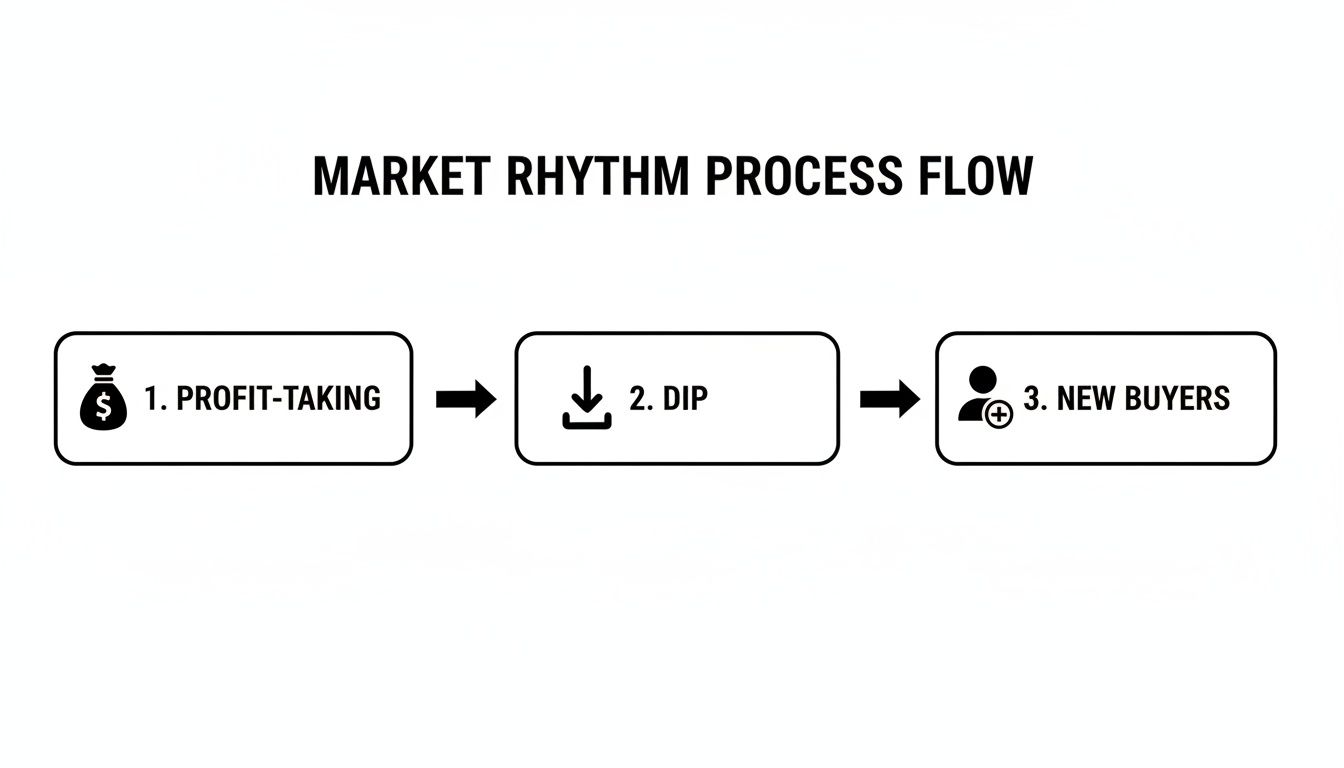
As you can see, the initial profit-taking from early buyers creates the dip. This dip then looks like a bargain to new buyers, who jump in and provide the fuel for the next leg up.
Watching for Candlestick Confirmation
Finding a key zone is only half the job. The final piece of the puzzle is waiting for a clear signal that the sellers are running out of steam and the buyers are wrestling back control. This is where candlestick patterns become your best friend, giving you a visual confirmation of the shift in momentum.
Keep an eye out for these specific patterns right at your supply or demand zone:
- Pin Bars (or Hammers): These candles have long lower wicks, showing that sellers tried to force the price down but were overwhelmed by buyers who pushed it right back up to close near the high. It's a classic rejection signal.
- Engulfing Candles: A bullish engulfing pattern happens when a big green candle completely swallows the previous small red candle. This is a very powerful sign that buying pressure has taken over with authority.
Key Takeaway: A good retracement trade isn't just about where the price goes, but how it behaves when it gets there. The combination of a key price zone and a confirming candlestick pattern is a powerful one-two punch for finding high-probability entries.
These patterns are your signal that the pullback is likely finished and the dominant trend is ready to get going again. By combining trend structure, key zones, and candlestick confirmation, you build a robust, indicator-free method for trading retracements.
Using Common Retracement Levels As A Guide
When you’re watching price carve its path, you’ll notice pullbacks rarely end on a whim. Instead, they tend to pause around familiar percentage marks of the prior swing. These markers aren’t mystical—but they do offer a reliable framework for where a retracement may stall.
Enter Fibonacci retracement levels. Imagine drawing horizontal lines across a canyon wall—price often finds footing or resistance on those ledges. They’re not hard buy or sell signals, but they act as high-probability zones of interest, where market psychology can shift gears.
Once you understand what is a retracement in trading, these levels become your alert system. They simply flag the spots where your pure price-action tools should be on high alert.
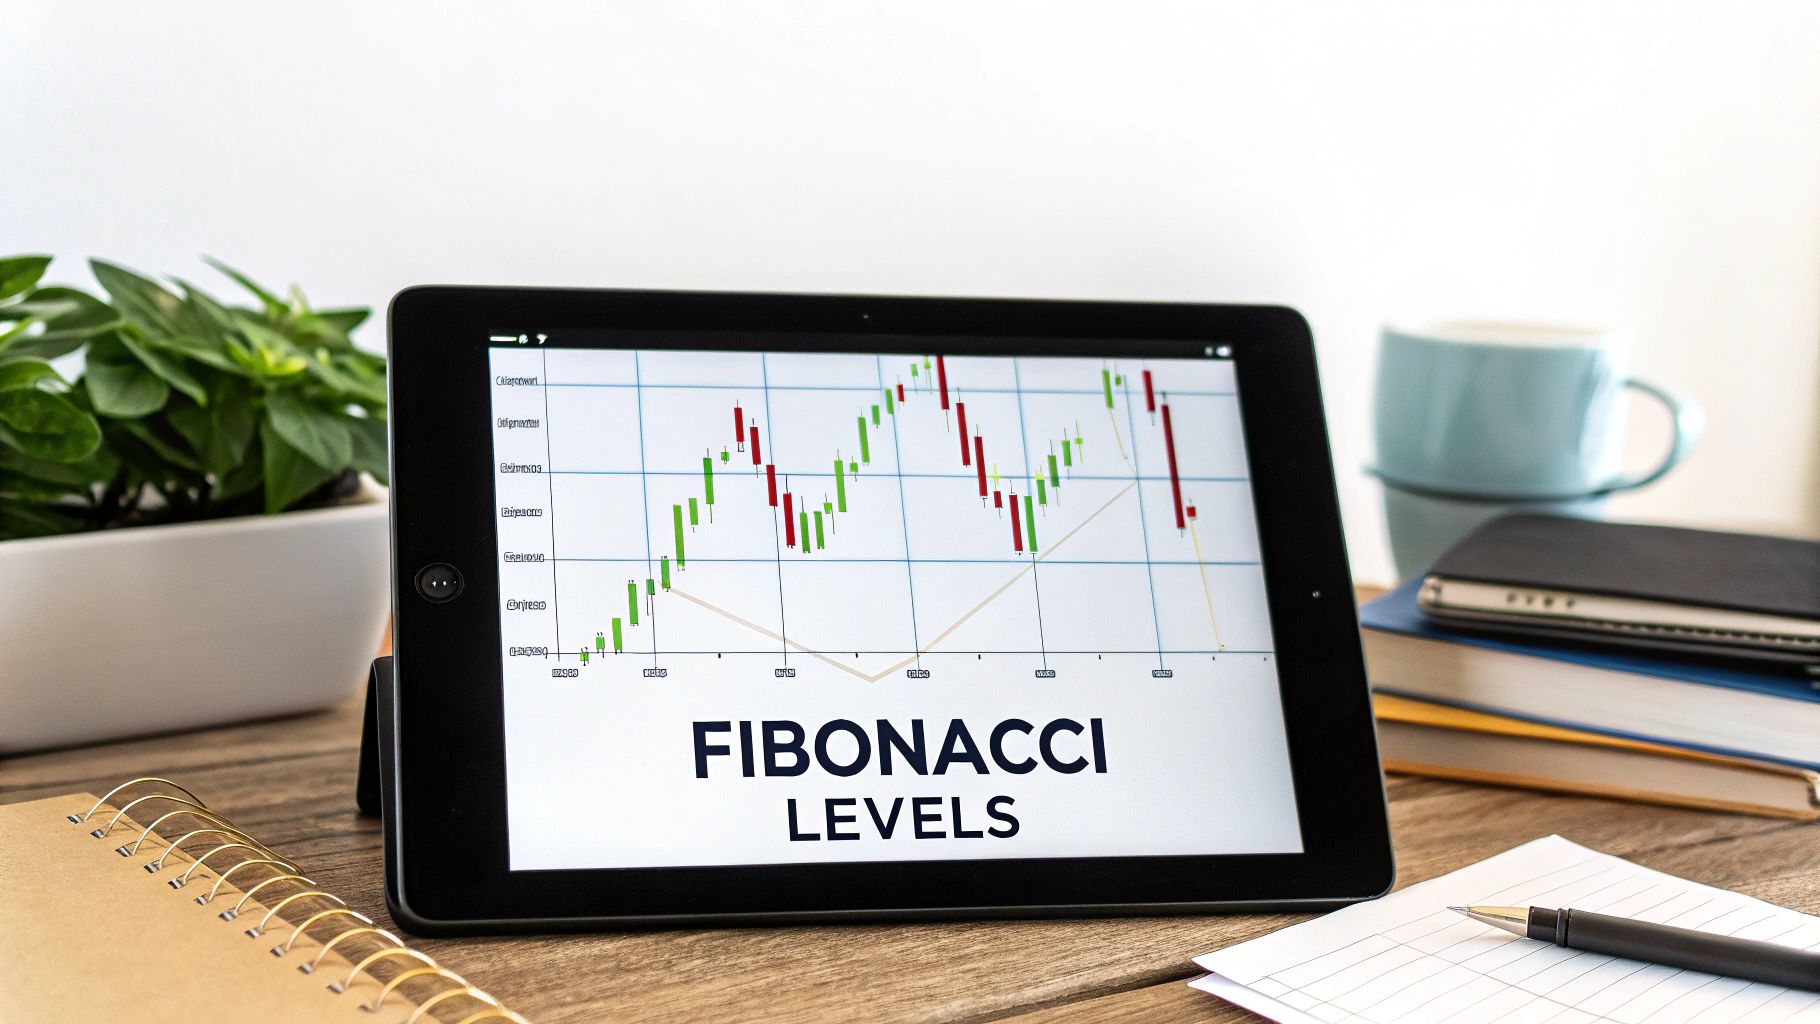
The Key Fibonacci Retracement Levels
The most watched Fibonacci lines come from a sequence that shows up all over nature—and, as it happens, in markets too. On every charting platform you’ll typically see:
-
38.2%: Often the first soft landing in a fast, healthy trend. A shallow pullback here usually signals strong momentum behind the move.
-
50%: Not a true Fibonacci number, yet traders treat the halfway point like a psychological battleground.
-
61.8%: Dubbed the Golden Ratio, this level frequently represents the last support before a trend resumes full force.
Important: These aren’t brick walls. They’re zones where a reaction is more likely. The real edge comes when you combine them with your supply and demand areas.
When a Fibonacci line overlaps a previous support or resistance zone, that alignment is called confluence—a powerful clue that the market will react there.
Fibonacci Levels In Action
History has a way of repeating itself—and Fibonacci levels often guide those patterns:
-
After the 2009 financial crisis, the S&P 500 climbed from 666 to 1,565, then retraced to the 38.2% level before charging higher.
-
Backtests in strong uptrends show a bounce off the 61.8% retracement in over 65% of cases.
Knowing these tendencies is one thing. Applying them with precision is another. For a clear, step-by-step walkthrough, check out how to draw a Fibonacci retracement. Adding this simple tool to your price-action toolkit will give you an extra layer of confidence when spotting the next trend continuation.
Practical Strategies for Trading Retracements
Spotting a retracement is one thing, but actually making money from it requires a clear, repeatable plan. A solid strategy isn't just about clicking "buy"—it's about knowing exactly where you'll get out if you're wrong and how you'll manage your risk from start to finish.
Let's break down two powerful entry techniques. One is built for traders with a higher risk tolerance, and the other is for those who prefer to wait for more certainty. Both methods are grounded in the price action principles we've already covered, making sure you have a logical reason for every single move.
Of course, beyond the basics, many traders layer on more sophisticated approaches. For instance, incorporating insights from advanced trading strategies, such as those discussed in stablecoin vault reports, can add another dimension to timing your entries and exits.
The Aggressive Entry Strategy
This approach is for traders who are confident in their analysis of a key support or demand zone and are ready to act decisively. The main goal here is to snag the best possible entry price, which in turn maximizes your potential profit.
- Identify a Strong Zone: First things first, you need to pinpoint a high-probability support level. This could be a previous swing high that's now flipped to support, or a clear demand zone where buyers previously rushed in with force.
- Place a Limit Order: Instead of waiting around for the price to react, you place a buy limit order right at the top edge of this zone.
- Set Your Stop-Loss: Your protective stop-loss goes just below the zone. The logic is simple: if the zone breaks, your trade idea is busted, and you take a small, controlled loss.
Risk Management: The huge advantage here is a fantastic risk-to-reward ratio. By getting in early, your stop-loss is much tighter. This means your potential reward can be significantly larger compared to the amount you're risking.
The Conservative Entry Strategy
If you're the type of trader who needs to see the market prove you right before putting capital on the line, this method is for you. It's all about waiting for clear confirmation that the buyers are really back in control. This tends to increase your win rate, but it comes at the cost of a slightly less perfect entry price.
- Identify the Zone: Just like the aggressive method, you start by marking a critical support or demand zone on your chart.
- Wait for Confirmation: Here's the key difference—you do not enter right away. You have to be patient and wait for the price to dip into the zone and print a clear bullish candlestick pattern. Think of a strong pin bar or a bullish engulfing candle.
- Enter on Confirmation: You only pull the trigger and enter the trade after this confirmation candle has officially closed.
- Set Your Stop-Loss: The stop-loss is placed just a few pips below the low of that confirmation candle.
A classic example of this played out in the Nasdaq 100 during the 2020 recovery. The index pulled back to a key 38.2% Fibonacci level, held its ground with strong buying confirmation, and then kicked off a massive rally. History shows that when these retracement levels line up with strong demand zones, the accuracy of the trade setup can jump substantially.
Common Mistakes to Avoid When Trading Pullbacks
Knowing what not to do is just as critical as knowing what to do. Even the sharpest traders can see a solid plan fall apart by making a few common, unforced errors. Think of these as a pre-flight checklist to run through before you risk any capital.
One of the most expensive mistakes I see is confusing a deep retracement for a full-blown trend reversal. A simple pullback is just the market taking a breather, but a reversal is a fundamental change in direction. If you see price crash through several key support levels like they aren't even there, the trend's foundation is probably cracking.
Another classic error is jumping the gun and entering a trade too early. We’ve all been there. You spot what looks like a perfect pullback into a demand zone and immediately hit the "buy" button, only to watch in horror as the price slices right through it. Patience is a superpower in trading. You must wait for price action to confirm that buyers are actually showing up before you commit.
Setting Stops Too Tight
Finally, a huge number of traders place their stop-loss orders way too close to their entry point. It comes from a good place—wanting to keep risk low—but putting a stop just a few pips below a support zone is like standing too close to a swinging door.
You're just asking to get knocked out. Normal market volatility, that everyday "noise," can easily wick you out of a perfectly good trade moments before it takes off in your favor.
Key Takeaway: A proper stop-loss isn't based on an arbitrary dollar amount you're willing to lose. It should be placed based on market structure, giving the trade room to breathe on the other side of the zone you're trading from.
This gives your trade a technical reason for existing. It ensures you're only stopped out if the market structure that justified the trade in the first place has actually broken down.
History is littered with examples of traders mistaking reversals for pullbacks. During the Dot-com bust, many saw the Nasdaq's initial drops as fantastic buying opportunities. In reality, they were the first signs of an 80% collapse. Even after the market bottomed, it only retraced 38.2% of the fall before a new bull market began, showing just how powerful these levels can be. If you want to dive deeper into how these levels are calculated, you can read a full guide on Fibonacci retracements on Zebpay.com.
Got Questions About Trading Retracements?
I get it. When you're learning to trade price action, a lot of questions pop up. Let's tackle some of the most common ones I hear from traders.
How Long Does a Retracement Typically Last?
This is the million-dollar question, and the honest answer is: there's no set time limit. A retracement's lifespan depends entirely on the timeframe you're watching and the market's current mood.
It could be over in just a few candles on a 1-hour chart, or it might drag on for several weeks on a daily chart.
The key isn't to time it with a stopwatch. Instead, you need to watch the price action for clues that the pullback is losing steam and the original trend is ready to take over again.
Can I Trade Retracements Without Fibonacci Levels?
Absolutely. In fact, many professional traders I know barely use them. While Fibonacci levels can be a handy guide, the real skill is in reading the chart's structure—identifying solid horizontal support and resistance zones.
Price action analysis at these key supply and demand zones is far more powerful than any magic percentage level. A clean pin bar rejecting a clear support level tells you more than a dozen indicators combined.
What Is the Difference Between a Retracement and Consolidation?
This is a crucial distinction. Both are pauses in a trend, but they look very different on the chart. Think of it this way:
- Retracement: This is an orderly pullback against the main trend. During a strong uptrend, for example, the price takes a breather and moves down temporarily before continuing higher. It's a directional move.
- Consolidation: This is when the price just goes sideways, chopping around in a tight range. There's no clear direction up or down; the market is coiling up, like a spring, but it's not actually pulling back.
So, a retracement is a clear counter-trend move, while consolidation is more of a directionless pause.
Ready to stop relying on indicators and master the art of price action? At Colibri Trader, we teach you the skills to read the market and trade with confidence. Take our free Trading Potential Quiz today!