


Wedge Pattern Trading: Master Breakouts and Risk Control
Wedge patterns show up when two converging trendlines squeeze the price action, signaling that the market is consolidating before its next big move. These formations, which we call rising and falling wedges, offer some fantastic clues about market sentiment and often precede major price reversals or continuations.
Why Wedge Patterns Are a Trader's Best Friend
These patterns are so much more than just a couple of angled lines on a chart. They tell a story about the ongoing tug-of-war between buyers and sellers. I like to think of them as a visual map of market psychology, showing a temporary truce before one side finally gets exhausted and the other takes over.
At their core, wedges signal a loss of momentum. The price gets squeezed into a tighter and tighter range, which is almost always a precursor to a powerful move. It's this coiling-up phase that makes wedge pattern trading so appealing—it gives us really clear entry, stop, and target levels.
The Psychology Behind Wedges
A rising wedge usually forms during an uptrend. You'll see the price making higher highs and higher lows, but the trendlines start to converge. This tells you that the buyers are struggling to push the price up with the same force they had before. Each new high is less impressive than the last, signaling that the buying pressure is fading. This is often the calm before the storm of a bearish reversal.
On the flip side, a falling wedge tends to appear in a downtrend. The price is still making lower lows and lower highs, but you'll notice the downward momentum is slowing down. This suggests that sellers are losing conviction and buyers are starting to sniff around for a bargain. It’s a classic sign that an asset might be bottoming out before a bullish breakout.
A key insight I've learned over the years is that the longer a wedge takes to form, the more explosive the potential breakout. A pattern developing over several weeks on a daily chart carries a lot more weight than one that forms in just a few hours.
Research actually backs up the reliability of these patterns, especially when you consider the broader market context. For instance, some in-depth analysis shows that in bear markets, rising wedges have an 81% success rate for predicting bearish breakouts. That makes them an incredibly powerful tool in a trader's arsenal. You can read the full analysis on wedge pattern performance to dig into the numbers.
To trade them effectively, you first have to know exactly what you're looking at.
Rising Wedge vs Falling Wedge Key Differences
To help you tell them apart at a glance, here’s a quick breakdown of the defining features of rising and falling wedges.
| Characteristic | Rising Wedge | Falling Wedge |
|---|---|---|
| Appearance | Slants upward with converging trendlines | Slants downward with converging trendlines |
| Typical Signal | Bearish (Reversal or Continuation) | Bullish (Reversal or Continuation) |
| Market Psychology | Buyers are losing momentum and becoming exhausted | Sellers are losing momentum and becoming exhausted |
| Volume Trend | Volume tends to decrease as the pattern forms | Volume tends to decrease as the pattern forms |
| Breakout Direction | Typically breaks to the downside | Typically breaks to the upside |
Getting comfortable with these differences is the first step to spotting these setups on your own charts and building a strategy around them.
How to Spot and Draw Wedges Like a Pro
Moving from theory to a live chart is where the real skill in trading wedges is built. It’s one thing to see a perfect example in a textbook, but quite another to spot one forming in real-time. This is a hands-on process that gets easier with practice, whether you're looking at forex pairs like EUR/USD or stocks like AAPL.
The core task is to connect the dots—literally. To draw a valid wedge, you need to find at least two reaction highs and two reaction lows that are squeezing closer together. Think of it as outlining a narrowing path that the price is being forced into. These touches don't have to be perfect to the pip, but they absolutely must form clear, sloping boundaries.
Precision here is key. This all comes down to drawing solid trendlines, which is the foundation for spotting almost any chart pattern. If you're shaky on that, our guide on how to draw trendlines is the perfect place to start.
The Art of Connecting Highs and Lows
For a rising wedge, you'll draw an upper resistance line connecting the swing highs and a lower support line connecting the swing lows. Both lines will slant upwards, but the critical detail is that the lower line (support) is steeper. This visual compression is a massive clue that buying pressure is getting exhausted.
Conversely, a falling wedge requires connecting lower highs and lower lows. Here, both trendlines will point down, but the upper line (resistance) will be steeper than the support line. This tells us that selling momentum is fizzling out, and buyers are starting to step in at slightly higher prices.
A simple checklist can keep you from seeing patterns that aren't really there:
- Connect at least two swing highs with a trendline.
- Connect at least two swing lows with another trendline.
- Confirm the lines are converging toward each other.
- Check that both lines point in the same direction (up for rising, down for falling).
This structured approach is your best defense against wishful chart-reading.
The Crucial Role of Declining Volume
Drawing the lines is only half the story. The single most important confirmation signal I look for is declining volume as the wedge develops. Think of it as the market taking a deep breath before making a big move.
As the price gets squeezed and the trading range tightens, activity usually dies down. This quiet period points to indecision—a temporary truce between buyers and sellers. It’s powerful evidence suggesting that the dominant force (buyers in a rising wedge or sellers in a falling one) is running out of gas. This is a classic technical analysis concept that sets the stage for a powerful reversal when the other side finally takes control. You can dig deeper into these visual cues in this article from Investopedia.
When I see a perfectly formed wedge with steadily declining volume, my confidence in the potential trade skyrockets. It's the market's way of telling you that a breakout is not just possible, but probable. Ignoring volume is one of the biggest mistakes traders make.
The moment the price breaks out of the wedge, you should see a significant spike in volume. This is your confirmation that the truce is over and a new directional move has begun with conviction. This combination of pattern and volume is what separates amateur chart-watchers from professional traders.
Executing Your Trade with Confidence
Spotting a perfectly formed wedge is a great feeling, but it’s the execution that turns that beautiful pattern into profit. If you hesitate at this critical moment, you can easily miss the whole move. That's why having a clear, confident plan before the breakout is non-negotiable.
This is where we bridge the gap between analysis and action, focusing on timing your entry and, just as importantly, protecting your capital from the get-go.
Confirming a real breakout is more than just seeing the price poke through a trendline. A genuine breakout needs a decisive, impulsive move. Look for a strong candle that closes firmly outside the pattern’s boundary. A tiny, weak candle that barely creeps over the line is often a red flag for a potential fakeout.
This confirmation process is crucial. For a rising wedge, the breakout is validated when the price closes below the lower support trendline. Conversely, for a falling wedge, the breakout happens when the price closes above the upper resistance line.
Many experienced traders, myself included, often wait for a retest of the broken trendline as a secondary confirmation. This simple act of patience can offer a much better risk-to-reward ratio and helps filter out a lot of those frustrating false signals.
Choosing Your Entry Strategy
Once a breakout looks solid, you have two primary ways to get into the trade. Each has its pros and cons, and your choice will likely come down to your personal trading style and risk tolerance.
-
Enter on the Breakout: This is the more aggressive route. You jump in as soon as a candle closes outside the wedge, aiming to catch the initial wave of momentum. The big advantage here is that you won’t get left behind if the price explodes and never looks back.
-
Wait for the Retest: This is a more conservative and patient strategy. After the initial breakout, you wait for the price to pull back and "retest" the trendline it just broke. This line now acts as new support or resistance. This often gives you a more favorable entry price and lets you set a tighter stop-loss, which really improves your risk-reward profile.
A key piece of the puzzle in wedge pattern trading is volume. A true breakout should ideally be accompanied by a significant spike in trading volume. This surge tells you there’s strong conviction from the market, adding another layer of confidence to your trade. If you want to dive deeper into this, check out our guide on how to trade breakouts.
This little infographic breaks down the initial process: connect the highs, connect the lows, then check the volume. Simple but effective.
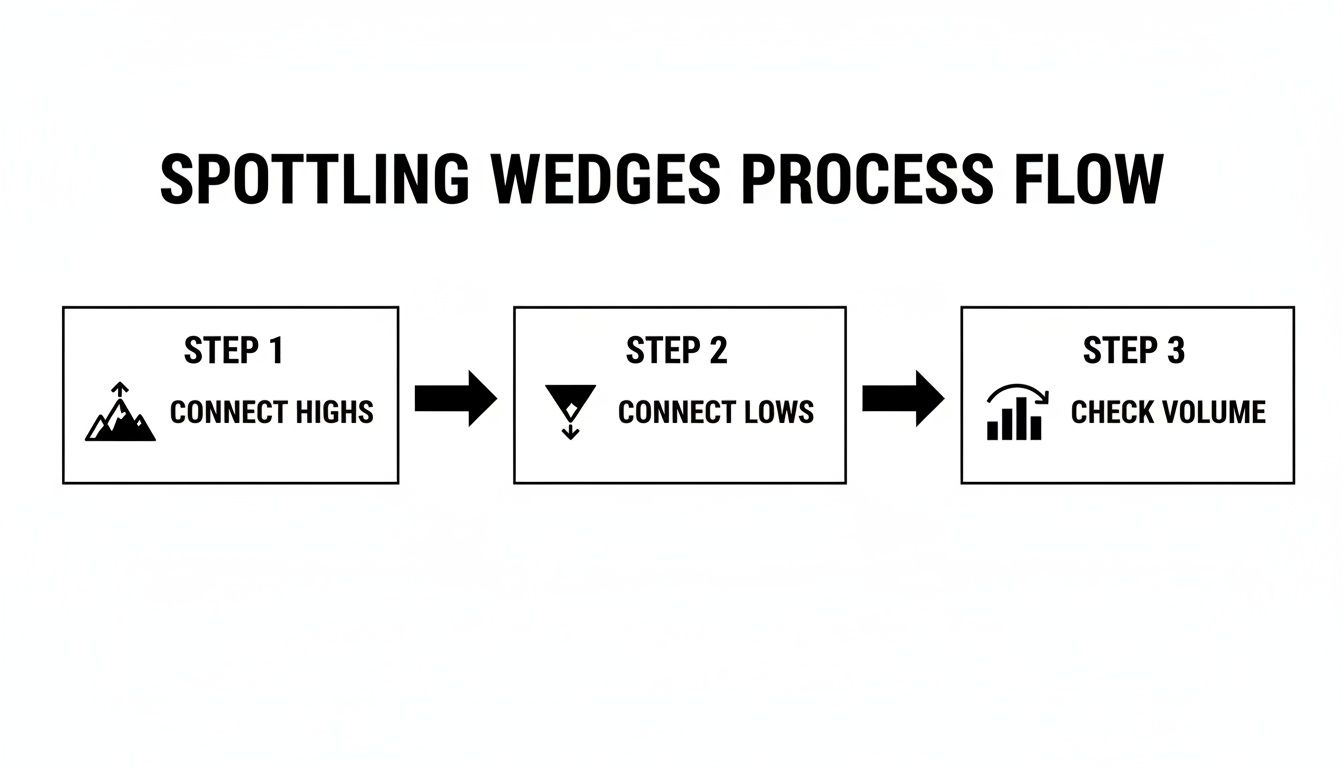
It really emphasizes that spotting the pattern and confirming it with volume are inseparable steps if you're looking for a high-probability setup.
Setting an Intelligent Stop-Loss
Your stop-loss is your safety net, and placing it correctly is absolutely vital. A common and effective method is to place your stop just outside the opposite side of the wedge.
Pro Tip: Never place your stop-loss right on the trendline. Always give it some breathing room to account for market noise and volatility. A stop placed too tightly is an easy target for a quick stop-hunt before the real move even begins.
Here’s a practical approach:
- For a Falling Wedge (Bullish Breakout): Place your stop-loss just below the last swing low created inside the wedge.
- For a Rising Wedge (Bearish Breakout): Position your stop-loss just above the last swing high made within the pattern.
This placement ensures your trade is only closed if the market makes a move that fundamentally invalidates the entire wedge pattern setup.
Setting Realistic Profit Targets for Your Trades
A great entry is only half the battle. I've seen countless traders nail the entry, only to give back all their profits (and then some) because they didn't have a clear exit plan. This is where the real art of trading comes in.
Knowing precisely when to take your profits off the table is a skill that separates the pros from the rest. Without a profit target, you're just gambling. You'll either get nervous and close out too early, leaving a ton of money on the table, or you'll get greedy and watch a beautiful winner turn into a painful loser.
Let's walk through how to set these targets logically, so you can exit your trades with the same confidence you had when you entered them.
The Classic Measurement Technique
The most common and, frankly, one of the most reliable ways to set a profit target for a wedge pattern is what we call the measurement technique. It's straightforward, objective, and helps kill the emotional guesswork that plagues so many traders.
The idea is beautifully simple: the breakout move will often travel a distance that’s about the same as the height of the wedge at its widest point. All you do is project that distance from the breakout point.
Here's how you do it:
- Find the Widest Part: Look at where the wedge pattern began. Measure the vertical distance from the very first swing high to the first swing low. That's your height.
- Project from the Breakout: Take that distance and project it from the exact price where the breakout occurs. For a falling wedge breakout, you add it. For a rising wedge breakdown, you subtract it.
So, if a falling wedge is 200 pips tall at its start and the price breaks out at 1.2500, your target is right around 1.2700. This gives you a concrete, measurable goal for the trade. You can see more examples of this in action over at BabyPips.com.
A word of caution: treat this target as a high-probability zone, not an unbreakable law. It’s where the initial momentum from the breakout might start to run out of steam. Always be ready to react to what the market is telling you now.
Don't Forget Support and Resistance
While the measurement technique is great for a primary target, never, ever ignore the market structure around you. Major support and resistance (S/R) levels are like gravity for price. Sometimes, you'll get lucky and a huge S/R zone lines up perfectly with your measured target. That's a fantastic confirmation.
More often, though, you might find a major resistance level sitting just below your measured target. What do you do? I'll tell you what I do: I set my take-profit just under that resistance. It makes absolutely no sense to risk the entire trade for an extra 10 pips, just to see it slam into a price ceiling that has rejected the market three times before.
Before you even think about entering a trade, map out these key horizontal levels. They are your roadmap.
Add a Layer of Precision with Fibonacci Extensions
For those of us who like another layer of confluence, Fibonacci extension tools are fantastic for pinpointing potential secondary or tertiary profit zones.
Once you have a confirmed breakout, you can draw your Fibonacci tool. Start from the beginning of the final swing inside the wedge, go to the end of it, and then bring it back to the breakout point. This will give you key extension levels—I pay close attention to the 127.2% and 161.8% levels, as these are common spots for a trending move to pause or reverse.
When you combine these methods, you build a much more robust exit strategy:
- Target 1: The measured move from the wedge's height.
- Target 2: A major historical support or resistance level.
- Target 3: A key Fibonacci extension level like the 1.618.
This multi-target approach allows you to scale out of your position. You can take some profits off the table at Target 1, move your stop to breakeven, and let the rest run. This tactic can do wonders for your overall risk-reward ratio and your trading psychology. Plan your exit with the same care you plan your entry, and you'll be miles ahead of the game.
Common Mistakes to Sidestep

Look, every trader makes mistakes. It’s part of the game. But the ones who stick around learn to sidestep the same old traps that catch everyone else. Knowing these common pitfalls in wedge pattern trading is half the battle won—it'll protect your capital and save you a ton of frustration.
Let's get right into the frequent errors I see traders make time and time again. A huge one is simply reading the pattern backward. They see a rising wedge sloping up and assume it's bullish, but it's typically a bearish reversal signal. Another classic blunder is failing to wait for a confirmed breakout, which means you end up getting chopped up by fakeouts.
Good wedge trading comes down to patience and discipline. It's about filtering out the weak setups and waiting for the A+ opportunities. You can get more background on the mechanics from this wedge patterns article on Investopedia.
Jumping the Gun Before a Breakout
Impatience is a trader's absolute worst enemy. I've been there. You spot what looks like a perfect wedge forming, and every bone in your body is screaming to get in before the big move happens so you don't miss it. This is called front-running, and it’s a quick way to lose money.
When you enter before a confirmed breakout, you’re completely exposed. The price could just keep grinding inside the wedge for hours, or worse, break out in the exact opposite direction you expected. Always, always wait for a candle to close decisively outside the trendline. That simple act of patience is what separates professional traders from gamblers.
Ignoring the Volume Signal
Trading a wedge without looking at volume is like trying to drive a car with no fuel gauge. You might be pointing in the right direction, but you have no idea if there's any real power to get you there.
As a wedge pattern forms, volume should ideally dry up, showing that the market is consolidating and coiling up. The moment the price breaks out, you must see a significant spike in volume. That surge is your confirmation that big players are stepping in with conviction.
A breakout on weak, pathetic volume is a massive red flag. It tells you there's no real interest behind the move, dramatically increasing the odds of a "fakeout" where the price snaps right back inside the pattern.
Think of it like a three-legged stool: Pattern + Price Action + Volume = High-Probability Trade. If you take away any one of those legs, the whole setup becomes wobbly. Don't take the trade until all three align perfectly.
Trading Wedges in a Vacuum
Context is king in the markets. A falling wedge might be a textbook bullish pattern, but its probability of success goes through the roof if it forms during a pullback within a larger, established uptrend. That's a classic continuation play—the wedge is just the market taking a breather before the next leg up.
On the flip side, a rising wedge that appears right at a major resistance level within a broader downtrend is a much stronger bearish signal. You're not just trading the pattern; you're trading the pattern at a key location where sellers are already likely to step in.
By always zooming out and considering the bigger picture, you put the primary market momentum on your side. This one habit alone can dramatically boost your win rate with wedges.
Frequently Asked Questions
Even with a solid game plan, you're bound to have questions when you start putting this stuff to work in a live market. Let's walk through some of the most common ones I hear about trading wedges to get you on solid ground.
How Reliable Are Wedge Patterns Really?
This is a great question. On their own, wedge patterns are what I'd call moderately reliable. But their real power—their predictive edge—comes alive when you start combining them with other market signals. Think about it: a rising wedge appearing in an already confirmed bear market? That's a much higher probability setup.
To really dial in the reliability, you absolutely need to see confirming volume on the breakout. It’s also a huge help to trade in the direction of the bigger, dominant market trend. See the pattern as a powerful piece of evidence, not a standalone guarantee.
The key is context. A falling wedge is a good signal. But a falling wedge at a major support level, after a clear downtrend, with declining volume during its formation and a high-volume breakout? That's an A+ setup.
What’s the Difference Between a Wedge and a Triangle?
It's a subtle but crucial difference, and it all comes down to the slope of the trendlines.
With a wedge pattern, both the upper and lower trendlines are pointing in the same direction. They are either both slanting up (a rising wedge) or both slanting down (a falling wedge). This tells a story of momentum getting squeezed and losing steam.
Triangle patterns are different. Their trendlines move in opposing directions. An ascending triangle, for instance, has a flat top (resistance) and a rising bottom (support). This structural difference is key because it completely changes how you interpret what the market is trying to do next.
Which Timeframes Are Best for Trading Wedges?
Wedges will show up on pretty much any chart you pull up, from a 15-minute chart all the way to the weekly.
In my experience, though, they carry a lot more weight and tend to be more reliable on higher timeframes like the 4-hour, daily, or weekly charts.
A wedge that takes weeks to form on a daily chart points to a much more significant and potentially explosive price move than one that forms over a few hours. Day traders can definitely trade them on lower timeframes, but you have to be much more nimble and aware of the market 'noise' and false signals that pop up more frequently on those faster charts.
At Colibri Trader, my focus is on teaching you how to read the market's story through pure price action. The courses are built to help you create a profitable trading routine without getting bogged down by confusing indicators. You can discover your trading potential and get started on https://www.colibritrader.com.