


Master Triangle Pattern Trading: Strategies & Tips

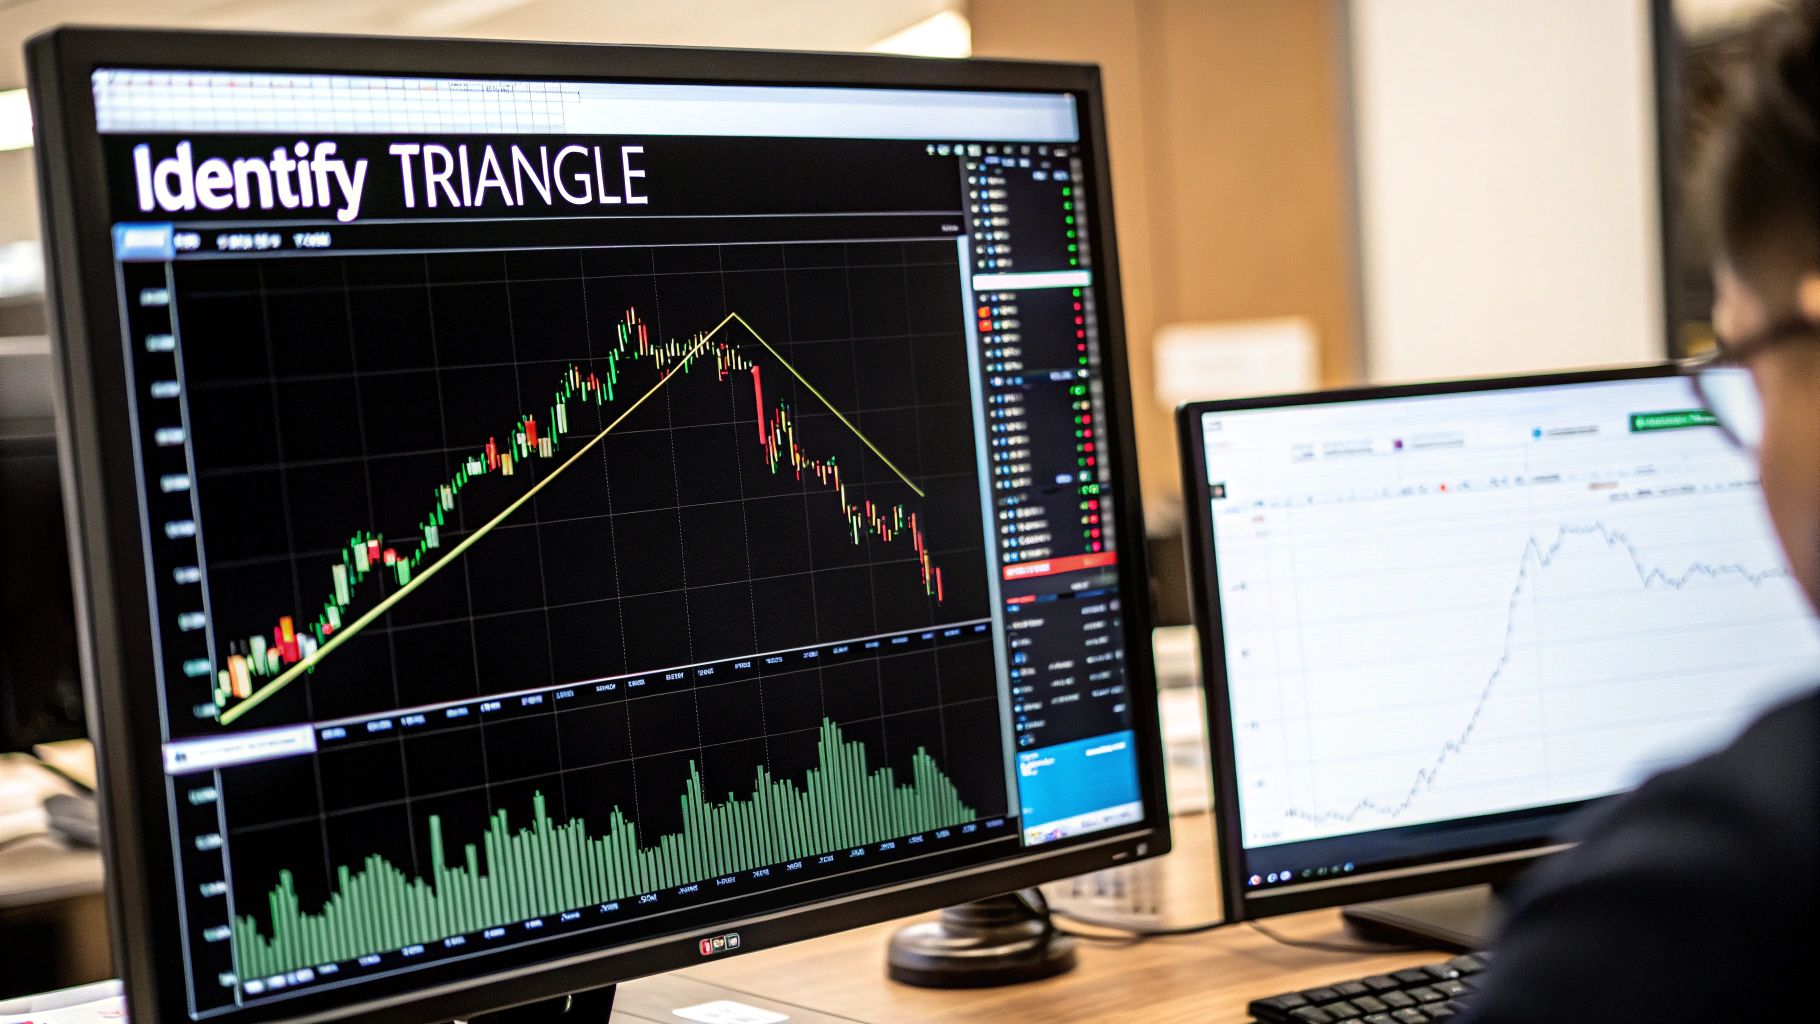
Triangle pattern trading is all about spotting those moments of calm before a potential storm in the market. It’s a classic technical analysis strategy, really. We’re looking for periods where the price consolidates and trendlines start squeezing together, which often signals that a big move—an explosion in price—is just around the corner. The goal is to catch the breakout that follows.
Understanding Triangle Patterns in Trading
Before you even think about placing a trade, you have to get what these patterns are telling you about the market's psychology.
Think of a triangle as a coiled spring. It’s a visual representation of a temporary truce between buyers and sellers. As the price range tightens up during this consolidation, volatility drops, and energy builds up for the next major move.
This tug-of-war is precisely what makes triangle pattern trading so effective. The shape of the pattern itself drops major hints about who’s likely to win the fight. Learning to read these clues can give you a serious edge in timing your entries and exits.
The Three Core Triangle Types
This whole strategy boils down to three distinct formations, and each one tells a different story about market sentiment. Nailing the identification part is the first critical step toward building a solid trading plan.
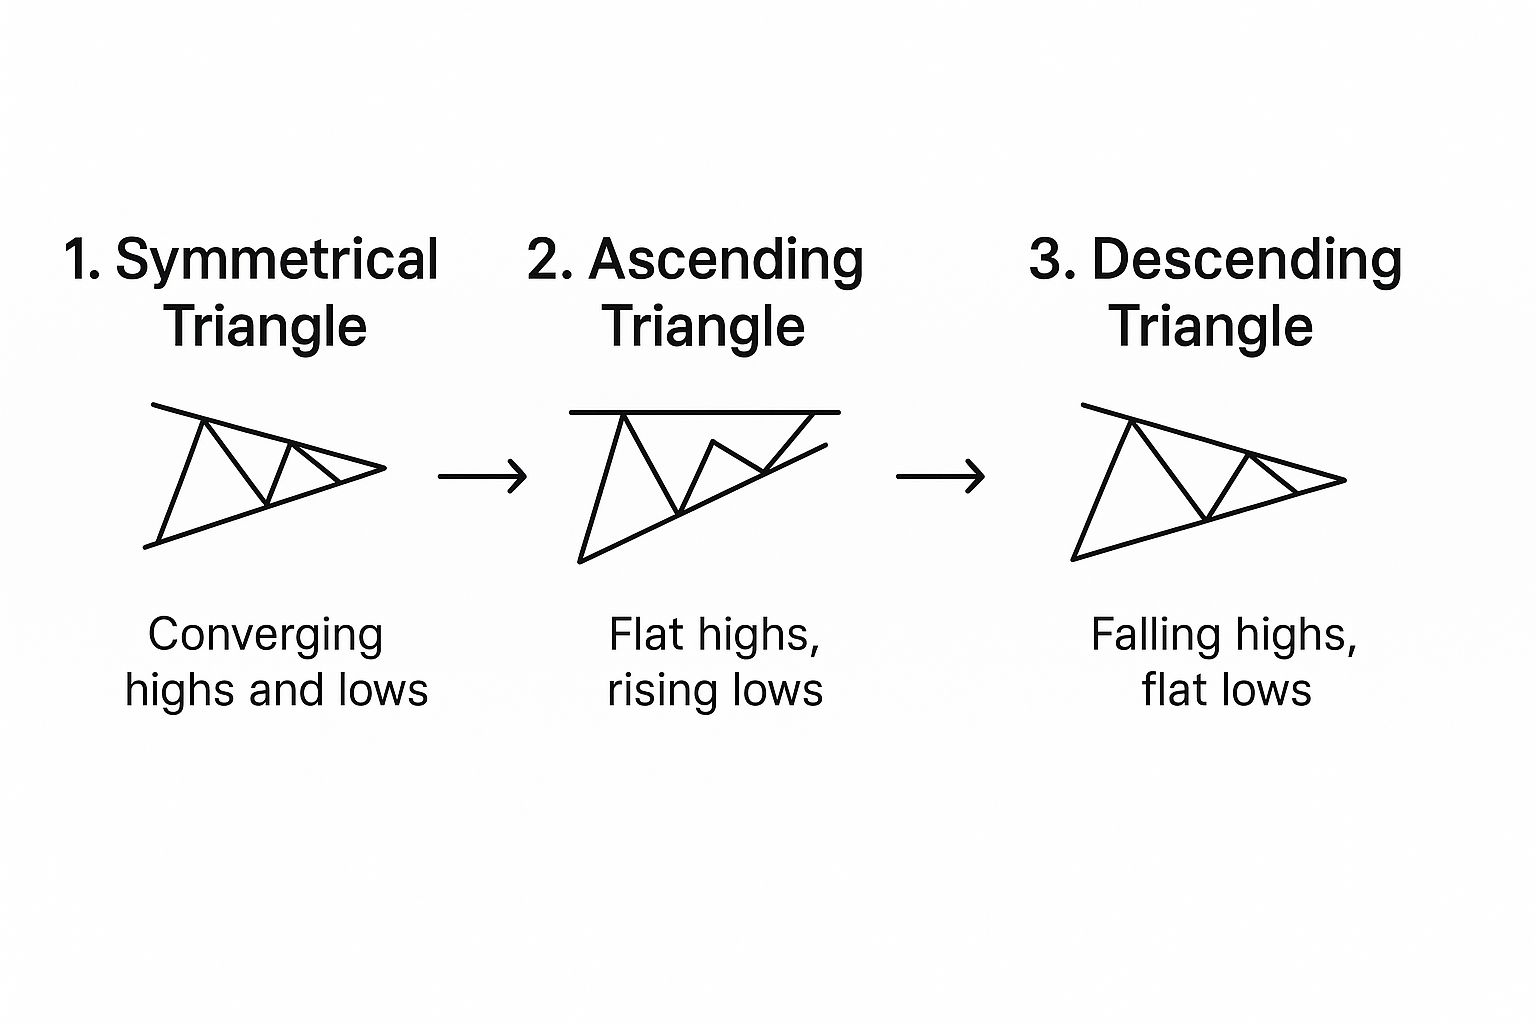
- Ascending Triangle: This pattern forms with a flat, horizontal resistance level on top and a rising lower trendline (a series of higher lows). It tells you that buyers are getting more aggressive, willing to step in at higher prices, while sellers are stubbornly holding the line at a specific level. This is generally a bullish sign.
- Descending Triangle: This is the mirror image of the ascending triangle. You’ll see a flat support level on the bottom with a declining upper trendline (lower highs). This setup suggests that sellers are gaining control and pushing prices down, while buyers are only defending a single price point. It’s typically a bearish formation.
- Symmetrical Triangle: In this case, both the upper and lower trendlines are closing in on each other, pointing toward a single apex. This shape signals pure indecision in the market; neither the bulls nor the bears have a clear upper hand. The breakout could go either way, but it often continues the trend that was in place before the triangle formed.
Here's the key takeaway: a triangle pattern isn't complete—and isn't a trade signal—until the price actually breaks through one of the trendlines. Until that happens, it's just consolidation.
Drawing these trendlines correctly is everything. Accurate lines are the foundation of your entire analysis. If you're serious about price action trading, learning how to draw trend lines the right way is a skill you absolutely must master.
Quick Guide to Triangle Pattern Characteristics
To help you quickly tell these patterns apart, I've put together a simple reference table. It's a great cheat sheet for spotting the key features at a glance when you're analyzing a chart.
| Pattern Type | Indication | Breakout Tendency | Key Feature |
|---|---|---|---|
| Ascending Triangle | Building Bullish Pressure | Upward Breakout | Flat Top, Rising Bottom |
| Descending Triangle | Increasing Bearish Pressure | Downward Breakout | Flat Bottom, Falling Top |
| Symmetrical Triangle | Indecision / Consolidation | Either Direction | Converging Sloped Lines |
Keep this table handy. When you see prices starting to tighten, a quick check against these characteristics can help you figure out what you're looking at and start planning your next move.
How To Trade The Bullish Ascending Triangle
When buyers start to push prices up but then bump into the same ceiling over and over, an ascending triangle emerges. You’ll spot a flat resistance line above and a rising trendline below that connects higher lows. This shape captures a tug-of-war where bulls are gradually wearing sellers down.
Think of it like steam building in a pressure cooker—at some point, the lid blows off. By the time you see a decisive breakout, the setup has handed you a measurable edge. In this guide, we’ll dive into confirmation tricks, entry tactics, risk control, and targets that respect real-world trading.
This chart highlights where the ascending triangle sits among other consolidation shapes, tracking the shift from market indecision to bullish build-up.
Validating The Ascending Triangle Pattern
Before risking capital, make sure the pattern isn’t a mirage. Aim for at least:
- Two touches on the flat resistance
- Two touches on the ascending support
These points prove the lines matter to market participants rather than random price swings.
Volume should taper off during the setup and then jump at breakout. A sudden surge in buying volume tells you smart money has piled in and pushes the odds in your favor.
A breakout without a preceding, well-defined pattern is just noise. A confirmed triangle signals a strategic entry.
Pinpointing Your Entry And Exit Strategy
At the first clean close above that horizontal resistance, an aggressive entry slingshots you into the action early. But it carries a higher chance of falling victim to a false breakout. By contrast, a conservative entry waits for price to revisit the broken resistance—now turned support—and bounces.
| Entry Style | Pros | Cons |
|---|---|---|
| Aggressive | Early participation | Higher risk of reversal |
| Conservative | Confirmation of breakout | Might miss rapid, gap-up moves |
Every trade needs a stop-loss. For ascending triangles, position it just below the rising support line. That way, if buyers lose their grip, you’re out with a controlled, predefined loss.
Projecting A Realistic Profit Target
Measure the triangle’s maximum height—from the highest resistance point down to the lowest support point. Then project that distance upward from your breakout level.
For example:
- Triangle height = $5
- Breakout occurs at $50
- Target = $55
Using this method frees you from emotional exits and keeps your plan rooted in price structure. From 2015 to 2025, the ascending triangle showed a 68% success rate in major equity markets. Meanwhile, traders who applied disciplined breakout rules saw annualized returns near 64%.
Discover more on breakout trading strategies if you want to deepen your approach.
Trading the Bearish Descending Triangle

When you spot a descending triangle forming on a chart, you're getting a front-row seat to a story of sellers steadily gaining control. This pattern is the mirror image of its bullish cousin, the ascending triangle, and it's a classic warning sign of a potential price breakdown.
The setup is pretty unmistakable. You'll see a flat, horizontal support line that buyers are desperately trying to hold, almost like a line in the sand. At the same time, a downward-sloping trendline is forming overhead, connecting a series of lower highs.
Each of those lower highs tells you something important: sellers are getting more aggressive. They're willing to accept lower and lower prices to get out of their positions. This coiling action, where bearish pressure squeezes against a support level that's getting weaker with every test, often happens right before a sharp drop. The trick is to have your game plan ready before that support finally cracks.
How to Spot a High-Probability Setup
Look, not every pattern that looks like a descending triangle is a grade-A shorting opportunity. A truly high-probability setup has a few distinct characteristics that separate it from just random market noise. Before you even think about putting on a trade, you need to make sure the pattern is legit.
Here's what I always look for on the chart:
- A well-defined horizontal support line: The price needs to have bounced off this exact level at least twice. This proves it's a significant area where demand has stepped in before.
- A clear descending trendline: This line should neatly connect at least two consecutive lower highs. This is your visual proof of increasing selling pressure.
- Decreasing volume: As the pattern develops and the price range gets tighter, trading volume should ideally be drying up. This is a classic sign of consolidation before a big, decisive move.
That drop in volume is a subtle but incredibly important clue. It suggests the market is taking a breather, almost like it's gathering energy for the breakdown. When that support level finally gives way, a big spike in selling volume is the final confirmation you've been waiting for.
The descending triangle is a visual representation of a battle between weakening buyers and strengthening sellers. The flat support is the buyers' last stand, and the lower highs show the sellers are methodically gaining ground.
Executing the Trade: Entry and Risk Management
Once that support level breaks, you have to be ready to move. A common entry strategy is to place a short order as soon as you see a decisive candle close below the horizontal support line. This is a more aggressive entry, designed to get you in on the action as early as possible.
If you're more conservative, there's another way. You can wait for the price to break support and then rally back up to retest it from below. If that old support level now acts as new resistance and the price gets rejected, it gives you a second, often more reliable, entry point to go short.
Now for the most critical part: your stop-loss. A logical spot for your protective stop is just above the descending trendline. Placing it here means that if the bearish move fails and buyers suddenly rush back in, you'll be taken out of the trade with a small, manageable loss. Never, ever trade a breakout without knowing exactly where you'll get out if you're wrong.
Setting Realistic Profit Targets
To take the emotion out of your exit, you can use the pattern itself to calculate a logical profit target. This gives you a data-driven objective for the trade, so you're not just guessing when to take profits.
The process is simple:
- Measure the Height: Calculate the vertical distance from the highest point of the descending trendline down to the flat support level. This is the pattern's maximum height.
- Project the Target: Take that measured height and subtract it from the breakout point (the price where it broke through support).
Let's say a stock's descending triangle has a height of $10 (from a high of $100 down to support at $90). If it breaks support at $90, your initial profit target would be down at $80.
What's really interesting is that while it's a bearish pattern, its reliability can be exceptionally high. The descending triangle is one of the most statistically validated patterns out there. In bull markets, it has shown an impressive 87% success rate for leading to lower prices. One long-term study even found that when price breaks upward through the resistance line in a bull market, the average price increase post-breakout is about 38%. You can discover more about these pattern findings and see how they perform in different market conditions.
Tackling the Neutral Symmetrical Triangle
Unlike its directional cousins, the symmetrical triangle is a sign of true equilibrium. Think of it as a pause in the action—a moment of pure indecision where neither buyers nor sellers have the upper hand.
You'll spot it on your charts by its two converging trendlines. One slopes down from a series of lower highs, and the other slopes up from a series of higher lows. Together, they squeeze the price into an increasingly tight coil.
This pattern is a fascinating visual of a drop in volatility, often happening right before the price explodes. The big question is always: which way will it break? Since it doesn't have the built-in bullish or bearish bias of ascending or descending triangles, you have to approach it with a more neutral, prepared stance.
Your job here isn't to predict the direction. It's to be ready for a powerful move in either direction. The key to successfully triangle pattern trading with symmetrical formations is reacting swiftly once the market finally shows its hand.
Preparing for a Breakout in Either Direction
The most effective way I've found to trade this pattern is to prepare for both potential outcomes. This means setting entry orders that trigger automatically once the price makes its move, so you don't miss that initial thrust.
Here’s a practical way to set up your trade:
- Place a Buy-Stop Order: Set an order to go long just a few ticks above the upper descending trendline.
- Place a Sell-Stop Order: At the same time, set an order to go short just a few ticks below the lower ascending trendline.
This dual-order setup is what traders often call a "one-cancels-the-other" (OCO) order. Once the breakout triggers one of your orders, you simply cancel the other one. This approach takes the guesswork out of the equation and puts you in a position to capitalize on whatever the market decides.
A symmetrical triangle is the market's way of saying, "I don't know yet." Your job isn't to guess the answer but to be ready the moment it's revealed.
Using a Simple Trend Filter
While the pattern itself is neutral, it doesn't form in a vacuum. The trend that existed before the triangle started forming can give you a pretty solid clue about where it's likely headed next. Symmetrical triangles often act as continuation patterns, meaning the breakout is more likely to follow the direction of the prior trend.
A simple tool to help you gauge this is a 20-period Exponential Moving Average (EMA).
- If the price is trading consistently above the 20 EMA before and during the triangle's formation, you've got a bullish undercurrent. This tilts the odds in favor of an upward breakout.
- On the flip side, if the price is trading below the 20 EMA, the trend is bearish, pointing to a higher probability of a downward breakout.
This doesn't mean you should completely ignore the potential for a reversal. Not at all. But it does allow you to assign a higher probability to one side, which can help you decide on your position size or how you manage the trade. In fact, back-testing shows this simple filter can make a real difference. One analysis of U.S. stocks found that using a 20-period EMA trend filter boosted the win rate of symmetrical triangles by 4% and cut the drawdown by about 25%. Read more about these trading pattern findings.
Disciplined Risk Management Rules
Given the pattern's inherent uncertainty, strict risk management is absolutely non-negotiable. Your stop-loss is your safety net, protecting you from a fake-out or a sharp reversal that goes against you.
Once your trade is live, the placement is pretty straightforward:
- For a Long Position (Upward Breakout): Place your stop-loss just below the lower ascending trendline.
- For a Short Position (Downward Breakout): Place your stop-loss just above the upper descending trendline.
This placement makes perfect sense. If the price breaks out only to whip back around and re-enter the triangle, your loss is contained and manageable.
For taking profits, the same measurement technique we've discussed applies here, too. Just calculate the height of the triangle at its widest point and project that distance from the breakout point. This gives you a logical, data-driven target for your exit.
Confirmation Tools and Risk Management Strategies

Spotting a clean triangle pattern on your chart is a great start, but it’s definitely not the finish line. I’ve seen countless traders get excited by a pattern only to jump in too early. A pattern is just a potential setup; the real skill is in confirming the breakout and managing your risk from the get-go.
Without that confirmation step, you’re just gambling. By layering in a few simple tools, you can filter out the noise, avoid those frustrating false breakouts, and trade with much greater confidence.
Volume: The Ultimate Breakout Confirmation
If there's one indicator you absolutely must have on your charts when trading triangles, it's volume. Think of it as the fuel for the price move. A breakout on low, uninspired volume is like a rocket trying to launch with an empty tank—it's not going anywhere.
What you're looking for is a massive spike in volume right as the price slices through the triangle's trendline. That surge tells you there’s real conviction and heavy participation behind the move. It's the market's way of screaming, "This is for real!"
A high-volume breakout often means the big institutional players are getting involved, which gives the move a much better chance of following through. A breakout on weak volume, on the other hand, should make you extremely skeptical. It's a classic red flag for a "fake-out."
A price breakout tells you what is happening. A volume surge tells you why it's happening and how much power is behind the move. Never ignore the story volume is telling.
Layering Indicators for Added Conviction
While volume is king, a few other indicators can add another layer of confidence to your trade. They help you get a feel for the underlying momentum, which can either support or contradict what you're seeing in the price action.
Two of the most reliable and common momentum oscillators are the Relative Strength Index (RSI) and the Moving Average Convergence Divergence (MACD).
- Relative Strength Index (RSI): This tool is all about measuring the speed and change of price. For a bullish breakout, you want to see the RSI pushing above 50 and heading toward 70. This signals strengthening upward momentum. For a bearish breakdown, you'd look for the RSI to drop below 50 and fall toward 30.
- Moving Average Convergence Divergence (MACD): This one shows the relationship between two moving averages. A bullish signal is confirmed when the MACD line crosses above its signal line. A bearish breakdown gets a nod of approval when the MACD line crosses below its signal line.
Using these helps you sidestep trades where the price breaks out, but the momentum is actually fading. That’s a classic recipe for a quick and painful reversal.
Comparing Confirmation Indicators for Triangle Breakouts
To get a clearer picture, it helps to see how these tools stack up against each other. Each has its own strengths and weaknesses when it comes to confirming a breakout from a triangle pattern.
| Indicator | Primary Use | Pros | Cons |
|---|---|---|---|
| Volume | Measures market participation and conviction | – Excellent for spotting genuine breakouts – Direct confirmation of buying/selling pressure |
– Can sometimes give late signals – Less effective in low-liquidity markets (like some forex pairs) |
| RSI (Relative Strength Index) | Gauges momentum and overbought/oversold conditions | – Good for identifying weakening momentum – Helps avoid chasing exhausted moves |
– Can stay in overbought/oversold territory for extended periods during strong trends |
| MACD (Moving Average Convergence Divergence) | Shows the relationship between two moving averages to identify momentum shifts | – Effective at signaling trend changes – Crossovers provide clear entry/exit points |
– It's a lagging indicator, so signals can appear after a significant move has started |
No single indicator is a magic bullet. The real edge comes from seeing multiple signals point in the same direction. When a high-volume breakout is backed by a strong RSI reading and a bullish MACD crossover, you’ve got a much higher-probability setup on your hands.
The Cornerstone of Success: Risk Management
I’ve said it before and I’ll say it again: you can have the best pattern-spotting skills in the world, but you won't survive in this business without rock-solid risk management. Every single trade needs a plan before you even think about hitting the buy or sell button.
A great starting point is the 1% rule. It's simple: never risk more than 1% of your total trading capital on any single trade. This rule alone ensures that a string of bad luck won’t knock you out of the game. It gives your strategy the time it needs to work.
Next, always calculate your risk-to-reward ratio. Before you enter, you must know your entry price, your stop-loss, and your profit target. If your potential profit isn’t at least twice your potential loss (1:2 ratio), the trade probably isn’t worth the risk. I always aim for setups offering 1:3 or better—that’s how you put the odds in your favor long-term.
For example, if your stop-loss is 50 pips away from your entry, your profit target should be at least 100-150 pips away. These levels shouldn't be random guesses; they should be based on key market structure. Our detailed guide on how to identify support and resistance will show you how to set these levels with logic.
Finally, once a trade is moving well in your favor, consider using a trailing stop-loss. This technique means you manually or automatically move your stop-loss up (for a long trade) to lock in profits as the price climbs. It’s a fantastic way to protect your gains from a sudden reversal while still giving the trade room to run.
Common Questions About Trading Triangle Patterns
Even with a solid strategy, questions always pop up when you're live in the markets. Let's tackle some of the most common ones that traders have about using triangle patterns so you can navigate real-world scenarios with more confidence.
What Is the Best Timeframe for Triangle Patterns?
This is a classic question, and the honest answer is: it depends entirely on you. Triangle patterns show up on everything from the frantic one-minute charts all the way up to the slow-and-steady weekly charts. The "best" one lines up with your personal trading style.
Day traders, for instance, live on the 5-minute and 15-minute charts. You'll spot plenty of triangles, but be warned—these lower timeframes are notoriously noisy. False signals are common, and you have to be ready to make decisions in a heartbeat.
Swing traders usually feel more at home on the 4-hour and daily charts. Patterns that form here tend to be much more reliable and often lead to bigger, more meaningful price moves. The trade-off? You need a healthy dose of patience and wider stop-losses to ride out the daily volatility.
What Should I Do If a Triangle Pattern Fails?
First, don't panic. Pattern failures and false breakouts are just part of the game. They're completely normal and, frankly, unavoidable. A failure is when the price breaks out, looks convincing for a moment, and then snaps right back inside the triangle's boundaries.
This is precisely why a disciplined stop-loss is non-negotiable in triangle pattern trading. When placed correctly, your stop will get you out of a bad trade with a small, manageable loss, protecting your capital to fight another day.
A failed pattern isn't just a loss; it's valuable market information. For example, a failed bullish breakout often signals significant underlying weakness and can sometimes present a powerful reversal opportunity in the opposite direction.
Instead of getting frustrated, see a failed pattern as the market showing its true hand. Ask yourself what happened. Was the breakout volume weak? Did a surprise news event hit the wires? Learning from these moments is how you grow into a consistently profitable trader.
How Are Triangles Different from Wedges or Pennants?
It's easy to lump these patterns together since they all involve converging trendlines and show a period of consolidation. But the subtle differences in their structure tell very different stories about market psychology. Getting this right is crucial for anticipating the next move.
Here’s a quick breakdown:
- Triangles will almost always have at least one horizontal side (like our ascending and descending triangles) or two sloped sides that are roughly symmetrical.
- Wedges are unique because both of their trendlines slant in the same direction. A rising wedge has two upward-slanting lines, while a falling wedge has two downward-slanting lines.
- Pennants are basically tiny symmetrical triangles that form over a very short period. Their defining feature is that they always come after a sharp, almost vertical price move called a "flagpole."
Recognizing these distinctions is key. A rising wedge, for example, is often a bearish reversal pattern, while an ascending triangle is bullish. Mix them up, and you could find yourself on the disastrously wrong side of a trade.
Ready to stop guessing and start trading with a clear, repeatable strategy? At Colibri Trader, we teach you the price action techniques that work, helping you build skill and confidence without relying on confusing indicators. Take the first step and see how our approach can change your results. Discover your trading potential with Colibri Trader today!