


Trading Triangle Patterns: A Trader’s Essential Guide
When you're staring at a chart, it's easy to get lost in the noise. But sometimes, the market gives you a clear signal—a moment of calm before the storm. That's exactly what a trading triangle pattern is. It’s a temporary pause, a coiling spring where the price action tightens up before it makes its next big move.
These patterns, formed by two converging trendlines, are one of the most reliable clues you can find. They tell you that volatility is dropping, but energy is building. For a trader, that's pure gold.
Reading the Market's Next Move

Think of the market as a constant tug-of-war between buyers and sellers. Triangle patterns are the visual scorecard of that battle, showing you precisely when the pressure is reaching a breaking point. These formations pop up when an asset's price gets squeezed into a tighter and tighter range.
This guide isn't about dry theory. It's a practical framework for looking at a chart and understanding what the market is trying to tell you. Spotting these patterns is a core skill in technical analysis because they so often come right before a major price swing.
The Psychology Behind the Pattern
At its heart, a triangle pattern represents one thing: indecision. The market is consolidating, trying to figure out where to go next. During this phase, you'll almost always see volatility shrink and trading volume dry up. But don't let that lull you to sleep. It’s the market taking a deep breath before the sprint.
The classic tell-tale sign of a valid triangle is decreasing volume as the pattern forms. When the price finally breaks out, look for a huge spike in volume. That's your confirmation that the move has real conviction behind it.
Understanding this dynamic gives you a serious edge. You'll learn to spot symmetrical, ascending, and descending triangles on any chart and know exactly what story they're telling about the fight between bulls and bears. This guide will show you how to turn that insight into an actionable trading plan.
What You Will Learn
My goal here is to give you the confidence to trade these setups when you see them. We're going to cover everything you need to make smart, informed decisions when you come across these classic patterns.
- Pattern Identification: I'll show you how to draw and correctly identify the three main types of triangle patterns on any price chart, in any timeframe.
- Market Context: You'll learn to read the story each pattern tells. Is it a brief pause in a strong trend, or is a major reversal brewing?
- Actionable Strategies: We'll build a clear, step-by-step method for trading the breakout, covering exactly where to get in, where to place your stop-loss, and how to set realistic profit targets.
Think of this as learning the market's body language. It's a skill that helps you see major price shifts coming before they happen, giving you a chance to position yourself to profit from them.
The Symmetrical Triangle: A Market in Equilibrium

Of all the triangle patterns you'll find, the symmetrical triangle is the ultimate picture of a market stuck in indecision. Think of it as a temporary truce in the constant battle between buyers and sellers, where neither side can land a knockout punch. This stalemate carves out a powerful and unique formation right on your chart.
You can spot a symmetrical triangle by its two converging trendlines. The upper line slopes down, connecting a series of highs that are getting progressively lower. Meanwhile, the lower line slopes up, linking a series of lows that are getting higher. As these two lines get closer, they squeeze the price into a tighter and tighter corner, building up pressure for a big move.
This pattern is a classic consolidation phase. I like to think of it as the market coiling a spring, just storing up energy for its next big push. Because it represents a pure deadlock, a symmetrical triangle can break out in either direction. It's a completely neutral pattern until the market finally shows its hand.
Key Characteristics for Identification
To be sure you're looking at a true symmetrical triangle, you need to see a few specific ingredients. A common mistake traders make is jumping the gun and labeling any converging price action as a triangle. Let's focus on clear, objective criteria to make sure the pattern is valid.
First, you have to be able to draw two distinct, converging trendlines. A proper symmetrical triangle needs at least two touchpoints on the upper trendline (two lower highs) and two touchpoints on the lower one (two higher lows). These points confirm the boundaries of the squeeze. If you want to get this foundational skill right, you can learn more about how to draw trend lines correctly in our detailed guide.
Second, keep a close eye on the volume. A textbook symmetrical triangle will almost always show declining volume as the pattern forms. This drop-off tells you that interest is fading at the current prices, confirming the market is truly consolidating and building pressure for what comes next.
Trading the Symmetrical Breakout
Since the breakout could go either way, patience is your best friend when trading this pattern. The whole game is about waiting for confirmation, not trying to guess the outcome. A real breakout happens when the price closes decisively outside of either the upper or lower trendline.
Once you see a breakout, immediately look for a signal from the volume. A legitimate breakout should come with a significant spike in trading volume. This surge shows real conviction from buyers or sellers and dramatically boosts the odds that the move will follow through. Without that volume confirmation, you're at a much higher risk of getting caught in a "fakeout"—where the price pokes through the trendline only to snap right back inside the triangle.
The symmetrical triangle pattern represents a state of market indecision. It tells a story of a market waiting for a catalyst to determine its next major direction. A breakout from this pattern signals that the truce is over and one side has finally won.
Historical data really drives home the potential here. Research on symmetrical triangles showed that successful upside breakouts led to an average price jump of 37%. On the other hand, successful downside breakouts produced an average drop of 20%. These numbers highlight just how significant the moves can be after these periods of indecision. This data is why waiting for a confirmed breakout is absolutely critical to catching these powerful shifts in the market.
The Ascending Triangle: Identifying Building Bullish Pressure
While a symmetrical triangle shows a market wrestling with indecision, the ascending triangle tells a much clearer story. This pattern screams building bullish strength. It’s a classic continuation setup that often pops up in an established uptrend, signaling that the market is likely just catching its breath before the next big push higher.
Picture this: Sellers are digging in their heels, fiercely defending a specific price level. This creates a flat, horizontal ceiling of resistance they refuse to let the price breach. But down below, the buyers are getting restless and more aggressive. Every time the price dips, they jump in sooner and sooner, forging a series of higher lows. This action forms an upward-slanting floor of support that keeps squeezing the price back up against that stubborn resistance.
This is the dynamic that carves out the distinct shape of an ascending triangle. You're literally watching determined buyers wear down the sellers in real-time.
The Psychology Behind the Pattern
The psychology here is what makes this pattern so powerful and reliable. That horizontal resistance line shows there's a clear supply of the asset available at that price. But the rising support line tells you demand is growing stronger. Buyers are willing to pay more each time, preventing the price from falling as far as it did previously.
Think of it like a battering ram against a castle wall. Each time the price slams into that horizontal resistance, it weakens the sellers' defenses. The first few hits might get repelled, but the wall gets weaker with every impact. Eventually, the buying pressure becomes overwhelming, and the wall crumbles.
This relentless upward squeeze is exactly why an upside breakout is the most likely outcome. The pattern shows a clear transfer of power from sellers to buyers, with the bulls getting ready to take complete control.
How to Correctly Identify an Ascending Triangle
Spotting an ascending triangle isn't just about seeing a triangle shape; you have to look for a few specific ingredients to make sure it's the real deal.
- A Clear Uptrend: The pattern has the most punch when it forms during a pre-existing uptrend. Think of it as a consolidation pause, not a reversal.
- Horizontal Resistance: The top line has to be flat or very nearly flat. You need it to connect at least two swing highs at roughly the same price. This is your "castle wall."
- Ascending Support: The bottom line must be rising, connecting at least two higher lows. This shows the increasing aggression of the buyers.
- Decreasing Volume: Typically, as the price coils tighter inside the triangle, trading volume will dry up. This is a good sign—it shows energy is being stored up for the next move.
The final piece of the puzzle is a big surge in volume on the breakout. This spike is your confirmation that the market is moving with conviction and the uptrend is ready to rip higher.
The High Probability of a Bullish Breakout
In the world of technical analysis, the ascending triangle is a trader's favorite for a reason—it’s a highly reliable bullish signal. Its very structure points logically to a win for the buyers. In fact, some studies show ascending triangle patterns have a 75% success rate at predicting continued uptrends when they form in a bull market. You can dig deeper into the data on chart pattern effectiveness on strike.money.
This high probability is what makes the pattern so attractive. It gives you a clean, logical setup with a very clear line in the sand for risk—that resistance level. Once that line breaks, the consolidation is over, the bulls have won, and it signals a prime opportunity to enter a long position.
The Descending Triangle: Spotting Bearish Control
Where the ascending triangle hints at a coming bullish charge, its cousin, the descending triangle, tells a very different story—one of growing bearish power. This pattern is a classic continuation signal that you'll often see in a downtrend. It’s like watching sellers take a breath before their next big push lower.
Think of it this way: buyers are desperately holding a line in the sand, a flat support level. But above them, the sellers are getting cocky. Every time the buyers try to rally, the sellers smack the price down sooner and from a lower point than before. This creates a series of lower highs, forming a distinct downward-sloping trendline that’s constantly pressing on that flat support.
The price gets squeezed between these two lines, forming the descending triangle. It's a crystal-clear picture of buying power slowly bleeding out.
The Psychology of Fading Buyer Momentum
The descending triangle is a great window into market psychology. That flat support line tells you there's real demand at that specific price; people are willing to buy there. But the real story is that downward-sloping resistance line. It shows that sellers aren't even waiting for the price to get back to previous highs. They’re jumping in earlier and earlier to sell.
Imagine that horizontal support is a defensive wall. The first time the price hits it, buyers rush in, full of confidence. But as sellers keep hammering it from lower and lower heights, that confidence starts to crack. Each bounce off the support gets a little weaker, a little less enthusiastic, until the sellers finally gather enough force to smash right through.
This dynamic shows a clear shift. The sellers are calling the shots, and the buyers are getting worn out. This is why a breakdown below that horizontal support becomes the most likely next move.
Key Characteristics for Identification
You can't just trade every triangular shape you see on a chart; that's a quick way to lose money. To properly identify a descending triangle and avoid the fakes, you need to see a few specific things line up.
- A Pre-Existing Downtrend: This pattern has the highest reliability when it shows up in an already established downtrend, acting as a continuation signal.
- Horizontal Support: The bottom line needs to be flat. It should connect at least two major lows at roughly the same price. This is your "floor."
- Descending Resistance: The upper line has to slope downwards, connecting at least two lower swing highs. This is the visual proof of mounting selling pressure.
- Declining Volume: Just like with other triangles, you'll typically see volume dry up as the pattern forms and the price coils tighter. This is the calm before the storm.
The final confirmation is a massive spike in volume when the price breaks below support. It’s the market screaming that sellers have taken over and the downtrend is back on with a vengeance. Descending triangles are an essential pattern, signaling that bears are overwhelming buyers at a critical support level. As you can learn more about in these triangle pattern strategies on liquidityfinder.com, traders watch these setups like hawks for high-probability short entries the moment that floor finally gives way. It’s a clean signal that the bears have won the battle.
A Practical Framework for Trading Breakouts
Spotting a triangle pattern on a chart is one thing, but actually making money from it? That's a different game entirely. To do that, you need a repeatable plan—a simple set of rules for when to get in, how to protect yourself, and when to take your profits.
This framework is what turns your analysis into action. It moves you from just seeing a pattern to knowing exactly how to trade it, taking the emotion and guesswork out of the equation.
The Anatomy of a High-Probability Breakout
The biggest mistake I see traders make is jumping the gun. They see the price just barely peek outside a trendline and dive in headfirst, only to get slammed when it snaps right back inside the pattern. This is a classic false breakout, or whipsaw, and it’s a painful (and expensive) lesson.
Thankfully, you can avoid most of these with a little patience. Always, and I mean always, wait for a candle to close decisively outside the pattern. A quick poke doesn't count. You need to see the market fully commit to the new direction. This one simple filter will save you from countless fakeouts.
The other piece of the puzzle is volume. Think of volume as the gas in the tank. A real breakout needs fuel, and that fuel is a significant surge in trading volume. That spike tells you the big players are getting involved, giving the move the momentum it needs to actually go somewhere.
A breakout on weak volume is a huge red flag. It’s like a car trying to accelerate with an empty tank. Treat a big volume spike as your ultimate confirmation.
Take a look at the descending triangle below. You can see how the sellers are relentlessly pushing the price down, creating lower highs against a solid floor of support. The pressure is building.
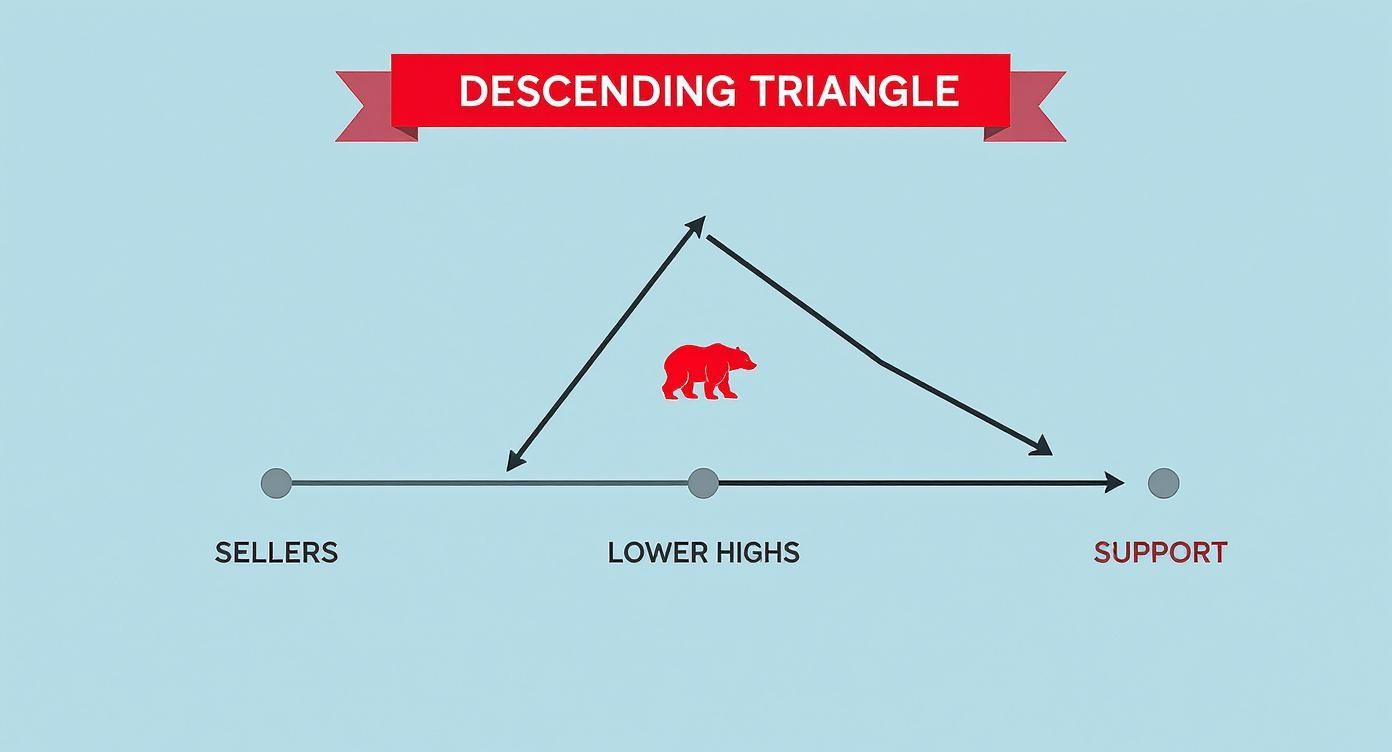
This constant bearish pressure is what makes a breakdown the most likely scenario. It’s only a matter of time before that support level gives way.
Setting Your Entry and Stop-Loss Levels
Once you've got a confirmed breakout with good volume, it's time to execute. Your plan needs to be crystal clear on two things: your entry point and your escape hatch (the stop-loss).
1. The Entry Point
Keep it simple. The most straightforward entry is to place a market order right after the breakout candle closes. For an ascending or symmetrical triangle, that means entering as soon as a candle closes above the top trendline. For a descending or symmetrical triangle, you'd enter as soon as a candle closes below the support line.
2. The Stop-Loss Placement
Your stop-loss is non-negotiable; it's what keeps one bad trade from blowing up your account. Placing it correctly is crucial.
- For Bullish Breakouts: Tuck your stop-loss just below the last swing low that formed inside the triangle. If the price drops back to that point, your bullish idea is probably wrong.
- For Bearish Breakouts: Place your stop-loss just above the most recent swing high inside the triangle. If the price rallies past that point, the bears have lost control.
This strategy keeps your risk defined without setting your stop so tight that a little market noise kicks you out of a perfectly good trade.
Calculating Your Profit Target
Okay, so you're in the trade and your risk is managed. Now for the fun part: where do you take profits? One of the most reliable methods for triangles is the projection method. It uses the size of the pattern itself to forecast how far the price might run.
Here’s the two-step process:
- Measure the Height: Find the widest part of the triangle and measure the vertical distance from the highest high to the lowest low. This is the pattern's "base."
- Project from the Breakout: Take that measured distance and project it from the breakout point. For a bullish breakout, you add the height to the breakout price. For a bearish one, you subtract it.
Let's say an ascending triangle's base measures $10 and the price breaks out at $120. Your initial profit target would be $130. It’s a clean, objective way to set a target based on the energy that was stored up during consolidation. If you want to explore more advanced techniques, check out these 9 best breakout trading strategies for 2025 which build on this foundation.
Triangle Pattern Breakout Trading Rules
To make things even easier, here's a quick cheat sheet summarizing the rules for trading breakouts from each of the three triangle patterns.
| Pattern Type | Typical Breakout Direction | Entry Signal | Stop-Loss Placement | Profit Target Method |
|---|---|---|---|---|
| Symmetrical | Either (depends on prior trend) | Candle close above/below trendline | Below swing low (bullish) or above swing high (bearish) inside the triangle | Measure pattern height and project from breakout point |
| Ascending | Bullish (Up) | Candle close above horizontal resistance | Below the last swing low inside the triangle | Measure pattern height and add to breakout price |
| Descending | Bearish (Down) | Candle close below horizontal support | Above the last swing high inside the triangle | Measure pattern height and subtract from breakout price |
This table serves as a great quick reference, but remember that market context is everything. Always combine these rules with your own analysis of the broader trend and market conditions.
Avoiding Common Triangle Trading Mistakes
Even the most picture-perfect triangle pattern can burn you if you fall into a few common traps. Knowing what not to do is just as critical as spotting the setup in the first place. Too many traders, especially when they're starting out, get taken to the cleaners by being a little too eager or just plain misreading what the market is telling them.
One of the costliest mistakes? Jumping into a trade too early.
It's incredibly tempting. You see the price just barely poke its head outside one of the trendlines and you think, "This is it!" But more often than not, this is a classic "fakeout." It's a move designed to trap impatient traders before the price snaps right back inside the pattern, leaving you holding a losing ticket.
The fix is simple, but it takes serious discipline: always wait for a candle to close outside the pattern. A solid close is your confirmation that the market truly means business. Pair that with a noticeable spike in trading volume, and you've got powerful evidence that the breakout is real and has the fuel to keep going.
Forcing Patterns That Aren't Really There
Another way traders shoot themselves in the foot is by trying to make a pattern fit. They see two lines that are sort of converging and immediately start drawing a triangle, even if the price barely touches the lines or the volume profile looks all wrong.
This is a recipe for disaster. Trading a poorly formed pattern is like building a house on a shaky foundation—it’s just not going to hold up. The rules for identifying these patterns exist for a reason: they are your filter for weeding out the low-probability garbage.
The market doesn't owe you a perfect setup. If the trendlines are not clean and the volume profile is wrong, it’s not a valid pattern. The best trade is often the one you don't take.
To stay out of trouble, just stick to the script. Demand clear, solid touches on both trendlines. Insist on seeing that tell-tale drop in volume as the pattern coils. If those key ingredients are missing, just move on. There will always be another bus. Understanding the most common trading mistakes to avoid is the fastest way to protect your capital and build consistency.
Ignoring the Bigger Picture
Finally, a massive error is trading a triangle in a vacuum, completely ignoring the larger market context. You might spot a gorgeous ascending triangle—a classic bullish signal—but if it's forming right up against a monster of a long-term resistance level, the odds of a successful breakout plummet.
A pattern's reliability skyrockets when it's moving in the same direction as the primary trend.
- The Problem: A beautiful bullish ascending triangle appears, but it's happening inside a brutal, long-term downtrend.
- The Solution: Treat it with extreme caution. That breakout is far more likely to fizzle out as the bigger bearish momentum smothers the short-term buying pressure. It might be a pattern to watch, but it's probably not one to trade.
Always take a moment to zoom out. Look at the daily or even the weekly chart. Is your pattern going with the flow of the major trend, or is it trying to swim upstream? Aligning your triangle trades with the bigger market picture is a simple step that can dramatically boost your odds and help you sidestep a world of frustration.
Frequently Asked Questions About Trading Triangles
Even after you get the hang of trading triangles, a few questions always seem to pop up. That’s perfectly normal. Let's tackle some of the most common ones I hear from traders to clear up any confusion and get you trading with more confidence.
What Is the Difference Between a Triangle and a Wedge?
This is a big one, and it's easy to see why they get mixed up. At a glance, triangles and wedges look similar, but they tell very different stories about what the market might do next.
A triangle pattern has one flat trendline (like in ascending/descending triangles) or two trendlines that are both closing in on each other (a symmetrical triangle). Think of it as the market taking a breather, coiling up before it continues in the same direction it was already heading.
A wedge pattern, on the other hand, has two trendlines that are both pointing in the same direction, either up or down. Wedges are usually reversal patterns. They signal that the current trend is running out of gas and could be about to turn around.
The bottom line is this: Triangles usually signal that a trend is just pausing and will likely continue. Wedges often signal the trend is exhausted and might reverse. Knowing which one you're looking at is crucial.
How Long Should a Triangle Pattern Take to Form?
There's no magic number here, but in my experience, a solid triangle on a daily chart usually needs a few weeks to a couple of months to form properly. This gives the market enough time to build that tension between buyers and sellers, which is what gives the eventual breakout its power.
If a pattern forms too quickly, say over just a few days, it probably doesn't have much conviction behind it. But if it drags on for many months, it starts to lose its relevance as the bigger market picture changes.
Can I Trade Inside the Triangle Before a Breakout?
You can, but I wouldn't recommend it. Trading the choppy, back-and-forth action inside a tightening triangle is incredibly difficult. As the range gets smaller, volatility dries up, and trying to scalp tiny profits becomes a high-risk game. It's a strategy best left to seasoned range traders.
For most of us, the smart money is on patience. Waiting for a confirmed breakout—ideally with a nice spike in volume—is the highest-probability way to trade these setups. It’s your signal that the market has finally picked a side.
What Indicators Best Confirm a Triangle Breakout?
Price and volume are king. Nothing beats watching the price close decisively outside the trendline on heavy volume. That's your primary confirmation. However, a couple of indicators can add an extra layer of confidence.
- Relative Strength Index (RSI): A breakout is more convincing when momentum agrees. If you see a bullish breakout and the RSI crosses above 50, that’s a good sign. For a bearish break, you'll want to see the RSI drop below 50. It shows momentum is on your side.
- Moving Averages: After a breakout, watch how the price interacts with a key moving average, like the 20-period EMA. If the price breaks out to the upside and then holds above the 20 EMA, that moving average is now acting as dynamic support, confirming the new trend is taking hold.
At Colibri Trader, we teach traders how to read pure price action, so you don't have to rely on a chart full of confusing indicators. Our entire approach is built on helping you develop real skills for lasting results. Discover how our clean, straightforward methodology can transform your trading by visiting https://www.colibritrader.com.