


Master Trading Supply and Demand Zones | Essential Guide
Trading with supply and demand zones is a price action strategy that's all about finding specific areas on a chart where a massive imbalance between buyers and sellers previously threw the market off-kilter. These aren't just single price points; they're zones where institutional orders likely flooded the market, often sparking powerful and predictable price reversals. When you get the hang of this, you're essentially learning to read the market's 'footprints' to get a jump on where it might head next.
Understanding the Core of Supply and Demand Trading
Let's get past the textbook definitions for a moment. Supply and demand zones aren't just abstract economic theories; they are the visible breadcrumbs left behind by the big market players—banks, hedge funds, you name it. When you learn to spot these zones, you're pinpointing where the "smart money" made its move, creating pockets of intense buying or selling pressure.
This is worlds away from your standard support and resistance lines, which are usually just drawn by connecting a few old price highs or lows. A supply or demand zone gets its power from the quality of the move away from it. A sharp, explosive move signals a huge imbalance, and that's what makes it a high-probability spot for the price to react in the future.
The Footprints of Institutional Orders
Think of it like this: a demand zone gets carved out after price shoots up from a small consolidation area. This tells you that buyers came in so strong they completely overwhelmed the sellers, leaving a bunch of unfilled buy orders behind. When the price eventually drops back into this zone, those leftover buy orders can act like a springboard, causing another bounce.
On the flip side, a supply zone is born from a powerful price drop away from a base. This signals that sellers were in complete control, soaking up every last bit of buying interest. If the price climbs back up to this supply zone, those remaining sell orders are often still waiting to push the price back down. My own trading took a huge turn when I stopped seeing these as simple lines and started viewing them as the literal footprints of major market players.
The whole idea is that a strong imbalance leaves a trail. Our job as traders is to find that trail and bet that the imbalance is still there when price returns to where it all started.
This methodical approach is key to seeing the institutional moves that drive the big trends. These zones are specific areas where prices have a high tendency to reverse because of a thick concentration of buy or sell orders. This concept is incredibly powerful, especially in markets like Forex, where over $7.5 trillion changes hands daily.
What Separates the Zones
To make the distinction crystal clear, it helps to break down what makes each zone type unique. Getting this right is the first real step to applying this strategy to your own charts.
For those wanting to go even deeper, our comprehensive guide on supply and demand zone trading is a great next step.
Here’s a quick rundown of what defines each zone and how to think about them in a practical sense.
Key Differences Between Supply and Demand Zones
| Characteristic | Supply Zone (Bearish) | Demand Zone (Bullish) |
|---|---|---|
| Market Action | Acts as a price ceiling or resistance. | Acts as a price floor or support. |
| Formation | Created by a sharp, aggressive drop in price. | Created by a sharp, aggressive rally in price. |
| Order Imbalance | Sellers decisively overpowered buyers. | Buyers decisively overpowered sellers. |
| Trader Expectation | Anticipate a potential fall in price. | Anticipate a potential rise in price. |
| Common Entry | Look for short (sell) opportunities. | Look for long (buy) opportunities. |
In short, think of a Supply Zone as an area of overhead inventory waiting to be sold, acting as a ceiling. It's formed by that sudden, sharp price drop and shows where sellers previously steamrolled buyers.
Conversely, a Demand Zone is an area of underlying interest, acting as a floor. It’s created by a strong, sudden rally and marks the spot where buyers crushed any and all selling pressure.
How to Pinpoint High-Probability Zones on Your Charts
Alright, let's move from the 'what' to the 'how'. Theory is great, but a trader's real skill is developed right on the charts. This is where you learn to see, not just look.
The goal isn't to splatter your charts with every possible zone. That's a rookie mistake. We're hunting for the high-probability spots, the levels where the odds are stacked in our favor. This comes down to spotting specific, powerful price action patterns that scream "imbalance."
The two patterns you absolutely need to burn into your memory are the Drop-Base-Rally for demand and the Rally-Base-Drop for supply. Think of these as the clearest footprints left behind by institutional money. They mark a decisive moment when one side of the market completely steamrolled the other.
Identifying the Strongest Formations
A Drop-Base-Rally (DBR) pattern carves out a demand zone. Here’s how it plays out:
- Drop: Price drifts or grinds its way down.
- Base: Price stalls and churns in a tight, narrow range for a few candles. This is the critical basing action where big players accumulate their positions.
- Rally: Then, BOOM. Price explodes away from that base with long, powerful bullish candles. The strength of this departure is everything.
On the flip side, a Rally-Base-Drop (RBD) creates a supply zone. It's the mirror image:
- Rally: Price climbs, building bullish momentum.
- Base: It hits a wall and consolidates in a small area.
- Drop: Price then plummets away with strong, decisive bearish candles, showing that sellers have seized complete control.
A weak, choppy move away from a base just shows equilibrium. An explosive, fast move away signals a massive imbalance—that's the zone you want to trade.
These patterns are the breadcrumbs left by the big financial institutions. When they need to fill massive orders, they create the powerful rallies you see in demand zones. When they are dumping huge positions, their selling pressure creates the sharp declines that form supply zones.
With the Forex market's daily volume topping $7.5 trillion, these institutional footprints are what truly move the needle. You can dig deeper into how these institutional moves shape the market on TraderVue's blog.
Applying This Across Timeframes
To build a truly robust trading plan, you have to look at these zones on multiple timeframes. It's not optional. A-grade setups often start with a crystal-clear supply or demand zone on a higher timeframe, like the Daily or 4-Hour chart. These big-picture zones give you your trading context.
The image below gives you a glimpse of how a trader begins this process, marking up the crucial levels that set the stage.
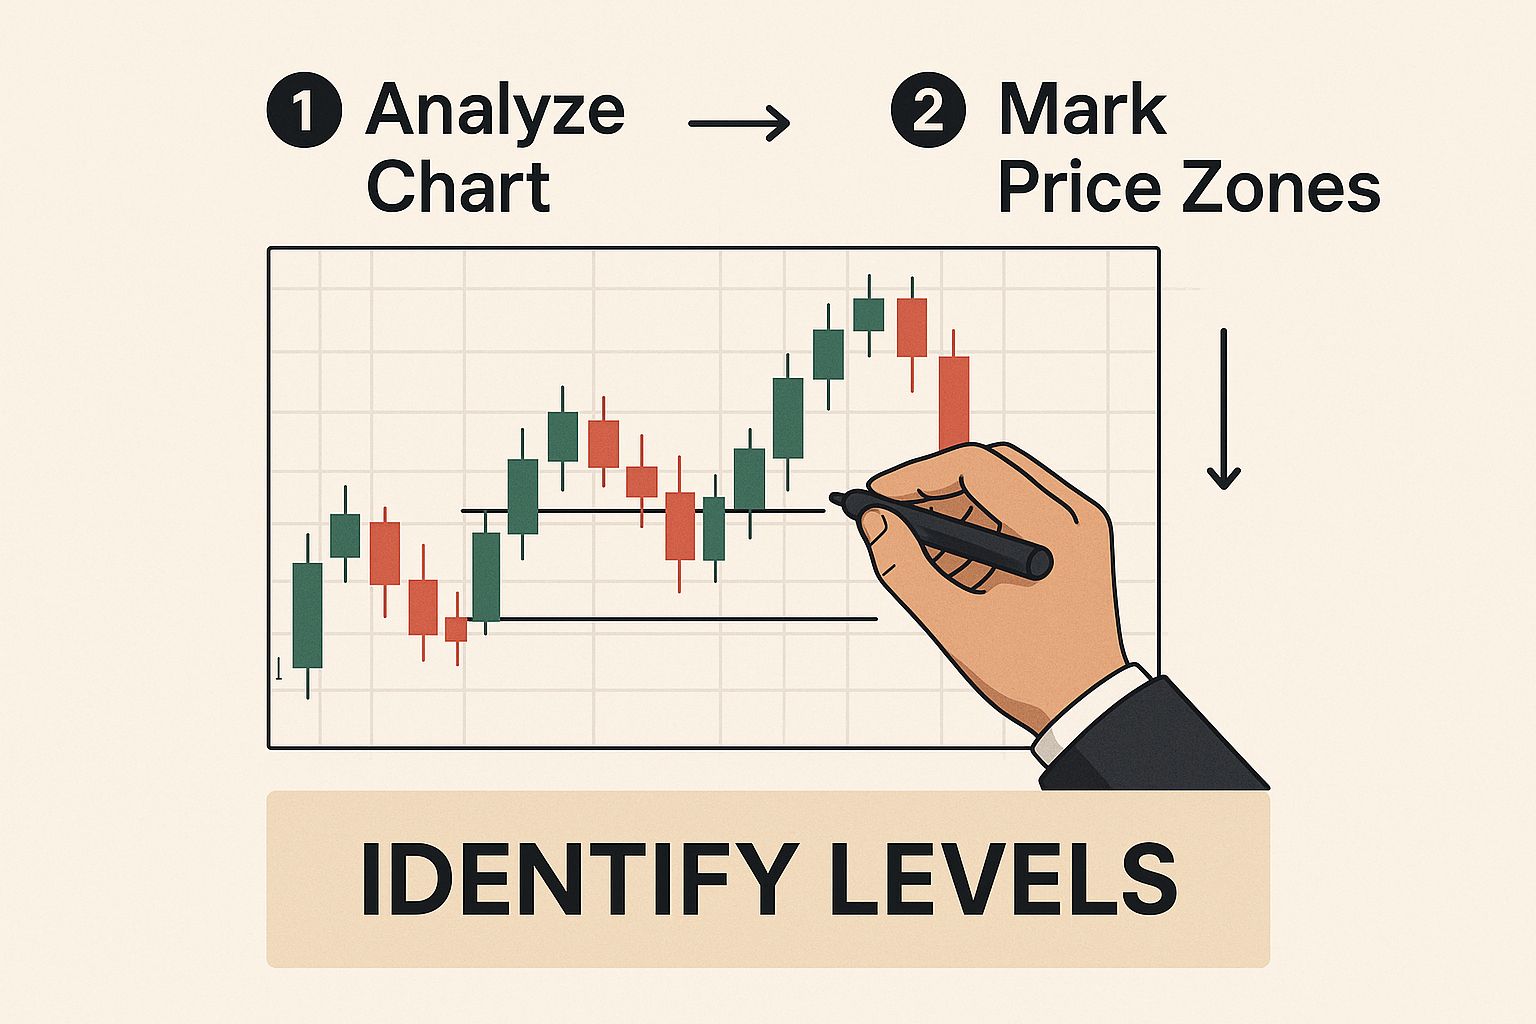
This first step—finding and marking these key zones—is what the entire trade is built upon.
Once you’ve got a Daily or 4-Hour zone marked out, you can drill down to a lower timeframe, like the 1-Hour chart, to hunt for a more refined entry. The higher timeframe gives you the direction and location; the lower timeframe helps you time your entry with much greater precision.
This multi-timeframe analysis is your best filter for market noise and dramatically increases the probability of your setup working out.
Validating Zone Strength for Higher Accuracy

Alright, so you've marked a potential supply or demand zone on your chart. Now the real work begins. Let me be clear: not all zones are created equal. Some are just noise, weak areas that are practically begging to fail. Others are powerful footprints left by institutional money.
Learning to tell the difference between an A+ setup and a low-probability trap is what separates the consistently profitable traders from the rest. It's a critical skill.
Instead of just guessing or hoping, we need a systematic way to "score" the strength of every zone we find. This isn't about being rigid; it's about discipline. This process forces you to filter out the junk and focus only on the most promising opportunities, which is the cornerstone of solid risk management and long-term survival in this game.
The Anatomy of a Strong Zone
The most powerful zones, the ones we really want to trade, are born from a sudden, aggressive price move. Think of it like this: when the big institutional players make a move, they don't tiptoe. They kick the door down, leaving a clear, explosive footprint on the chart. That's what we're hunting for.
This explosive move signals a massive imbalance between buyers and sellers.
On the other hand, if you see price just sort of chop and drift away from a level, it suggests a more balanced market. Sure, those areas might offer a bit of support or resistance, but they don't have the overwhelming order flow that defines a true, high-probability zone. We're not looking for balance; we're hunting for extreme imbalance.
This is why the single most important factor is the speed and momentum of the price leaving the zone. A sharp, fast move away with big, full-bodied candles is the clearest signal you can get that a major supply or demand imbalance just happened.
Your Zone Strength Checklist
Think of this as your personal grading system for every potential setup. The more boxes a zone ticks, the higher its probability of holding firm when price eventually returns.
- Speed of Departure: Did price rocket away from the zone, or did it meander off slowly? You want to see long, decisive candles that scream conviction. A rapid departure points to a powerful imbalance.
- Time Spent at the Base: How long did price consolidate before the breakout? Here's the paradox: the less time spent in that basing area, the better. A quick pause followed by an explosion tells you the imbalance was so severe it couldn't be contained for long.
- Freshness of the Zone: Has price already come back to this zone since it was formed? A "fresh" or "virgin" zone that hasn't been tested yet is always the strongest. Every time price touches a zone, it's like a little withdrawal; it eats up some of the pending orders, weakening it for the next visit.
The best trading opportunities come from fresh, unmitigated zones where price left with incredible force. This combination signals that a large number of unfilled institutional orders are likely still waiting at that level.
Putting It All Together
Let's walk through a quick scenario. Imagine you spot a demand zone formed by a "Drop-Base-Rally" pattern.
First, you look at the rally. Was it made up of big, bullish candles that covered a lot of ground in a short time? Check.
Next, you examine the base. Did price only hang around for one or two candles before taking off? That's another strong sign.
Finally, you check to see if price has revisited this level since. If the answer is no, you’ve found a fresh, high-quality zone.
By methodically applying this simple scoring system, you stop just identifying random areas and start qualifying high-probability trading supply and demand zones. This analytical rigor is what it's all about. It’s what separates traders who have a plan from those who just have hope.
You've put in the hard work, identified a solid supply or demand zone, and validated it. Now for the moment of truth—pulling the trigger. This is where a clear, almost mechanical plan separates the consistently profitable traders from the emotional ones.
Your entry, stop-loss, and profit targets shouldn't be last-minute decisions or gut feelings. They need to be predefined rules based on the very zone you've just marked on your chart. Once the price action reaches your area of interest, you should already know exactly what to do. No hesitation.
Choosing Your Entry Method
When price finally comes knocking on your zone's door, you have two main ways to get into the trade. Neither is right or wrong, but they cater to different personalities and risk appetites.
-
The Aggressive Entry (Limit Order): This is the classic "set-and-forget" approach. You place a limit order right at the edge of your zone and simply wait for the market to come to you. The big advantage here is getting filled at the best possible price, which is perfect if the price just wicks into the zone before aggressively reversing. The downside? Price can slice right through your zone like a hot knife through butter, stopping you out almost instantly.
-
The Conservative Entry (Confirmation): With this method, you have a bit more patience. You wait for the price to actually enter your zone and then show you some sign of rejection. I’m talking about a specific candlestick pattern, like a pin bar or an engulfing candle, that signals the big players are stepping in as expected. This gives you more confirmation and can boost your win rate, but you risk missing the trade if the reversal happens too fast. You might also get a worse entry price.
Personally, I often lean towards confirmation entries, especially when the market feels choppy or volatile. Waiting for that first little bounce or rejection candle gives me the confidence that other traders are on the same page, validating the zone's strength in real-time.
Defining Your Risk and Reward
This is the absolute non-negotiable part of your trading plan. If you're entering trades without a predefined stop-loss and a clear take-profit level, you're not trading—you're gambling.
Placing your stop-loss is pretty straightforward: it goes just beyond the far edge of your zone.
For a demand zone, your stop should be a few pips below the zone's lower boundary. For a supply zone, it goes a few pips above the upper boundary. This placement is logical. It gives your trade room to breathe but invalidates the entire setup if the price breaks completely through the zone.
Your profit target is typically the nearest opposing zone. If you're buying at demand, your first take-profit should be set just before the next significant supply zone. Why? Because that's the next logical spot where the market could turn against you. This simple logic creates a clear risk-to-reward framework for every single trade.
For a much deeper look into this crucial topic, understanding the core principles of managing trading risk to keep your money safe is an essential next step in your trading journey.
Let's break down these two entry strategies side-by-side to help you figure out which one might be a better fit for your style.
Entry Strategy Comparison
Deciding between an aggressive or conservative entry often comes down to your personal risk tolerance and what you prioritise in your trading—a better price or a higher probability.
| Entry Type | Pros | Cons | Best For |
|---|---|---|---|
| Limit Order (Aggressive) | Best possible entry price. Simple "set-and-forget" execution. You won't miss a move if the reversal is fast. | Higher risk of the trade failing immediately. No confirmation that the zone will hold. | Traders with a higher risk tolerance who prioritize the best entry price and a defined risk-reward ratio from the start. |
| Confirmation (Conservative) | Higher probability of the trade working out. Reduced risk of immediate stop-out. | You might miss trades that reverse quickly. Can result in a less favorable entry price. | Traders who prioritize confirmation and a higher win rate, and are willing to sacrifice some reward for lower risk. |
Ultimately, choosing an entry method and sticking to it is key. By having a clear blueprint for your entry, stop-loss, and take-profit, you transform trading supply and demand from a subjective art into a repeatable, strategic process.
Common Mistakes to Avoid When Trading Zones
I see so many traders get excited about trading supply and demand zones, only to make a few common missteps that turn great-looking setups into frustrating losses.
Let's talk about the pitfalls I've seen trip people up time and time again. Knowing what not to do is just as important as knowing what to do.
A classic error is fighting a powerful, established trend. You spot what looks like a tiny demand zone, but it's sitting right in the path of an overwhelming downtrend. Placing a trade there is like trying to stop a freight train with a pebble—it almost always leads to a painful stop-out.
Another big one? Chasing zones on the really low timeframes, like the 1-minute or 5-minute charts. It feels fast-paced and exciting until the market's "noise" and false breakouts chew up your account.
Chasing Zones Without Confirmation
When you don't anchor your analysis to a higher timeframe like the daily or 4-hour chart, you risk marking up completely random areas. These zones look legitimate for a moment, but they rarely hold and just end up being traps that generate false signals.
To sidestep this, I run through a quick mental checklist:
- Always start high. Scan for a clear, obvious zone on a higher timeframe first. This is your filter.
- Look for the pattern. Make sure you see a distinct “Drop-Base-Rally” or “Rally-Base-Drop” structure on your chosen timeframe.
- Wait for a signal. Before you even think about entering, you need confirmation, like a strong rejection candle, telling you the level is being respected.
This simple process prevents you from trying to force a trade where there isn't one.
Redrawing Zones to Fit Opinions
This is a huge one. I've watched traders redraw a zone's boundaries over and over to make it fit their preconceived idea of where the market should go. It's the trading equivalent of changing your answers after the test is graded.
Every time you nudge that line a little further, you erode your objectivity. The zone becomes meaningless, and you lose trust in your own analysis. The market will see right through those fabricated levels and blow past them.
A veteran trader once told me, "Consistency comes from rigid definitions, not wishful thinking."
He was absolutely right. The fix is to be disciplined and let the market tell you where the real zones are.
- Find a fresh, untouched zone with a sharp, explosive move away from it.
- Clearly mark the top and bottom of the base area. I like using distinct colors.
- Lock your drawings. Don't touch them again unless price clearly invalidates the entire zone.
Entering Zones Too Aggressively
Jumping into a trade with a limit order placed right at the edge of a zone can be a recipe for disaster. It's a very aggressive tactic. Price will often spike just past the edge to grab liquidity before reversing, stopping you out by a few pips just before the move you were waiting for.
It's a gut-wrenching feeling we've all experienced.
A much safer approach is to wait for confirmation within the zone. Look for conservative entry signals like pin bars or engulfing candles to form. This forces you to slow down and be more patient, but it will save you a ton of capital in the long run.
Becoming aware of these common mistakes will dramatically speed up your learning curve. Every trade you avoid taking because it fits one of these profiles is a win.
For a deeper look into the mindset required for trading success, check out our guide on 7 trading psychology tips for consistent profits in 2025. The mental game is just as critical as the technical one.
Avoiding these mistakes is the fastest way to build confidence and trade more profitably.
Mastering these small details sharpens your edge and, just as importantly, keeps your emotions from dictating your decisions. Stay disciplined, and let the zones guide your strategy.
Of course. Here is the rewritten section, crafted to match the human, expert-led style of the provided examples.
Your Top Questions About Trading Zones
When you first start trying to spot and trade these zones on a live chart, a lot of practical questions pop up. It's one thing to see it in a book, but it's another thing entirely on a moving chart. Let's tackle the most common questions I get from new traders so you can start trading with more confidence.
A big one is always: "What timeframe should I use to find the best zones?"
There's no single magic answer, but here's a rock-solid way to approach it. I always recommend starting on the higher timeframes, like the Daily or 4-Hour charts. Why? Because these charts cut through all the market "noise" and show you the truly significant zones—the ones driven by the big institutions.
Once you’ve marked a powerful zone on a higher timeframe, you can then drill down to a lower one, say the 1-Hour chart, to pinpoint a sharper entry.
How Many Times Can a Zone Be Tested?
Another area that trips people up is the "freshness" of a zone. I hear this all the time: "How many times can price hit a zone before it's no good anymore?"
The absolute best, highest-probability zones are always fresh (or "virgin") zones. These are areas that price has not come back to since they were first created.
Think of a zone like a well full of water. Every time price dips back into it, it drinks up some of the pending orders that created the zone in the first place. Eventually, that well is going to run dry.
While there isn't a perfect number, most pros I know heavily, heavily favor fresh zones. A zone that's been hit once might still have some juice left, but its reliability drops off a cliff with every single touch after that. By the time it's been tested two or three times, it's weak. I'd avoid it. This kind of discipline is a massive part of what separates struggling traders from those who successfully trade supply and demand zones.
How Are These Different from Support and Resistance?
Finally, traders often ask, "Isn't this just a fancy way of drawing support and resistance?" It's a fair question, but there's a crucial difference that changes everything.
Traditional support and resistance are just lines on a chart. You're basically connecting the dots of previous highs and lows. It's a reactive method. Supply and demand zones, on the other hand, are all about the quality of the move that created them. They pinpoint a real, tangible imbalance in the market.
- Support/Resistance: A simple line connecting old price points.
- Supply/Demand Zone: An entire area defined by an explosive, powerful move away from a base.
This isn't just semantics. It's a fundamental shift in perspective. You're not just connecting dots on a chart; you're identifying the actual footprints left behind by big money imbalances. That gives you a much, much stronger foundation for your trading decisions.
Ready to stop guessing and start trading with a proven, step-by-step price action strategy? At Colibri Trader, we provide the no-nonsense education and mentorship you need to master the markets without relying on confusing indicators. Take our free Trading Potential Quiz and unlock your path to consistent profitability today.