


Master Trading Reversal Patterns: Proven Strategies for Success

Trading reversal patterns are powerful chart formations that can tell you when a market's trend is running out of gas and might be about to flip. Think of them as the market’s body language—they’re the visual cues that show a power struggle is happening between buyers and sellers, and one side is starting to stumble.
How to Read Market Reversal Signals
Picture the market as a tug-of-war. For a while, one team—either the bulls (buyers) or the bears (sellers)—is clearly winning, pulling the price steadily in their direction. A reversal pattern is that moment when you see the lead team start to lose their footing and the rope begins to slide the other way.
Spotting these signals is like noticing the subtle shift in momentum before the crowd does. It gives you a chance to anticipate the market’s next big move. These patterns aren't just random squiggles on a chart; they're visual stories of a trend getting exhausted.
The Psychology of a Reversal
At its heart, every reversal pattern shows one thing: failure.
In a strong uptrend, prices keep making higher highs and higher lows. The reversal begins when buyers suddenly fail to push the price to a new high. In a downtrend, it’s when sellers fail to drag the price to a new low.
This moment of failure is what creates the distinct shapes we learn to recognize. It’s the first sign that the dominant group is losing control, giving the other side the confidence to jump in and take over. Once you understand this psychological battle, you stop seeing lines and start seeing the story unfold.
The key takeaway is simple: a reversal pattern is a story of a failed trend. It’s the visual evidence that the dominant market force is running out of steam, presenting a prime opportunity for traders who know how to read the signs.
Why These Signals Matter
Catching these patterns early gives you a massive edge. Instead of jumping on a trend just as it's about to die, you can get positioned for the very beginning of the next one.
This isn't about reacting to what already happened; it’s about anticipating what's likely to happen next. This proactive mindset is what separates consistently profitable price action traders from the rest of the pack.
In the sections that follow, we'll dive deep into the most reliable bullish and bearish reversal patterns. We'll go beyond theory and get into the nitty-gritty of how to spot them, how to trade them, and how to manage your risk like a pro.
Spotting Powerful Bullish Reversal Patterns

When a market has been stuck in a downtrend, every trader is on the lookout for that one signal—the sign that sellers are finally throwing in the towel. Bullish reversal patterns are the footprints left on the chart that show this exact power shift is happening. They tell us that the selling pressure is finally drying up and buyers are stepping back in, potentially with enough force to kick off a brand new uptrend.
These patterns don't just pop up randomly. They take shape after a good, long downtrend and represent the final showdown where buyers soak up all the remaining selling and start to nudge prices higher. Being able to spot these formations is a bread-and-butter skill for any serious price action trader.
Let's dive into two of the most reliable bullish reversal patterns I watch for: the Inverse Head and Shoulders and the Double Bottom.
The Inverse Head and Shoulders
The Inverse Head and Shoulders is a classic for a reason—it’s one of the most respected bullish reversal patterns out there. It looks exactly like it sounds: a regular Head and Shoulders pattern flipped on its head. The beauty of this pattern is that its structure tells a very clear story of the market shifting from bearish to bullish.
It's built from three distinct troughs, or lows, all connected by a critical horizontal resistance line we call the neckline.
- Left Shoulder: The market is falling and carves out a new low. A small rally follows, but the sellers quickly snuff it out and regain control.
- Head: Now, the sellers push the price to an even lower low, past the left shoulder. This marks the absolute bottom of the pattern. But then something changes. The rally that follows is stronger this time, pushing the price all the way back up to that same resistance level (the neckline). This is the first real clue that the bears are losing their grip.
- Right Shoulder: The sellers give it one last shot, trying to push the price down again. But they can't even get close to the low of the head. This "higher low" is a huge signal. It tells you buying pressure is quietly building and the sellers are exhausted.
The neckline is simply a line drawn connecting the peaks of the small rallies between the shoulders and the head. A clean break above this line, especially with a jump in trading volume, is your confirmation. The pattern is complete, and a new uptrend is very likely on its way.
And this isn't just theory. The Inverse Head and Shoulders has some solid stats behind it. A 2018 study on the Indian stock market found it had a success rate of about 75% in predicting upward moves after a confirmed breakout. You can learn more about these powerful chart formations and their reliability.
The Double Bottom
Another workhorse of bullish reversals is the Double Bottom. I like to think of it as the market trying to break a support level, failing, and then trying again, only to fail a second time. It carves out a distinct "W" shape on your chart and is a strong hint that the trend is about to turn.
The psychology here is pretty simple. After a downtrend, the price hits a low and bounces. Sellers, thinking they can push it lower, jump back in. But they only manage to drive the price back to the same support level as the first low before buyers rush in with even more conviction.
That failure to make a new lower low is everything. It's a clear message that the bearish momentum has hit a brick wall and a solid floor of support has been built.
Key Takeaway: The Double Bottom pattern shows that selling pressure has been tested twice at a specific level and has been rejected both times. This "W" shape means buyers have taken control at that price, and they're ready to push the market higher.
To spot a Double Bottom, you need these pieces in place:
- First Trough: Price makes a new low, setting an important support level.
- Intermediate Peak: A rally follows, which creates a small resistance level (or neckline) between the two lows.
- Second Trough: Price falls back down to that same support level from the first trough but doesn't break it.
- Confirmation: The pattern is locked in when the price breaks decisively above that intermediate peak (the neckline).
Volume can give you extra clues here. Often, you'll see volume is a bit lower on the second trough, showing there's less enthusiasm from sellers. Then, a big spike in volume as the price breaks the neckline adds another layer of confidence to the signal.
While these big chart patterns point to major trend changes, the individual candles within them can give you early hints. For traders looking to really sharpen their entries, a deeper dive into Japanese candlestick patterns is a fantastic next step.
Identifying Key Bearish Reversal Patterns
While bullish patterns signal that a downtrend is running out of steam, bearish patterns are the storm clouds gathering at the peak of an uptrend. They're a critical warning that buying momentum is fading and the sellers are about to take over.
Spotting these formations early can be the difference between locking in profits near the top and riding the trend all the way back down.
These patterns form when the bulls are simply exhausted. After a long run-up, buyers start losing conviction, and sellers begin to smell an opportunity. The battle that follows creates distinct shapes on the chart that, if you know what to look for, scream "reversal." We'll focus on two of the most reliable bearish patterns out there: the classic Head and Shoulders and the Double Top.
The Head and Shoulders Pattern
The Head and Shoulders is arguably the most famous bearish reversal pattern, and for good reason—it’s incredibly reliable. Its structure paints a vivid picture of an uptrend's last gasp before it fails. The pattern consists of three peaks: the middle peak (the Head) is the highest, flanked by two lower peaks (the Shoulders).
This formation tells a clear story about the shifting power dynamic in the market:
- Left Shoulder: The uptrend is still going strong. Buyers push the price to a new high, but some early profit-taking causes a small dip.
- Head: Buyers, still confident, manage to push the price to an even higher high, well past the left shoulder. But this time, the sell-off is much bigger. This aggressive selling erases a good chunk of the recent gains and shows that sellers are getting serious.
- Right Shoulder: The bulls give it one last shot. They rally again but can't even get the price back up to the previous high (the head). This failure is a massive red flag. It shows the buyers are out of gas.
The key to this whole setup is the neckline, a support line drawn connecting the lows of the dips between the peaks. A clean break below this line is your confirmation. It’s the market’s way of saying the sellers have officially taken control, and the uptrend is over.
The Double Top Pattern
The Double Top is another cornerstone bearish pattern, easily spotted by its "M" shape. It shows up after a strong uptrend and signals that the market tried—and failed—to break through a major resistance level twice.
The psychology here is pretty simple. Buyers push the price up to a new high, where they hit a wall of sellers. This resistance shoves the price back down, creating the first peak. After a short dip, the bulls regroup for another attempt. They drive the price right back to that same resistance level, only to be rejected again.
That second failure is a powerful sign of weakness. It tells every trader watching that the buyers just don't have enough muscle to push through.
Key Insight: The Double Top's "M" shape represents two failed attempts by buyers to keep the party going. When the market can't break a key resistance level twice, it’s a strong hint that the path of least resistance has flipped to the downside.
Confirmation comes when the price breaks below the support level formed by the low point between the two peaks. Think of this as the pattern's neckline. A solid close below this line means the sellers have won, and a new downtrend is likely getting started. Often, you'll see volume decreasing on the second peak, which is another clue that bullish conviction was fading even before the breakdown.
This quick infographic compares the key data points between the Double Top and its bullish counterpart, the Double Bottom.
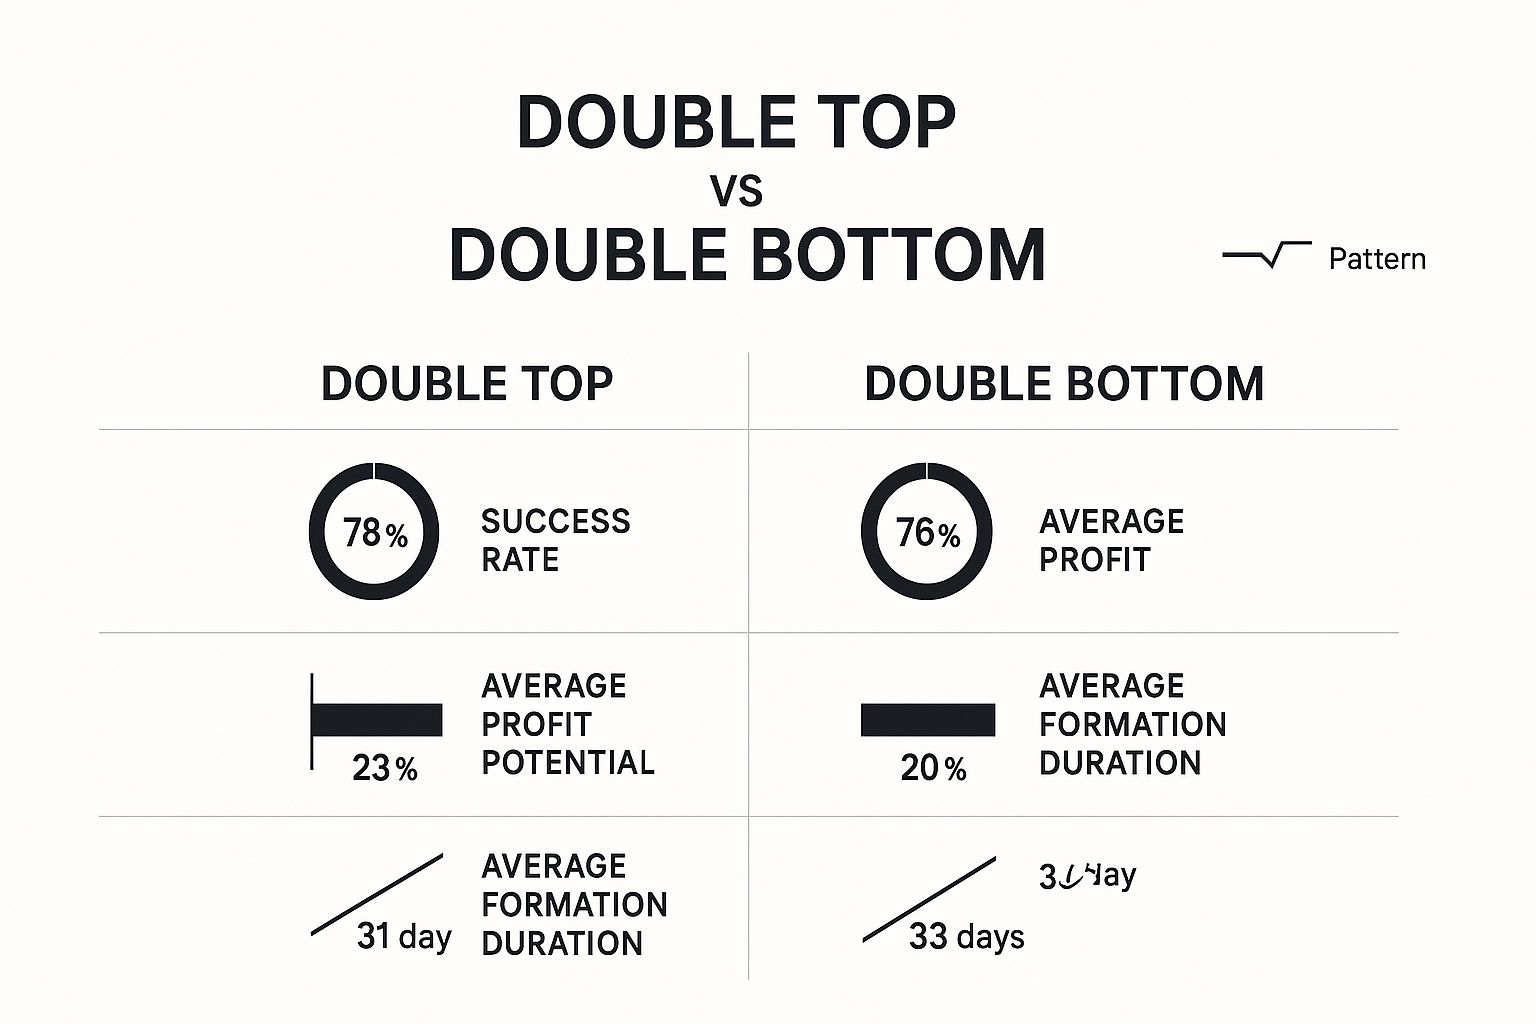
The data highlights that while both patterns are powerful, the Double Top has a slightly higher historical success rate, backing up its reputation as a dependable bearish signal.
To help you quickly compare these patterns against their bullish counterparts, here is a quick reference table.
Bullish vs Bearish Reversal Pattern Characteristics
| Characteristic | Inverse Head & Shoulders (Bullish) | Double Bottom (Bullish) | Head & Shoulders (Bearish) | Double Top (Bearish) |
|---|---|---|---|---|
| Prior Trend | Downtrend | Downtrend | Uptrend | Uptrend |
| Shape | Three troughs; middle is lowest | "W" Shape | Three peaks; middle is highest | "M" Shape |
| Key Level | Neckline (Resistance) | Resistance Line | Neckline (Support) | Support Line |
| Confirmation | Breakout above the neckline | Breakout above resistance | Breakdown below the neckline | Breakdown below support |
| Signal | Potential new uptrend | Potential new uptrend | Potential new downtrend | Potential new downtrend |
| Volume Signal | Increases on breakout | Often higher on second bottom | Increases on breakdown | Often lower on second top |
This table makes it easy to see how these patterns mirror each other, simply reflecting opposite market psychologies—one of exhaustion for sellers, and the other, for buyers.
Both the Double Top and Head and Shoulders have been staples of technical analysis for decades because they work. Their reliability comes from having clear, objective rules: a decisive break of the neckline, ideally with more traders jumping in (increased volume).
These patterns show up all the time across major global markets, with success rates often cited between 60% to 75%, depending on the market and timeframe you're looking at.
By learning to spot these key bearish reversal patterns, you can do more than just avoid losses. You can protect your hard-earned profits and even get ready for new opportunities on the short side of the market. You can master reversal chart patterns to seriously level up your trading game.
Executing The Trade And Managing Your Risk
Spotting a great-looking reversal pattern is a fantastic start, but frankly, it’s only half the battle. Knowing a pattern exists is one thing. Actually pulling the trigger, executing the trade, and managing your money is what separates traders who make consistent profits from those who get whipsawed by false signals.
Think of it this way: identifying a pattern is like having a map. Trade execution and risk management are the rules of the road that get you to your destination safely. Without them, even the best map won't save you from a crash.
Let's bridge that gap. We’re moving beyond the textbook theory and into the practical, disciplined steps you need to turn a pattern on your chart into a well-managed trade.
Pinpointing Your Entry Signal
Your entry is your first real commitment to a trade, so precision is everything. A sharp entry can juice your risk-to-reward ratio right from the start, while a sloppy one puts you on the back foot immediately. For reversal patterns, you really have two main ways to get in.
1. The Aggressive Entry: The Breakout
This is for traders who want to get in on the action early. You enter the moment the price slices through the pattern's neckline. For a bearish Head and Shoulders, you’d short the second a candle closes below that neckline support. For a bullish Double Bottom, you’re going long as soon as it breaks above resistance.
- Pros: You get into the move early, giving you a chance to catch the lion's share of the new trend.
- Cons: You face a higher risk of a “false breakout” or a “head fake,” where the price teases a breakout only to snap right back into the pattern.
2. The Conservative Entry: The Retest
This is the patient trader’s approach. You wait for the initial breakout, and then you watch to see if the price pulls back to retest the very level it just broke. What was support for a Head and Shoulders pattern should now act as new resistance. A successful retest confirms the level has flipped, giving you a much higher-probability entry.
- Pros: Much higher probability of the trade working out, since the retest confirms the breakout is real.
- Cons: The price might just take off without looking back, meaning you could miss the trade entirely if it doesn't give you that retest.
Defining Your Exit Strategy Before You Enter
Successful trading is built on a foundation of discipline, not hope. And that means knowing exactly where you’ll get out—for a win or a loss—before you ever hit the buy or sell button. This part is completely non-negotiable.
Setting Your Stop-Loss
Your stop-loss is your safety net. It's the pre-planned price where you admit the trade idea was wrong, cut your losses, and protect your capital. For reversal patterns, placing your stop-loss is incredibly logical because it's based on the pattern’s own structure.
- For a Head and Shoulders (Bearish): Place your stop-loss just above the high of the right shoulder. If the price moves above this point, your bearish idea is invalidated.
- For a Double Top (Bearish): Your stop should be placed just above the highest peak of the entire “M” formation.
- For an Inverse Head and Shoulders (Bullish): Set the stop-loss just below the low of the right shoulder.
- For a Double Bottom (Bullish): The stop goes just below the lowest point of the “W” formation.
Your stop-loss is not an admission of failure; it is the tool of a professional. It ensures that one bad trade can never wipe out your account, allowing you to survive to trade another day.
Setting Your Profit Target
Just as you need a plan for limiting losses, you need a plan for taking profits. A simple and incredibly effective method for reversal patterns is the measured move objective.
This technique uses the pattern's own height to project a logical price target.
- Measure the vertical distance from the pattern's most extreme point (like the head of a Head and Shoulders) down to the neckline.
- Project that exact same distance down from the point where the price broke the neckline. This gives you a logical, minimum price target for the ensuing move.
This technique provides an objective target based on the market's own volatility, taking emotion out of your profit-taking decisions. As you get more comfortable with these setups, learning how to trade price action in a broader sense will help you fine-tune both your entries and exits with even greater skill.
Using Confluence to Confirm Reversal Signals

Even a textbook-perfect reversal pattern is rarely enough to risk capital on. In my experience, professional traders don't act on a single signal in isolation. We hunt for confluence—a point on the chart where several independent technical signals all tell the same story.
Think of it like building a case. One clue is interesting, but it doesn't solve the mystery. Three clues all pointing to the same suspect? Now you've got something solid.
Trading a reversal pattern without confluence is like trying to navigate a city with just one landmark. You might end up at the right destination, but your confidence will be low, and the chances of getting lost are high. By layering other forms of analysis over your pattern, you filter out the weak, low-probability setups and dramatically improve your odds.
Remember, a reversal pattern is only as good as the trend it's trying to reverse. A Double Top forming after a weak, choppy grind upwards is far less meaningful than one appearing at the peak of a powerful, sustained rally. Always check the health of the preceding trend first.
Building Your Case with Technical Tools
Confluence is about combining the "what" (the reversal pattern) with the "why" and "where" (other technical factors). This moves you beyond simple pattern spotting and into understanding the market's bigger picture.
Here are a few of the most powerful tools I use to build a case for a reversal:
- Moving Averages: A Head and Shoulders pattern is one thing. But when its neckline break happens at the exact same time as a break of the 50-period moving average? That's a much stronger signal. The MA acts as a dynamic line in the sand, confirming the shift in momentum.
- Fibonacci Retracements: Imagine a Double Bottom forming precisely at the 61.8% Fibonacci retracement level of the last major upswing. This tells you a key area of institutional interest is holding firm, adding serious weight to the bullish reversal signal.
- Support and Resistance Zones: A reversal pattern that forms at a major historical price level is always more potent. These are the battlegrounds on the chart where big decisions are made. A reversal here signals a decisive victory for the other side. If you want to get a better handle on these critical areas, check out our guide on supply and demand zones.
Confluence is the art of seeing multiple technical stories converge at a single point on the chart. When a reversal pattern, a key support level, and an indicator signal align, you have a high-probability setup worth your attention and capital.
The Impact of Market Context
The time of day a pattern appears also makes a big difference. Patterns that complete during high-volume, high-liquidity sessions—like the London or New York open—carry more weight simply because more market participants are validating the move.
This isn't just theory; advanced statistical analysis backs it up. For instance, one empirical study of the highly volatile New York trading session found that certain reversal patterns had a confirmation success rate of over 70% when strict confirmation rules were applied.
Ultimately, by demanding confluence, you force yourself to be more selective. You’ll find yourself trading less, but the setups you do take will be backed by a much stronger technical argument. This leads to greater confidence and, in my experience, more consistent results.
Frequently Asked Questions About Reversal Patterns
As you start spotting these patterns on your own charts, you're bound to have some questions. It’s one thing to memorise what a pattern looks like, but it’s another thing entirely to understand what’s happening behind the scenes. This section is all about tackling those common questions to build up your confidence and sharpen your trading edge.
What Is the Most Reliable Reversal Pattern?
While nothing in trading is a sure thing, the Head and Shoulders pattern (and its mirror image, the Inverse Head and Shoulders) is widely seen as one of the most dependable reversal signals out there. The reason it’s so respected is that it tells a very clear, logical story of a trend losing steam.
It’s a favourite among seasoned traders for a few key reasons:
- A Clear Story: The sequence of a high (left shoulder), a higher high (head), and then a lower high (right shoulder) paints a perfect picture of buying power fading away.
- Objective Confirmation: The neckline gives you a clear line in the sand. A decisive break below this level is an unambiguous sign that sellers are now in charge.
- A Built-In "I'm Wrong" Point: The pattern has a natural point of invalidation. If the price breaks the neckline but then rallies back above the right shoulder, the bearish idea is toast. This makes managing your risk incredibly straightforward.
Its success rate tends to be higher than many other patterns, especially when a neckline break happens with a surge in trading volume. That combination of a compelling story and clear signals is what makes it a classic.
How Is a Reversal Pattern Different From a Continuation Pattern?
This is one of the most fundamental concepts in price action, so it's crucial to get it right. Imagine you're on a long road trip. A continuation pattern is like pulling into a rest stop for gas and a coffee break—you’re just pausing before getting back on the highway. A reversal pattern is taking a major exit to head in a completely new direction.
Key Distinction: Reversal patterns signal a trend is likely finished and changing direction. Continuation patterns signal a trend is just taking a breather before continuing its original journey.
Here's a quick way to think about it:
| Feature | Reversal Patterns | Continuation Patterns |
|---|---|---|
| Signal | The current trend is probably over. | The current trend is pausing. |
| Examples | Head & Shoulders, Double Tops/Bottoms | Flags, Pennants, Triangles |
| Trader Action | Get ready for a move in the opposite direction. | Get ready for a move in the same direction. |
So, if you see a Double Top after a strong run-up, it’s a warning that buyers tried and failed twice, and the market could be heading down. But if you see a Bull Flag in that same uptrend, it suggests buyers are just reloading for the next push higher. Knowing which is which is essential for staying on the right side of the market.
Can Reversal Patterns Fail?
Yes, absolutely. And you need to burn this fact into your trading brain. No chart pattern, no matter how picture-perfect it looks, works 100% of the time. Failed patterns and false signals are a normal, everyday part of playing the game.
A pattern "fails" when the price breaks the key level (like a neckline) but then snaps right back, trapping anyone who jumped in on the break. This is the classic "fakeout" or "whipsaw" that catches so many traders off guard.
This is exactly why risk management isn't just a good idea—it's the foundation of your entire trading career.
- Always Use a Stop-Loss: This is your non-negotiable insurance policy. It defines exactly how much you're willing to lose if the pattern fails.
- Wait for Confirmation: Don't just jump on the first tick that breaks the line. A more conservative approach, like waiting for a candle to close beyond the key level, can help filter out a lot of the noise.
- Never Assume: Treat every setup as a probability, not a guarantee.
When you accept that patterns can and will fail, you protect yourself from the emotional and financial fallout of a bad trade. Professionals know that controlling losses is far more important than picking winners.
What Timeframe Is Best for Trading Reversal Patterns?
One of the beautiful things about price action is that it's fractal. These patterns show up on every chart, from the 1-minute all the way up to the monthly. But the timeframe you choose makes a huge difference in the pattern's strength and the move that follows.
As a rule of thumb, patterns on higher timeframes (like the daily, weekly, or monthly) carry much more weight and are generally more reliable.
Here’s why that is:
- More Data, More Conviction: A daily chart pattern is formed over weeks or even months of trading. It represents a massive shift in sentiment involving huge amounts of capital and many more market participants.
- Less "Noise": Lower timeframes are full of random, meaningless price wiggles that can create patterns that look good but mean nothing. Higher timeframes act as a filter, showing you the true, underlying trend.
- Bigger Moves: A reversal on a weekly chart can signal a trend change that lasts for months or years, offering far greater profit potential than a quick intraday scalp.
This isn’t to say you can’t trade them on lower timeframes, but it’s a faster game that demands more skill. If you're just starting out, sticking to the daily and 4-hour charts is a great way to learn. You get a good mix of trading opportunities without all the noise.
At Colibri Trader, we are dedicated to helping you master these concepts through a pure price-action approach. We believe trading success comes from understanding the market's story, not from relying on confusing indicators. Our programs are designed to give you the practical skills and disciplined mindset needed to trade with confidence in any market condition.
Ready to transform your trading performance? Discover your trading potential with our proven methods at https://www.colibritrader.com.