


Trading Journal Spreadsheet: Master Your Trades Like a Pro
Why Your Trading Success Depends on Spreadsheet Journaling

Let's get straight to it: most traders lose money. It's an uncomfortable reality, but a huge number of trading accounts don't get wiped out by one disastrous trade. Instead, they bleed out from a death by a thousand cuts—the same small, avoidable mistakes made over and over again. A trading journal spreadsheet is your best defense against this common fate. It's what separates hopeful gambling from running your trading like a serious business.
The most consistently profitable traders I know treat their spreadsheets as more than just a simple log; it’s a foundational document. Why? Your broker statement only tells you what happened (a profit or loss), but it never explains the why. Relying on mental notes is even worse, as they're easily colored by emotion and memory bias. A detailed journal forces you to be brutally honest with yourself, turning what might feel like random market activity into a series of strategic, data-supported decisions. It becomes your personal playbook, built from your unique wins and losses.
From Random Losses to a Quantifiable Edge
Picture a trader who keeps getting stopped out on what seem to be textbook breakout setups. Without a journal, their gut feeling might be that the strategy is flawed, and they'll likely abandon it. But with a trading journal spreadsheet, they could dig into the data and uncover a crucial pattern.
What if they discovered that 90% of their failed breakouts happened within the first 30 minutes of the market open, when volatility is at its peak? By simply deciding to wait out that initial chaotic period, they could potentially flip a losing strategy into a winner. This is the real power of having your own data.
This isn't just a hypothetical scenario. Disciplined journaling has a measurable positive effect on performance. Some studies indicate that traders who meticulously track their activity can see their win rates climb by up to 20% compared to those who don't. This improvement comes from heightened self-awareness and the ability to systematically fix recurring errors. You can explore more about how a structured approach helps with these trading journal templates and insights.
What Gets Measured, Gets Managed
Think of your journal as more than just a list of entries and exits. It's a living document that shines a light on the things your broker statement can't show you:
- Your True Edge: Which specific setups, times of day, or market conditions are actually profitable for you? The answer often surprises people.
- Psychological Leaks: Do you tend to revenge trade after taking a loss? Do you cut your winning trades short because you're afraid of giving back profits?
- Risk Management Flaws: Are you consistently risking more per trade than your plan dictates? Your journal will hold you accountable.
At the end of the day, your broker statement shows your results, but your trading journal spreadsheet explains them. It’s the tool that lets you stop guessing and start building a real, sustainable edge in the markets. Without one, you’re just flying blind.
Building Your Trading Journal Spreadsheet Foundation

Let's dive in and build a trading journal spreadsheet that actually works for you. This isn't just about record-keeping; it's about creating the central nervous system for your entire trading operation. A powerful spreadsheet does more than just hold data—it helps you organize your thoughts and uncovers hidden patterns in your trading that you would otherwise miss.
The objective is to create a tool that is easy to update after each trade but detailed enough to provide meaningful insights during your weekly or monthly reviews. Many traders get bogged down with overly complex templates they find online. The best approach is to start with a solid foundation of essential data points and build from there.
Core Columns for Actionable Insight
To get started, let's define the absolute must-have columns. While a beginner might just track the ticker and profit or loss, a professional knows that the real value is in the context surrounding each trade. These core columns ensure you're capturing the full story of your trading decisions without making data entry a massive chore.
Think of these fields as the minimum viable structure for turning raw data into an analytical powerhouse. This is what separates a simple log from a professional-grade analysis tool.
Here is a breakdown of the columns I believe are essential for any serious trading journal. Getting these right from the start will save you a lot of headaches later.
Essential Trading Journal Columns and Their Purpose
A comprehensive breakdown of must-have columns for effective trade tracking and analysis
| Column Name | Data Type | Purpose | Example Entry |
|---|---|---|---|
| Trade ID | Unique Number | Allows for easy reference to a specific trade without confusion. | 101, 102, 103 |
| Date | Date | Records the date you entered the position. | 2024-10-28 |
| Ticker | Text | Identifies the asset you traded (e.g., stock, forex pair). | AAPL, EUR/USD |
| Strategy | Dropdown List | Categorizes your trade setup (e.g., Breakout, Reversal, Mean Reversion). | Breakout |
| Entry Price | Currency | The exact price where you opened your position. | $175.50 |
| Exit Price | Currency | The price where you closed your position. | $178.20 |
| Position Size | Number | The number of shares, lots, or contracts traded. | 100 |
| Stop-Loss | Currency | Your pre-defined exit price if the trade moves against you. | $174.00 |
| Profit/Loss | Currency | The final monetary outcome of the trade (can be a formula). | $270.00 |
| R-Multiple | Number | Measures your profit or loss in terms of your initial risk. | 2.5R |
| Notes/Screenshot | Text/Link | Your commentary on the trade, emotional state, or a link to the chart setup. | "Felt confident, clear breakout signal" or a chart link |
This table provides a solid starting point for tracking your trades systematically. By capturing these specific details, you begin to build a rich dataset that you can analyze to improve your performance.
Using a familiar program like Microsoft Excel or Google Sheets, you can create a user-friendly interface to log trades and even automate some of the statistical analysis to find your edge. You can learn more about how this approach helps traders pinpoint strategic weaknesses on TrendSpider.com.
Ultimately, building this foundation is your first step toward transforming raw data into actionable intelligence. For those who want a head start, you might find our guide on a pre-built Excel trading journal template helpful, as it incorporates many of these best practices.
The Metrics That Actually Predict Trading Success
A cluttered trading journal spreadsheet, packed with dozens of metrics, can often be more distracting than helpful. Many traders fall into the trap of tracking vanity metrics—like a high win rate—that feel good but don’t necessarily translate into long-term profitability. True performance comes from understanding the numbers that actually predict future success. Let's cut through the noise and focus on what genuinely matters.
This chart visualizes how different core metrics can tell a more complete story when viewed together.
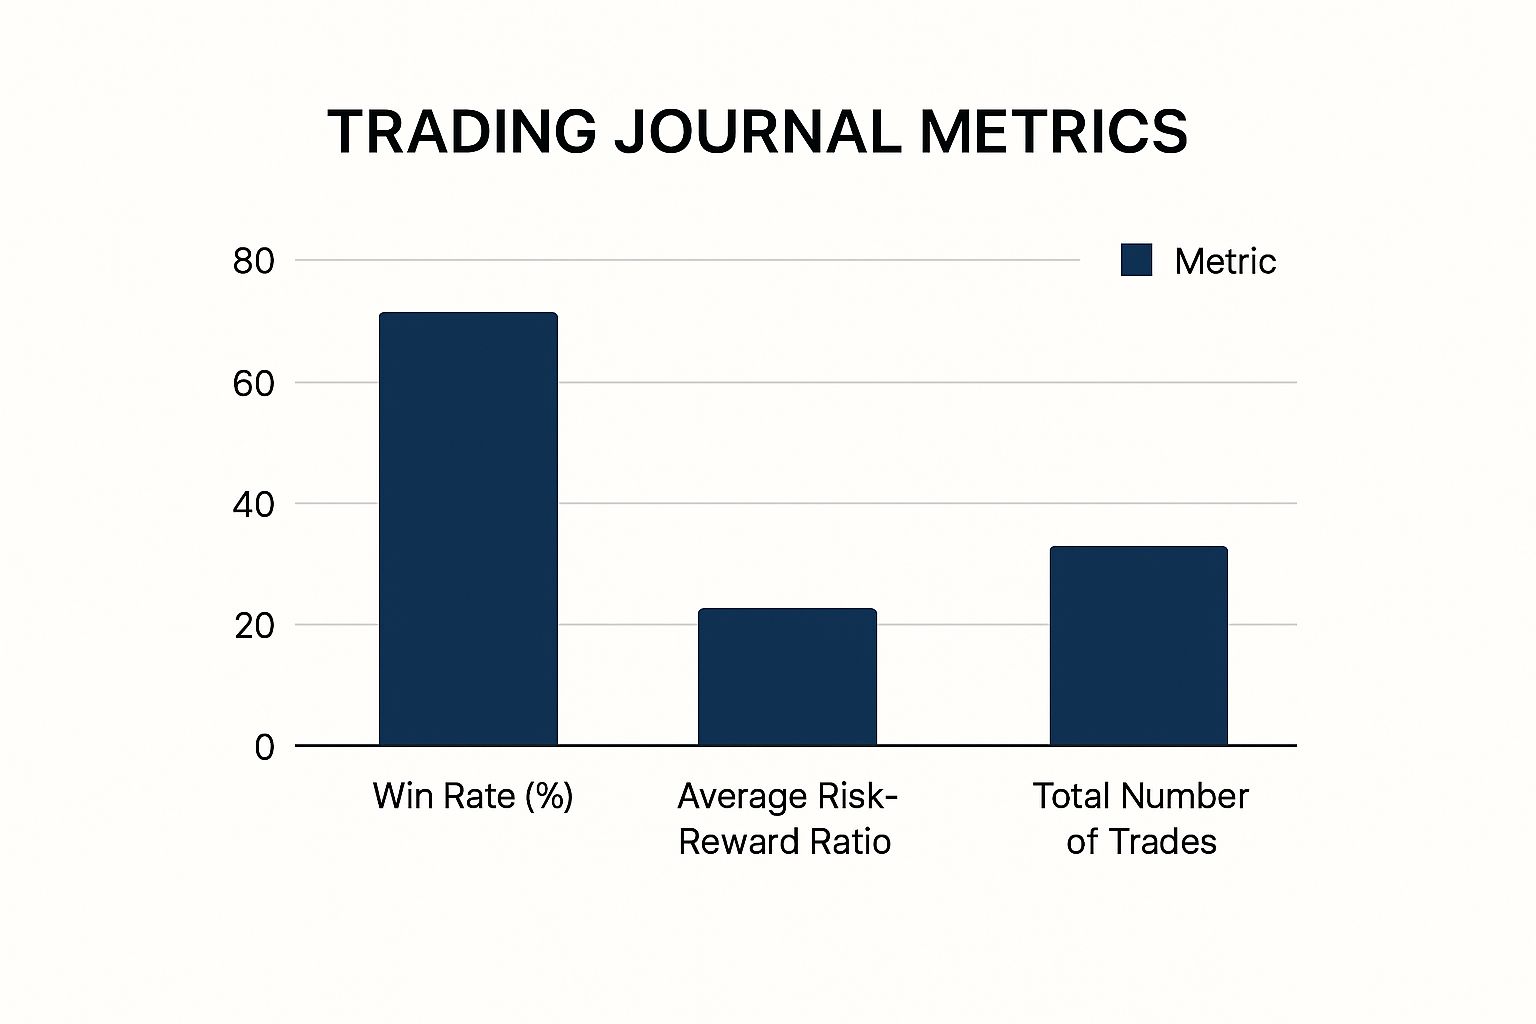
The visualization clearly shows that a high win rate alone doesn't guarantee success if the risk-reward ratio is unfavorable.
Beyond Win Rate: The Metrics of Pros
Instead of obsessing over simply being "right," successful traders focus on a few key performance indicators that reveal the true health of their trading system. These are the metrics you should be calculating and scrutinizing in your trading journal.
To give you a clearer picture, here’s a breakdown of the most important metrics, how to calculate them, and what they really tell you about your trading.
| Metric | Formula | Good Range | What It Reveals |
|---|---|---|---|
| Expectancy | (Win Rate * Avg Win) - (Loss Rate * Avg Loss) |
> 0 |
The single most important metric. A positive number shows your system has a mathematical edge over the long run. |
| Risk/Reward (R/R) Ratio | Potential Profit / Potential Loss |
> 1:2 |
Measures if your potential gains justify the risk. A higher ratio means you can be profitable even with a lower win rate. |
| Profit Factor | Gross Profit / Gross Loss |
> 1.5 |
Shows how many dollars you make for every dollar you lose. A value above 1.0 means you're profitable. |
| Maximum Drawdown | ((Peak Equity - Trough Equity) / Peak Equity) * 100 |
< 20% |
The largest percentage drop from an account peak. It reveals the inherent risk of your strategy and tests your emotional resilience. |
Tracking these metrics gives you a professional-grade overview of your system's performance. You can see at a glance whether your strategy has a true edge or if you're just getting lucky.
Turning Metrics into Actionable Strategy
These numbers aren't just for show; they are your guide for making critical adjustments. For instance, a trader I know noticed his expectancy was barely positive despite a decent win rate. By filtering his trading journal spreadsheet, he found that his R/R on breakout trades was consistently below 1:1. He stopped taking those specific setups, and his overall expectancy doubled.
Another crucial metric is your Maximum Drawdown. This tracks the largest peak-to-trough decline your account has experienced. It’s a vital indicator of risk and emotional resilience. Knowing your system's historical max drawdown helps you prepare mentally and financially for inevitable losing streaks without abandoning a sound strategy.
This data-driven approach is also essential for refining your methods. You can find more on this in our detailed guide on how to backtest a trading strategy, which shows how historical data validates your edge. By focusing on expectancy, R/R, and drawdown, you move from just logging trades to actively managing your performance like a professional.
Customizing Your Journal for Different Trading Styles

A generic, one-size-fits-all trading journal spreadsheet just won't work long-term. Your journal should be a direct reflection of your personal approach to the markets. A day trader firing off dozens of trades before their morning coffee needs a completely different tracking system than a position trader who might only execute a handful of moves each quarter. The real secret is tailoring your data points to match the speed and strategy of your trading style.
For instance, a scalper’s journal should be hyper-focused on things like execution speed, slippage down to the cent, and the exact time of day for each trade. Their entire game is about finding tiny, repeatable edges. On the other hand, a swing trader’s journal will care more about metrics like holding period (in days), how the trade correlated with broader market indices, and if it aligned with a weekly chart setup. Their success is built on capturing larger, multi-day price swings.
Specialized Fields for Different Markets
This need for customization goes beyond your trading timeframe and extends deep into specific markets. Every asset class comes with its own set of unique variables that you absolutely must track to get any meaningful insights.
- Options Traders: A simple profit and loss column is not nearly enough. Your spreadsheet needs dedicated fields for implied volatility (IV) at both entry and exit, the Greeks (like Delta and Theta), and the specific strategy used (e.g., credit spread, iron condor). Understanding how a shift in IV affected your bottom line is often more valuable than just looking at the underlying stock's price change.
- Forex Traders: Key data points must include the trading session (London, New York, Tokyo), the currency pair traded, and the impact of any major news events, like central bank interest rate announcements. A trader might find their strategy is brilliant on EUR/USD during the London open but consistently loses money on USD/JPY during the Asian session.
- Crypto Traders: Looking beyond just price is critical here. Tracking things like on-chain metrics, funding rates for perpetual futures contracts, and exchange-specific fees can reveal where your true edge lies. I know a crypto swing trader who added a simple "narrative" column to note if a token was part of a hot trend (like AI or RWA). This single change dramatically improved his trade selection.
Advanced Tracking for a Deeper Edge
Once your journal is dialed in for your style and market, you can start adding qualitative data to uncover your own behavioral quirks. A powerful technique is to implement a simple trade grading system, from A to F. An 'A' trade isn't just about making money; it's about following your plan perfectly, even if the trade ends up being a loser.
Another great addition is to log your emotional state (e.g., confident, anxious, FOMO) and the overall market condition (e.g., trending, choppy, volatile) when you enter a trade. This data helps you answer crucial questions during your weekly or monthly review. Do you tend to use too much leverage when you're feeling euphoric? Does your strategy fall apart in choppy, directionless markets? A detailed trading journal spreadsheet provides these answers, turning raw data into a clear roadmap for improvement.
Automating Your Journal Without Losing the Human Edge
Manually plugging in the details for dozens of trades every week can feel like a chore. That time spent on repetitive data entry is time you could be using to analyze your performance and fine-tune your strategy. While going fully automated sounds tempting, it can create a disconnect from the real lessons each trade offers. The best approach is a smart balance: automate the boring stuff but keep the crucial human element of self-reflection.
The goal isn't just to save time; it's to build a more effective feedback system. You let your spreadsheet handle the heavy lifting with objective data, while you focus on the subjective insights that spark genuine growth.
Streamlining Data Entry and Calculations
The single most effective automation you can set up is importing trade data directly from your broker. Most trading platforms let you export your history as a CSV file. Instead of typing everything out, you can copy and paste this raw data into a dedicated "Import" tab in your trading journal spreadsheet. From there, formulas like VLOOKUP or INDEX/MATCH can automatically populate key details like entry price, exit price, and position size into your main log.
For active traders, this one change can cut down journaling time by over 70%. It also wipes out typos and ensures your foundational data is always correct. With the basics handled, you can then automate your performance metrics:
- Profit/Loss: A simple formula like
(Exit Price - Entry Price) * Position Sizegives you an instant result. - R-Multiple: Calculate this by dividing your Profit/Loss by your initial risk, which is
(Entry Price - Stop Loss Price) * Position Size. - Live P&L Tracking: For any open positions, you can use built-in functions in programs like Google Sheets to pull in live market prices.
Keeping the Human Touch Where It Counts
While automation tells you what happened, your manual entries must explain why. This is where your real trading edge develops. Even with automated data, you need to personally log the qualitative side of each trade. After all, mastering trading psychology is often what separates struggling traders from consistently profitable ones.
Journaling has evolved significantly since traders first started using spreadsheets in the 1990s. Today, a modern trading journal can track complex metrics and even integrate live price feeds, making the process incredibly powerful. You can read more about the evolution of these tools and their effect on modern trading analysis at stockbrokers.com.
This is why, next to your automated data columns, you should always have a "Notes" or "Reflections" column to answer important questions:
- Why did I take this trade?
- Was I following my plan, or was it an impulsive decision?
- What was my emotional state at the time? (e.g., Confident, Anxious, FOMO)
Fusing efficient data management with mindful self-reflection is the key. It creates a powerful feedback loop where you're not just logging numbers but actively engaging with your thought process. This turns your journal from a simple calculator into a tool for deep learning. To improve your mindset, check out these practical tips on mastering trading psychology.
Transforming Data Into Profitable Trading Decisions
A beautifully kept trading journal spreadsheet is nothing more than a data graveyard unless you actually use it to shape your future trades. The magic isn't in logging what you did; it's in the review process where those raw numbers turn into profitable insights. This is how you stop looking at just P&L and start understanding the why behind your wins and losses, which builds real confidence in your trading strategy.
Your goal should be to set up regular, structured reviews. A monthly check-in is great, but a quarterly deep dive is absolutely essential. This isn't about a quick glance at your bottom line. It’s about digging into your data, asking tough questions, and getting honest answers.
Conducting Your Monthly Performance Review
Treat your monthly review like a debrief with your most important team member: yourself. The mission is to find your best, high-probability trading scenarios and cut out the ones that are bleeding your account dry. Start by using your spreadsheet’s sorting and filtering tools to see what patterns emerge.
- Find Your Golden Hours: Filter all your trades by the time of day they were executed. You might find that your strategy works wonders between 10:00 AM and 11:30 AM but falls apart in the afternoon chop. I once worked with a trader who discovered that simply avoiding the first 30 minutes of the market open cut his drawdown by nearly 50%.
- Identify Your Best Setups: Sort your data by the "Strategy" or "Setup" column. Which patterns are giving you the highest average R-multiple? Maybe your "Breakout" strategy has a high win rate but a low profit factor, while your "Mean Reversion" trades happen less often but are far more profitable. This tells you exactly where to focus your energy and capital.
- Spot Emotional Triggers: Go back and look at the notes you made for your biggest losing trades. Do you see a pattern of words like "FOMO," "revenge trade," or "impulsive"? Recognizing these emotional habits is the first step toward controlling them. One case study showed a trader managed to double his win rate by creating a simple rule: walk away from the screen for an hour after any trade made out of emotion.
From Insights to Actionable Improvements
Once you’ve spotted these patterns, the next move is to turn them into solid rules for the month ahead. For instance, if your data clearly shows that taking trades against the daily trend has a negative expectancy, your new rule might be, "I will only take trades that align with the direction of the daily 20 EMA."
This kind of systematic review turns your trading journal spreadsheet from a passive record into an active performance coach. It’s how you stop making the same mistakes, adjust your position sizing to favor your best setups, and build the data-driven confidence that sets consistently profitable traders apart from the rest of the pack.
Your Complete Trading Journal Success Blueprint
Having a great trading journal spreadsheet is one thing, but actually using it consistently is what separates successful traders from the rest. You need a clear plan to make journaling a core part of your trading routine. This is your blueprint for building a system that you'll stick with, especially when a losing streak hits and your motivation disappears. The idea is to turn sporadic log entries into a powerful habit that truly strengthens your trading.
Overcoming Common Journaling Obstacles
Most traders who start a journal give up within a few weeks. It's usually because they hit one of two major roadblocks that feel impossible to get past.
The first is data overwhelm. You open your spreadsheet and see a wall of numbers. What does it all mean? This often leads to analysis paralysis, where you're so overwhelmed you do nothing. The solution is to start small. During your weekly review, focus on just one or two key metrics. This could be your average R-multiple for a specific strategy or your win rate during the morning session. Don't try to fix everything at once.
The other big problem is inconsistent logging, which almost always happens during a drawdown. It's tough to document your losses day after day, so many traders just stop. To fight this, you need to reframe what your journal represents. It’s not a record of your failures; it's your primary tool for recovery. Make it the very first thing you do after a losing day. This simple mental shift turns a painful task into a proactive step toward getting back on track.
Creating a System That Endures
To build a lasting habit, you need to set realistic goals. For your first month, your only goal should be to log every single trade without fail. That's it. No deep analysis, just pure consistency.
In your second month, schedule a 30-minute review session each week to find your single most common mistake. By the third month, you can start using that data to make small, informed tweaks to your trading plan. This gradual approach prevents you from feeling overwhelmed and builds momentum.
Your journal also becomes a powerful confidence booster. When you're on a winning streak, your notes and screenshots create a library of your best work. This library reinforces what a high-quality trade setup looks and feels like, making it easier to replicate.
As your trading skills improve, your journal should evolve with you. If you start trading a new setup, add columns to track its specific performance. This blueprint ensures your trading journal spreadsheet grows alongside you, becoming a dynamic partner in your trading journey.
Ready to build a trading system based on discipline and proven price action? At Colibri Trader, we focus on helping you develop the skills and mindset that lead to consistent results. Discover your trading potential with our free quiz and start your journey today.