


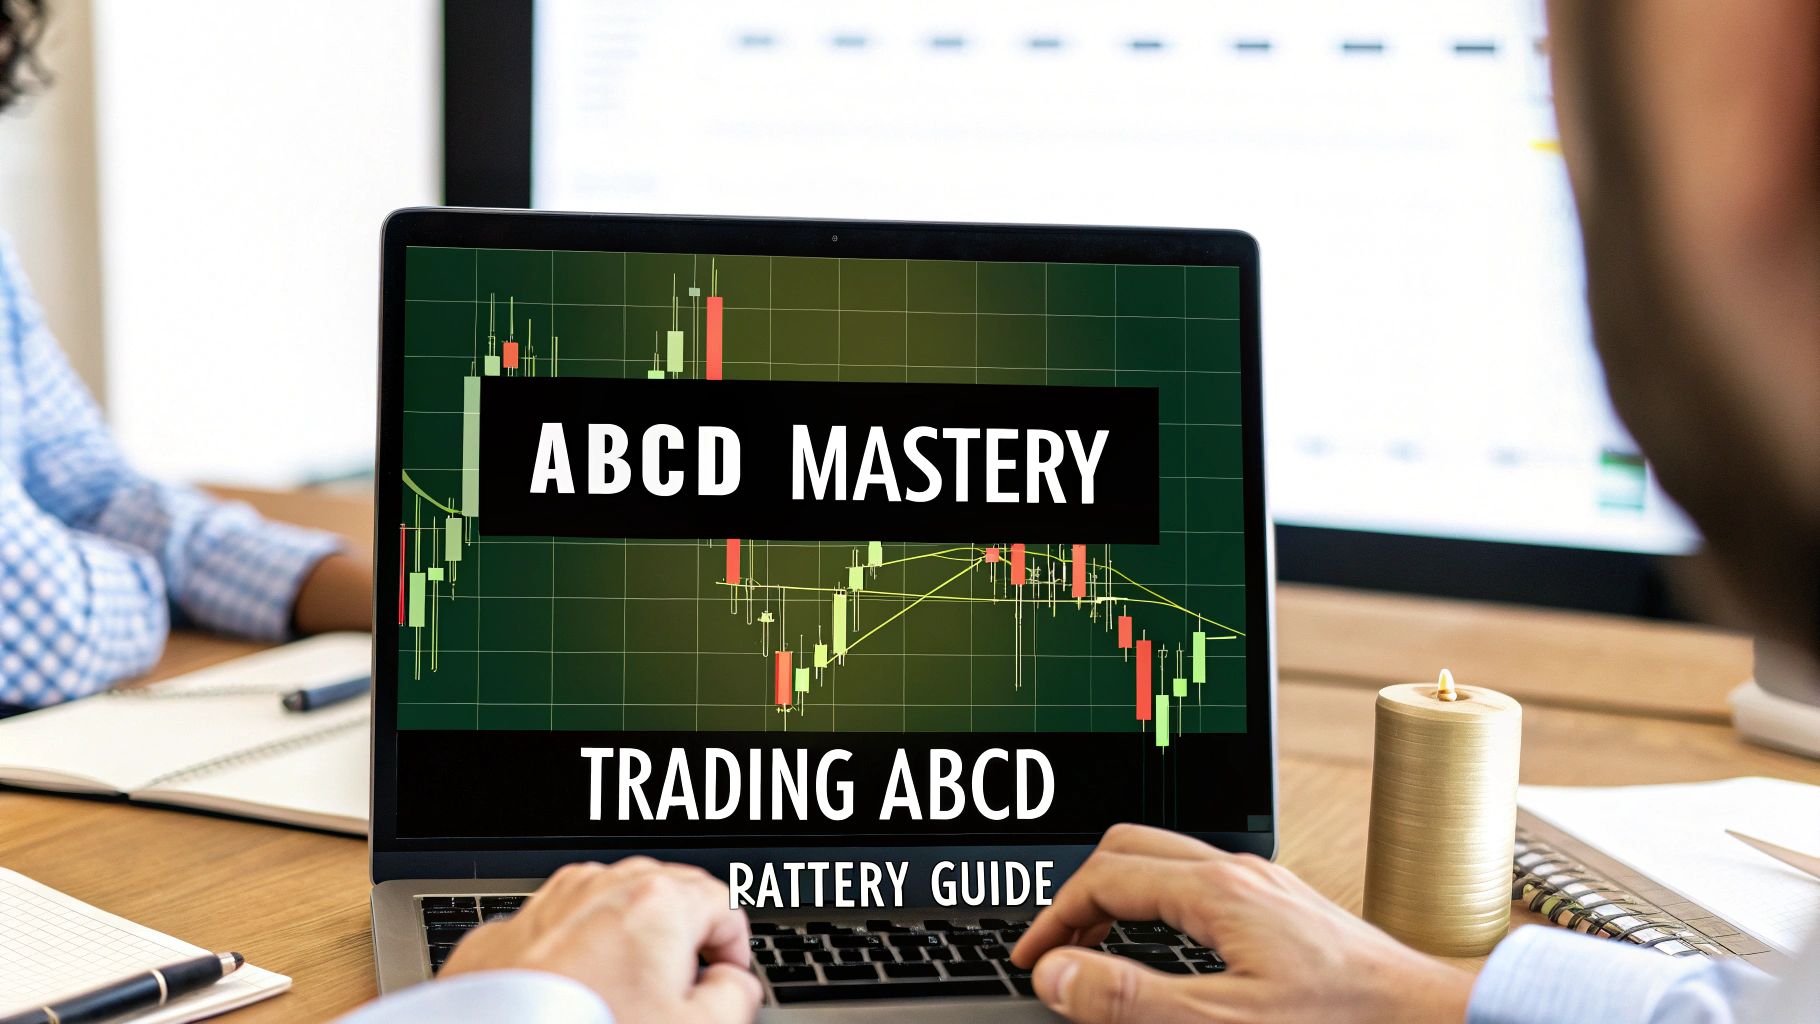
Master the Trading ABCD Pattern: Your Complete Guide
Understanding Why the Trading ABCD Pattern Actually Works
Have you ever looked at a price chart and wondered why some movements seem to repeat with such predictable rhythm? The trading ABCD pattern isn't just a random squiggle; it's a visual story of market psychology in action. Think of it as a choreographed dance between buyers and sellers, where their collective decisions create the four distinct points that give the pattern its name. At its heart, this simple pattern reveals the constant battle between greed and fear that powers every market shift.

The Psychology Behind the Points
The true strength of the ABCD pattern comes from how it mirrors human behavior. Each segment, or "leg," of the pattern represents a specific phase of market feeling:
- A to B: This is the initial, powerful move. It shows strong belief from either buyers pushing the price up or sellers forcing it down. It’s the first clear signal that a group has taken control.
- B to C: Here, the market takes a breath. Early winners start taking profits, and traders betting against the trend step in. This causes a partial pullback, or retracement. The size of this pullback is a major clue about the strength of the initial AB move.
- C to D: If the first trend was genuine, new traders who missed the initial move now jump in. This leg often mirrors the length and intensity of the first AB leg as momentum picks back up. The pattern completes at point D, which is where savvy traders begin to look for signs of exhaustion and a potential price reversal.
More Than Just Geometry
Experienced traders view ABCD patterns less as a rigid technical indicator and more as a psychological roadmap. Grasping the "why" behind each leg is what helps you spot setups with a higher probability of success. The pattern is well-known for signaling both trend continuations and major reversal points, and it's grounded in specific mathematical relationships from Fibonacci theory.
For example, a classic ABCD pattern often shows the AB and CD legs being roughly equal in length. The BC retracement frequently pulls back to key Fibonacci levels, like 61.8% or 78.6% of the AB leg. You can find more on these specific measurements in this in-depth guide on the ABCD pattern. These geometric relationships aren't a coincidence; they appear across all markets and timeframes because they are based on the core principles of how markets move. To explore this concept further, check out our guide on understanding market structure.
The Mathematical Magic Behind ABCD Success
The power behind the ABCD trading pattern isn't random chance; it's rooted in a series of predictable mathematical relationships. These numbers are the famous Fibonacci ratios, the same proportions found throughout the natural world—from the elegant spiral of a galaxy to the petals on a flower. Their consistent appearance on price charts suggests they are deeply connected to the rhythm of market psychology, influencing how traders react to price swings.
This isn't just an abstract theory; it's a measurable force in the markets. By understanding these numbers, you can begin to see the underlying structure behind what looks like chaotic price action.
The Golden Numbers of Trading
When experienced traders spot an ABCD pattern, they aren't just looking at a simple zig-zag shape. They are measuring the precise mathematical relationship between each leg of the pattern. These ratios are what help distinguish a high-probability setup from mere market noise by providing a clear framework for market sentiment.
Here’s a breakdown of the core measurements:
- The BC Retracement: This is the critical pullback after the initial move. Following the AB impulse, the BC leg typically retraces 61.8% or 78.6% of the AB leg's length. These specific levels often act like magnets for price, as they represent common areas for profit-taking and counter-trend entries. A shallow retracement might suggest a strong underlying trend, while a deeper one could indicate a loss of momentum.
- The CD Projection: After the BC retracement finds support or resistance at a key Fibonacci level, the final CD leg begins its journey. Traders then project where this leg is likely to complete. The most common targets are the 127.2% and 161.8% Fibonacci extensions of the BC leg. When price reaches these zones, it signals the pattern's completion and flags a high-potential reversal area.
To help you measure these relationships, here's a detailed table outlining the key Fibonacci ratios and their significance.
| Pattern Element | Typical Fibonacci Ratio | Market Behavior | Entry Signal |
|---|---|---|---|
| BC Retracement | 61.8% of AB | A moderate pullback, often seen in strong trends. Indicates bulls or bears are still largely in control. | Potential entry for traders anticipating the trend to resume. |
| BC Retracement | 78.6% of AB | A deeper pullback, signaling significant counter-trend pressure or profit-taking. | A more decisive reversal point, offering a clearer signal for the CD leg's start. |
| CD Projection | 127.2% of BC | A common and reliable target for the pattern's completion. | Strong signal that the pattern is complete and a reversal is imminent. |
| CD Projection | 161.8% of BC | A more extended target, often occurring in highly volatile or strongly trending markets. | An extreme completion point, often leading to a sharp and fast reversal. |
| ABCD Pattern Fibonacci Relationships | |||
| Key Fibonacci ratios used in ABCD pattern measurements and their typical market applications |
The table makes it clear that each ratio points to a specific type of market behavior, helping you gauge the strength and potential of a developing pattern.
The infographic below visualizes how these critical ratios appear on a real chart.
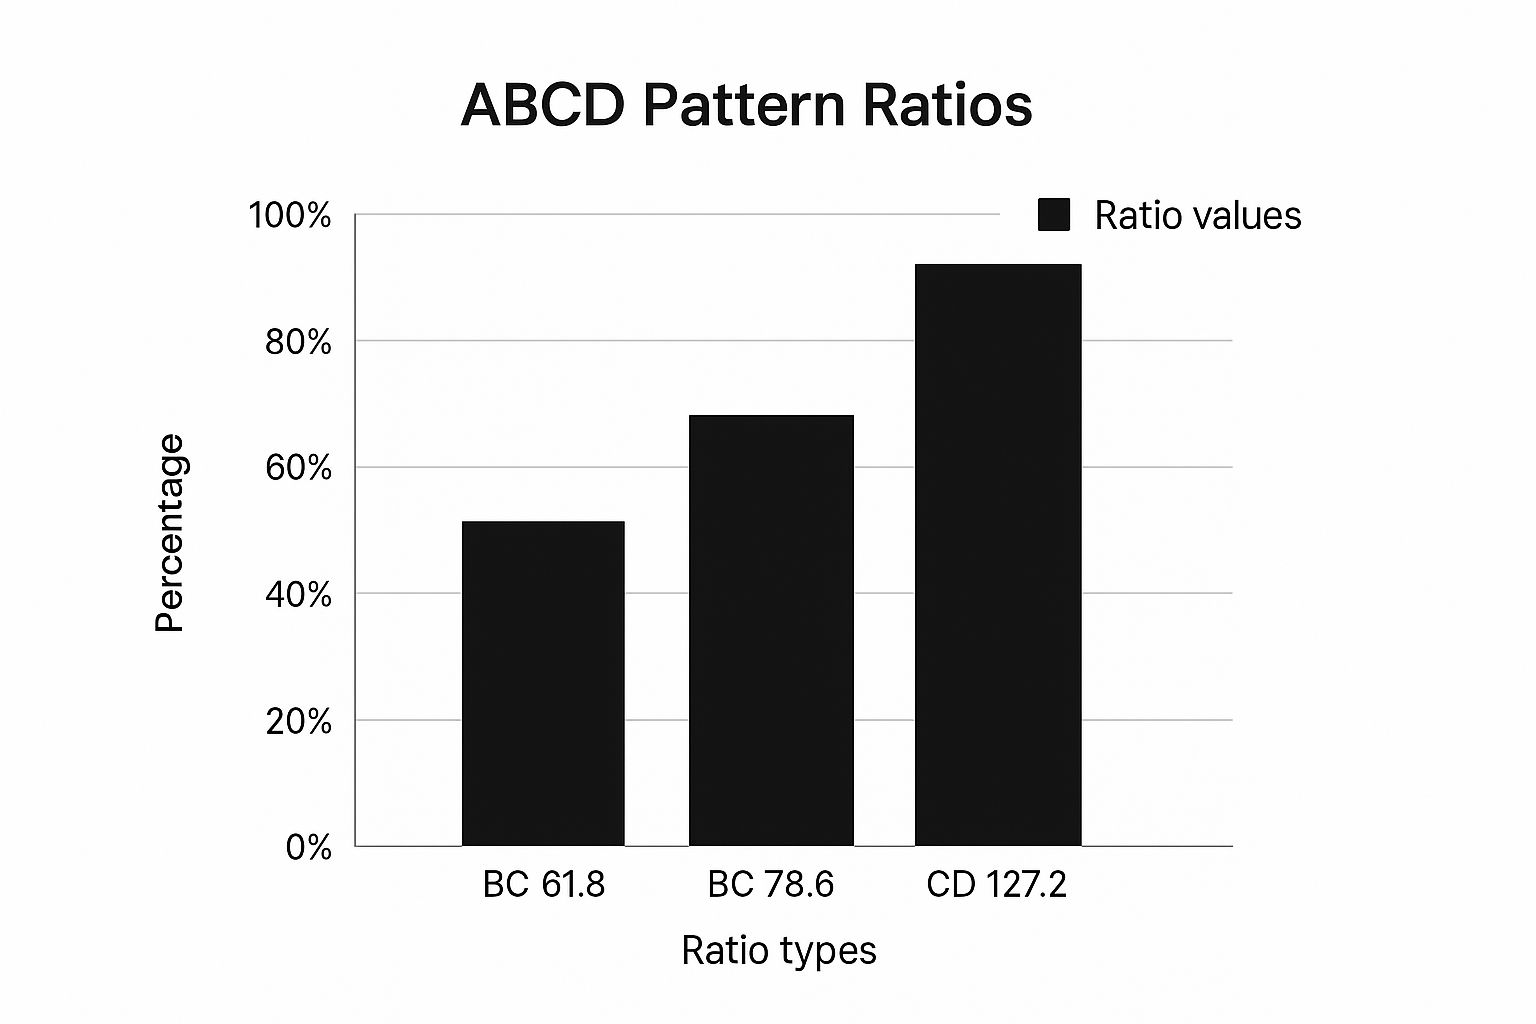
This visual shows that the CD leg's extension is often much larger than the BC retracement, which highlights the significant profit potential available in the pattern's final move.
Why Does It Work?
Interestingly, these mathematical relationships often become a self-fulfilling prophecy. As countless traders and institutional algorithms place buy and sell orders based on these exact Fibonacci levels, their combined actions create the very support and resistance they were anticipating. This collective behavior reinforces the pattern's reliability.
Of course, no pattern is perfect. Confirming its historical performance on the assets you trade is a vital step in building a solid strategy. To get started, you can learn more about how to backtest a trading strategy to validate these Fibonacci relationships for yourself. Mastering these measurements takes you from simply seeing a shape on a chart to truly understanding the market forces that drive it.
Spotting Hidden ABCD Patterns Before Others Do
Great traders don't just find ABCD patterns; they anticipate them. They see the structure forming while others are still looking at past price action. Developing this kind of foresight means going beyond simply spotting a zig-zag shape and learning to read the subtle clues that show up long before the pattern completes at point D.

This screenshot from TradingView shows a bearish trading abcd pattern in its early stages. Points A, B, and C are clearly formed. At this point, a sharp trader can begin to project the potential reversal zone where point D might appear.
Reading the Story Beyond the Chart
To spot a high-quality ABCD pattern early, you need to understand the strength behind each price move. The goal is to look for a certain harmony and rhythm in the price action.
- Analyze the AB Leg: How did the initial move look? Was it decisive and backed by strong volume? A powerful, confident AB leg often points to institutional interest and suggests the trend has real conviction. A weak, choppy AB leg is usually a red flag for a false setup.
- Evaluate the BC Retracement: The ideal retracement lands near the 61.8% or 78.6% Fibonacci levels. Volume is critical here. Ideally, volume should taper off during the BC pullback, which signals that the counter-move is losing steam. If volume spikes during the retracement, it might mean the pattern is invalid.
- Assess the Angle of Approach: The angles of the AB and CD legs should be relatively similar. If the CD leg is much steeper or flatter than the AB leg, it can suggest a shift in market dynamics, making the pattern less reliable. Symmetry is a sign of a healthy, predictable pattern.
Avoiding Common Identification Traps
One of the biggest mistakes traders make is trying to force a pattern onto a chart where one doesn't really exist. If you have to squint and stretch the lines to make it fit, it's not a high-probability trade.
Another expensive error is entering a trade too early, before the CD leg has finished its move and shown clear signs of reversal at point D. Patience is an essential skill.
By combining the geometric rules with a careful analysis of volume and momentum, you can learn to tell the difference between solid ABCD patterns and the imposters that trap inexperienced traders. This skill is what separates professionals who consistently profit from these setups from those left chasing the market.
Perfect Timing: When and How to Enter ABCD Trades
Identifying a textbook ABCD pattern is a great start, but spotting it means nothing without a well-timed execution. This is the moment where theory meets reality. Your success hinges on your ability to enter and exit trades at the right time. The most critical point is D, where the pattern completes.
Rushing an entry at Point D is a common and costly mistake. Patience is your greatest asset here. You need to wait for the market to confirm it has hit a bottom (in a bullish ABCD) or a top (in a bearish one) before you commit.
Entry Strategies: Aggressive vs. Conservative
Once the CD leg approaches the projected completion zone—typically the 127.2% or 161.8% Fibonacci extension—you have two main ways to enter the trade. Your choice will come down to your personal risk tolerance and trading style.
- Aggressive Entry: This approach involves placing a limit order directly at the calculated Point D. The major benefit is securing the best possible price if the market reverses exactly as predicted. The downside? If the trend continues, the price can blow right past your entry, resulting in an immediate loss.
- Conservative Entry: This strategy is all about waiting for confirmation. Instead of trying to pinpoint the exact reversal spot, you wait for the price to hit the D zone, turn around, and show evidence of a new trend. This proof could be a specific candle formation, like a hammer or shooting star, or a break of a small counter-trendline. Your entry price won't be as good, but your trade has a higher chance of success because you've seen the reversal start to happen.
Setting Profit Targets and Exits
Knowing where to get out of a trade is just as important as knowing where to get in. Simply setting an entry and hoping for the best rarely leads to consistent results. A much more structured method is to establish multiple profit targets. For a bullish ABCD trade (where you buy at D), you can set your initial take-profit orders at key Fibonacci retracement levels of the entire A-to-D move. Common targets include the 38.2%, 50%, and 61.8% levels.
As the price reaches your first target, you can close a part of your position and adjust your stop loss to your entry price (break even). This action locks in some profit and makes the rest of the trade risk-free, letting you ride the new trend for more potential gains. This disciplined exit plan is a key part of a solid trading abcd pattern strategy.
Historical data shows the value of this structured approach. One study found that traders who used the ABCD pattern within a defined plan saw a 20–25% median boost in their consistency. It's also interesting that 78% of successful signals on shorter timeframes happened within the first two hours of the trading session. You can see more on these findings about day trading the ABCD pattern for further insight.
Protecting Your Capital When ABCD Patterns Fail
Even the most picture-perfect trading abcd pattern can fall apart. This isn't a flaw in your strategy; it's just the unpredictable nature of the market. The real difference between traders who make consistent gains and those who don't isn't avoiding losses—it's having a strict plan to manage them. Your number one job as a trader is to protect your capital. The profits are simply the reward for doing that job well.

The Built-in Safety Net: Stop-Loss Placement
A powerful aspect of the ABCD pattern is how its geometry gives you a natural, logical place for your stop loss. There's no need to guess or rely on an arbitrary percentage. Your stop loss should be placed just beyond Point D, which is where the pattern officially completes.
Think of Point D as your line in the sand. If the market pushes decisively past this level, the very reason you entered the trade—the successful formation of an ABCD pattern—is gone. Placing your stop just outside this structural point gives the trade a little room to fluctuate without letting a bad trade turn into a catastrophic loss. This simple rule ties your risk directly to the pattern's validity.
Smart Sizing: Adjusting Risk to the Setup
Not all ABCD patterns are created equal. A one-size-fits-all position size is a fast track to trouble. Your trade size should always reflect the quality of the pattern and the broader market conditions. The best traders are adaptable, adjusting their risk based on what the chart tells them.
To help with this, you can use a clear framework to decide how much to risk on any given trade. This table outlines how to connect your position size directly to the quality of the ABCD setup.
ABCD Risk Management Framework
Complete risk management guidelines for different ABCD pattern scenarios and market conditions
| Pattern Quality | Position Size | Stop Loss Placement | Risk/Reward Ratio |
|---|---|---|---|
| High-Quality (Perfect Fibonacci ratios, strong volume confirmation) | Standard (e.g., 1% of account) | Tight, just beyond Point D | Aim for at least 1:3 |
| Average-Quality (Slight deviation in ratios, average volume) | Reduced (e.g., 0.5% of account) | Slightly wider, allows for more volatility | Acceptable at 1:2.5 |
| Low-Quality (Significant ratio deviation, weak volume) | Minimal or No Trade | Wide (risky) or Avoid | Often below 1:2, not ideal |
When you spot a textbook pattern with confirming signals, you can confidently apply your standard risk. If the pattern is less than ideal, you scale back your exposure. For those interested in a deeper look, you can learn how to manage trading risk with proven strategies that actually work. This disciplined approach ensures that a single failed trade won't wipe out your account, keeping you in the game to catch the next big winner.
Advanced ABCD Variations That Multiply Your Opportunities
Once you have a solid handle on the classic ABCD trading pattern, you can explore more intricate variations that show up regularly in the markets. Getting to know these more complex forms can help you spot trading opportunities that many others overlook, giving you a valuable edge. These advanced patterns are built on the same core ideas but bring in new geometric and structural twists.
The ABCD Extension Pattern
One of the most notable variations is the ABCD Extension. In a standard ABCD pattern, the AB and CD legs are often roughly the same length. With an extension, however, the CD leg stretches much further, often hitting the 1.618 or even 2.618 Fibonacci extension of the preceding BC leg.
These setups tend to appear in markets with strong trends and high momentum. While they might look like the trend will never end, they often signal powerful and fast reversals. For traders who can identify them, these patterns present opportunities for significant gains.
Nested Patterns and Confluence
Some of the highest-probability trade setups appear when smaller patterns form within the structure of larger ones. For instance, you might spot a small, bullish ABCD pattern completing at the exact same price level where a much larger bearish pattern, like a Gartley or Butterfly, is also finalizing its structure. This is known as a nested pattern.
The real power emerges when several technical signals point to the same price level, creating a confluence zone. Imagine an ABCD pattern finishing at a price that also aligns with:
- A major historical support or resistance level.
- A bullish divergence signal on an indicator like the RSI.
- The completion point of another harmonic pattern.
When these signals converge, the probability of a successful trade increases substantially. The image below shows the basic ABCD pattern, which serves as the foundation for these more advanced variations.
This visual shows the simple zig-zag shape you'll see again and again, often in more complex arrangements, in real market conditions.
Adapting to Different Markets
It's important to remember that every market has its own personality. An ABCD extension that shows up frequently in a volatile cryptocurrency pair might be a rare sight in a stable, blue-chip stock. Skilled traders learn to tweak their measurements and expectations based on the asset they are analyzing.
For example, forex pairs might stick more closely to specific Fibonacci ratios, whereas commodities could exhibit wider, more dramatic swings. By pairing pattern recognition with tools like volume analysis, you can refine your strategy for any market, making these advanced patterns a reliable part of your trading approach.
Your Complete ABCD Trading Action Plan
Turning chart knowledge into a reliable trading income requires a methodical plan that takes emotion and guesswork out of the equation. This guide breaks down the process of trading the ABCD pattern into clear, actionable steps. Following a structured approach like this is what separates disciplined traders from those who just get lucky.
Checklist 1: Pattern Identification and Qualification
Before you even think about putting capital at risk, your potential setup needs to pass a strict inspection. A weak or unclear pattern is nothing more than a high-risk gamble. Consider printing this checklist and keeping it at your trading station.
- Geometric Clarity: Is the A-B-C-D structure obvious and easy to spot without forcing it? If you have to squint or guess, it’s not a valid setup.
- Fibonacci Alignment: Does the BC leg retrace to a key Fibonacci level of the AB leg? Ideally, this will be between 61.8% and 78.6%.
- Projection Zone: Does the projected end of the CD leg land near the 127.2% or 161.8% Fibonacci extension of the BC leg?
- Volume Confirmation: Did trading volume decrease during the BC retracement? This is a great sign, suggesting the pullback is losing steam and the original trend is likely to continue. A spike in volume on the BC leg is a major red flag.
Checklist 2: Entry and Trade Management
Once a pattern passes the initial check, your execution is what matters most. This checklist helps you enter with precision and manage the trade like a professional, protecting your capital while aiming for solid profits.
- Entry Confirmation at Point D: Have you waited for a confirmation signal at the D completion point? This could be a specific reversal candlestick, like a hammer or a shooting star, or a break of a small, local trendline. Never enter a trade based on prediction alone.
- Stop-Loss Placement: Is your stop loss placed logically just beyond Point D? If the price breaks past this level, the pattern is invalidated, and you should exit the trade with a small, manageable loss.
- Profit Targets Set: Have you identified initial profit targets at key Fibonacci retracement levels of the entire A-to-D move? Common targets are the 38.2% and 61.8% levels.
- Risk-to-Reward Ratio: Does the trade offer a minimum risk-to-reward ratio of 1:2? If the potential profit doesn't at least double the risk, the trade may not be worth taking.
Mindset and Continuous Improvement
Ultimately, long-term trading success isn’t just about checklists; it’s about your psychology and your commitment to getting better. Maintain discipline, whether you are on a winning or a losing streak.
Keep a detailed trading journal. For every ABCD trade, save screenshots and write notes on why it succeeded or failed. This practice is essential for spotting your personal strengths and weaknesses. It will help you learn when to be more confident and scale up your position size based on proven performance, not just a gut feeling.
This structured plan is your roadmap to mastering the ABCD pattern. If you're ready to build on this foundation with a complete, indicator-free trading methodology, explore the price action courses at Colibri Trader.