


How to Trade With Trend Using Price Action
To successfully trade with trend, you synchronize your plan with the market’s prevailing current—because swimming upstream rarely ends well. It starts with spotting sustained price swings fueled by the heavy hitters in the market and then using nothing more than pure price action to time your entries and exits. No clutter, no guesswork—just the essentials that really move the needle.
Why Trading With The Trend Is Your Greatest Edge

Most traders drown themselves in dozens of indicators and half-baked chart patterns. They chase the “secret formula,” only to find conflicting signals at every turn. In truth, the simplest path often holds the greatest edge: ride the wave instead of battling it.
Underneath those moves lies institutional capital—banks, hedge funds, big corporations—pushing prices for days or even months on end. Squaring off against that kind of force is a recipe for higher risk and smaller gains.
The Power Of Pure Price Action
Stripping your charts back to raw candlesticks is how you see that institutional flow with crystal clarity. When you let price speak for itself, you cut through the chatter and focus on what really matters: supply and demand in motion.
- Clarity And Simplicity: Decisions rest on the unfiltered story of price, trimming analysis paralysis.
- Early Signal Detection: Price action often flashes sentiment shifts before any lagging tool can catch up.
- Universal Application: These principles hold across markets and timeframes—they’re driven by human behavior, not fancy formulas.
The goal is not to predict the future but to react to what is happening right now. A trend in motion is more likely to stay in motion, and price action gives you the clearest map to follow that motion.
Adopting this mindset changes everything. You go from guessing where the market might wander to positioning yourself in a current already in full flow. That shift is the cornerstone of a consistent, lower-stress trading career. In the next sections, you’ll find a detailed, step-by-step guide on how to make it happen.
Identifying The Dominant Trend Using Pure Price Action
If you want to trade with the trend, you have to see it clearly first. That means stripping away all the clutter and lagging indicators. Pure price action—the raw movement of price on a chart—is the only real source of truth. It cuts through the noise and shows you the underlying market structure being built by buyers and sellers.
At its heart, spotting a trend is just about watching the sequence of peaks and troughs, what we call swing highs and swing lows. Getting this right is the foundation of any solid price action strategy. For a deeper dive into these core ideas, you can learn more about what is price action trading and see how it simplifies your whole approach to the markets.
The Anatomy Of An Uptrend
An uptrend has a very specific signature: a clear, sustained pattern of higher highs (HH) and higher lows (HL). I like to think of it as climbing a staircase. Each step up is a new high, and each landing is a higher resting point than the one before it.
- Higher Highs: Every new peak on the chart pushes beyond the previous one. This is a clear signal that buying pressure is strong and the market has the momentum to explore new territory.
- Higher Lows: After hitting that new high, the price will pull back, but it finds support at a level above the prior low. This is huge. It confirms that buyers are jumping in earlier and with more confidence than before.
When you see this HH and HL sequence playing out over and over, you have your visual confirmation. The market is screaming that the path of least resistance is upwards.
The Structure Of A Downtrend
On the flip side, a downtrend is marked by a series of lower highs (LH) and lower lows (LL). This pattern looks like a controlled descent down a hill, where sellers are consistently overpowering buyers at lower and lower price points.
A downtrend takes shape when:
- Price carves out a new trough that is below the previous one, giving us a lower low.
- The rally that follows fizzles out before it can take out the last peak, establishing a lower high.
This one-two punch signals persistent selling pressure. Every time the market fails to make a new high, it shows that sellers are wrestling back control sooner, ready to push prices down again. For a wider view of the principles behind this kind of charting, A Guide to the Technical Analysis of Stocks is a valuable resource that covers these fundamental concepts.
Pro Tip: Don't get faked out by one or two swings. A real, tradable trend needs to show you a series of at least two higher highs and two higher lows (or the opposite for a downtrend) before you can consider it established. Anything less than that might just be market noise.
What about markets that fail to create this orderly structure? They're usually moving sideways, or "ranging." In these conditions, neither buyers nor sellers are in control. Trying to trade a trend that isn't there is a recipe for frustration. The key is to have the patience to wait for the market to show its hand through this unmistakable price action structure.
Confirming Trend Strength And Finding Your Entry
Spotting a trend is one thing; knowing how to trade it is another entirely. This is where most traders trip up. The real discipline in learning to trade with trend is finding a solid entry point without chasing the price.
Chasing a breakout is a rookie move. It leads to buying the top or selling the bottom, usually moments before the market snaps back in the other direction. A pro waits. You let the market come to you.
The best entries almost always happen during a pullback—a temporary move against the dominant trend. In an uptrend, that’s a dip. In a downtrend, it’s a rally. Think of these as the market catching its breath before the next big push. They give you a chance to get in at a much better price, tightening your risk and boosting your potential reward.
This simple flowchart can help you visualize how to separate a real trend from all the market noise.
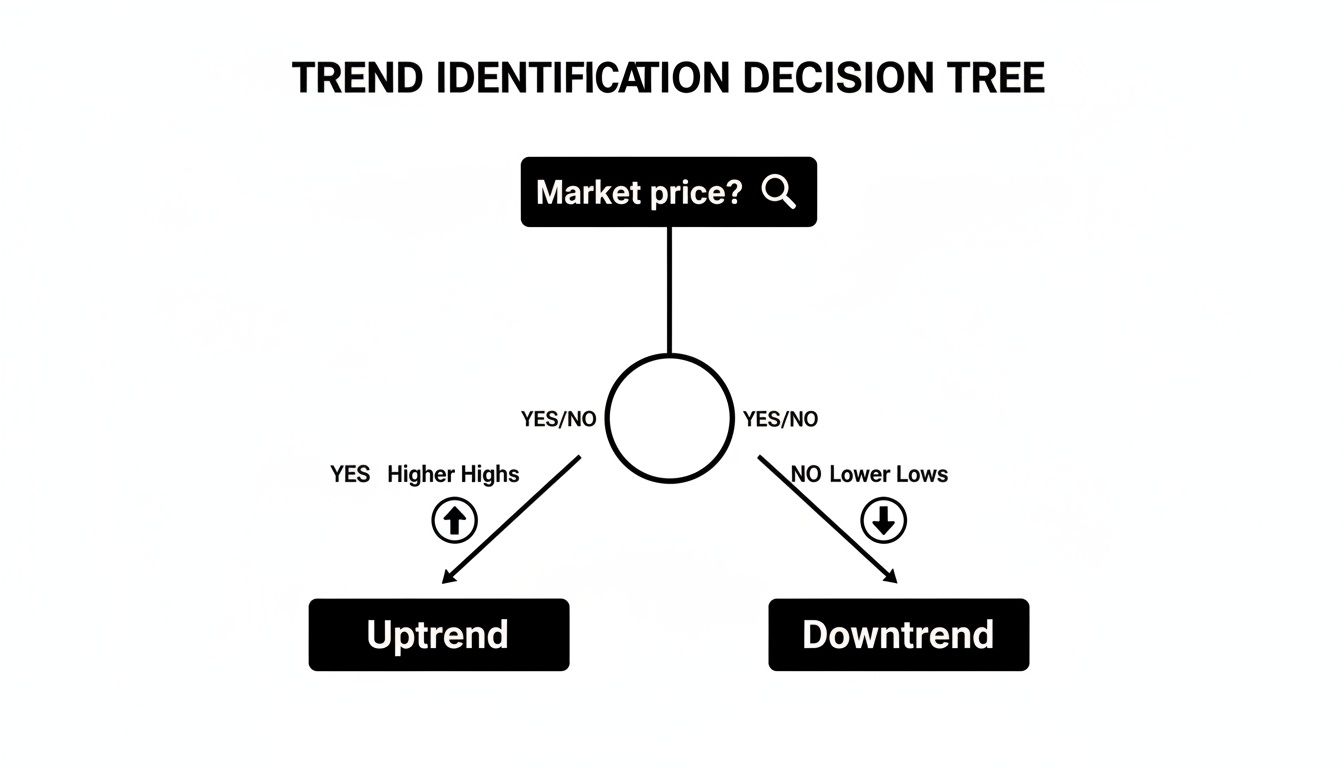
As you can see, a true trend is nothing more than a consistent series of higher highs and higher lows (for an uptrend) or lower lows and lower highs (for a downtrend). Everything else is just chop.
Waiting For Price Action Signals
Just because price is pulling back doesn't mean it's time to jump in. Not every pullback is a golden opportunity. You need a specific price action trigger that tells you the trend is ready to resume. Patience here is everything.
Instead of guessing where a pullback might end, you wait for the chart to give you a clear signal at a key level.
These key levels often show up around:
- Previous swing highs or lows: Old resistance has a funny way of becoming new support in an uptrend, and vice versa.
- A major trend line: A well-drawn trend line can act as a dynamic floor or ceiling for price. If you need a refresher, check out our guide on how to draw trendlines.
- Supply and demand zones: These are areas where price has turned on a dime with serious force in the past.
Once price reaches one of these strategic locations, you switch from observer to hunter, watching for the right candlestick pattern to signal your entry.
A fantastic confirmation signal is a bullish or bearish engulfing bar. This pattern happens when one candle's body completely swallows the body of the one before it. It’s a powerful sign that momentum has shifted aggressively back in the direction of the main trend.
The forex market is a perfect playground for this kind of strategy. With global turnover hitting an incredible $9.6 trillion daily in April—a 28% jump from 2022—the powerful short-term trends are ripe for the picking. This disciplined, patient approach is what separates the consistently profitable traders from the crowd.
Trend Confirmation Signals vs Market Noise
New traders often get faked out by minor price fluctuations, mistaking them for genuine trend continuations. It's crucial to learn the difference between a real signal and simple market noise. A real signal appears at a logical location and shows clear intent, while noise is often random and traps impatient traders.
| Confirmation Signal | What It Indicates | Common Mistake (Market Noise) |
|---|---|---|
| Engulfing Bar at Support/Resistance | A decisive and powerful rejection of a key price level, showing strong momentum is returning to the trend. | A small, indecisive candle in the middle of nowhere that doesn't respect any significant prior price levels. |
| Pin Bar (Hammer/Shooting Star) | Price tested a key level but was forcefully rejected, leaving a long wick that indicates the trend is holding firm. | A doji or spinning top candle that shows market indecision rather than a clear rejection of a level. |
| Break and Retest of a Structure Level | Price breaks through a previous swing point and then pulls back to test it from the other side, confirming the level has flipped. | A "fakeout" where price briefly pokes through a level only to reverse immediately back into the previous range. |
Relying on confirmed signals at logical price zones is the key. It prevents you from getting chopped up by meaningless volatility and helps you align your trades with real institutional buying or selling pressure.
Pinpointing Your Entry Trigger
Let’s make this real. Imagine EUR/USD is in a clear uptrend and has just printed a new higher high. Amateurs might feel the FOMO and buy right at the peak. You know better. You wait patiently for price to pull back to the previous swing high, which you expect will now act as a support level.
Price drifts down and touches that level. Do you buy? Not yet. You wait for confirmation.
Suddenly, a large bullish engulfing candle forms, right on that support level. That’s your signal. It’s the market telling you that buyers have shown up in force, exactly where you anticipated they would, confirming the uptrend is very likely to continue. By entering after this confirmation, you join the trend with confidence and a much better price than anyone who chased that initial breakout.
Mastering Your Exits: Stops And Targets
Nailing a great entry feels fantastic, but it's only half the battle. If you want to trade with the trend successfully over the long haul, your exit strategy is just as crucial—if not more so.
A sloppy exit can quickly turn a winner into a loser. On the flip side, a well-planned exit protects your capital and, most importantly, locks in your hard-earned profits. This is where your stop-loss and take-profit targets come in. Think of them as your pre-flight checklist, planned out before the emotions of a live trade can mess with your judgment.
Setting A Logical Stop-Loss
Your stop-loss is your safety net, plain and simple. Its only job is to get you out when your trade idea is proven wrong, preventing a small, manageable loss from turning into a disaster. The key is placing it based on market structure, not some random number of pips or a fixed dollar amount you're comfortable losing.
One of the biggest mistakes I see is traders setting their stops way too tight. It feels safer, but it doesn't give the trade any room to breathe. They get nicked out by normal market noise, only to watch in frustration as the price then moves exactly where they predicted.
So, how do you avoid this? Let the price action be your guide.
- In an uptrend: Place your stop just below the most recent significant swing low. This is a clear structural point. For the uptrend to be invalidated, price has to break that low.
- In a downtrend: Place your stop just above the most recent significant swing high. That level is a natural barrier, and a break above it suggests the downtrend might be losing steam.
This structural approach grounds your risk in the market's own logic and keeps your stop out of the random noise. For a deeper dive, our guide on how to properly set a stop-loss and take-profit covers more advanced techniques.
Defining Your Profit Targets
Just as you need a plan for when you're wrong, you need one for when you're right. "Letting winners run" is great advice, but without a clear target, it's just wishful thinking. A profit target makes sure you actually bank your gains.
The simplest and most effective method is to aim for the next major area of supply or demand. If you're long in an uptrend, your target should be the next clear resistance level where sellers previously stepped in and pushed the price down.
Another popular method is using a pre-defined risk-to-reward ratio. Many traders aim for a 1:2 risk-to-reward ratio, meaning for every $1 you risk, you aim to make $2. If your stop-loss is 50 pips from your entry, your first profit target would be 100 pips away.
When you're mapping out these levels, don't forget the practical side of execution. Things like understanding and avoiding slippage can make a real difference to your final results.
Protecting Profits With A Trailing Stop
For those powerful, runaway trends that just keep going, a trailing stop is an incredible tool. Instead of closing your entire position at a fixed target, a trailing stop moves up behind your trade as it racks up profits.
For instance, in a strong uptrend, you could manually trail your stop-loss just below each new higher low that forms. This lets you ride the trend for as long as it lasts, capturing the bulk of a major move while protecting the profits you've already made from a sudden reversal. This kind of active management is what separates disciplined traders from hopeful gamblers.
Bringing It All Together: A Trend Trading Case Study

Theory is one thing, but seeing how a strategy unfolds on a live chart is where the real learning kicks in. Let's walk through a complete trade setup on EUR/USD, a favorite pair for those who trade with trend, to see how these price action principles all click into place.
There's a good reason why pairs like EUR/USD are so popular. At the center of it all is the U.S. dollar, which is involved in a staggering 89.2% of all forex transactions. You can dig into the numbers yourself in the official BIS report.
What this means for us is simple: when the dollar picks a direction, major pairs often follow suit, creating the kind of clean, sustained moves we dream of as trend traders. If you're tired of choppy markets, this is your edge.
Identifying The Primary Trend
Our journey begins on the daily chart of EUR/USD. The first glance tells us everything we need to know—it's in a clear, established downtrend. We can easily connect a series of lower highs and lower lows, which confirms the bears are in the driver's seat.
This higher timeframe analysis is our compass. It sets our directional bias, meaning we are only interested in finding opportunities to sell.
Looking at the most recent price action, we see a sharp drop that carved out a fresh lower low. This move was followed by a slow, grinding rally back up. This is the classic pullback we've been waiting for. Our job now is just to be patient and let price come to us at a logical spot where sellers might reappear.
Pinpointing The Entry And Setting The Parameters
As we zoom in, we can see that the pullback is getting close to a previous swing low. This is a critical area of market structure that we expect to flip from support to resistance. As price nudges into this zone, we don't just jump in. We wait for a clear price action signal to validate our idea.
And right on cue, a big, bold bearish engulfing bar forms precisely at that resistance level. That's the A+ entry trigger we were looking for. It’s a powerful rejection of higher prices and screams that sellers are wrestling back control.
With our signal in place, here’s how the trade is structured:
- Entry: We place a short entry order just a few pips below the low of that bearish engulfing candle.
- Stop-Loss: The stop goes just above the high of the engulfing bar. This keeps it tight and uses the market's own structure to protect us.
- Take-Profit: Our initial target is set just ahead of the most recent major swing low, giving us a solid risk-to-reward ratio of at least 1:2.
This is how you trade without emotion. It’s a methodical process: identify the main trend, wait for a pullback to a key level, and only pull the trigger after a clear confirmation signal. You stack the odds in your favor every step of the way. This is the simple, repeatable blueprint for consistent trend trading.
Answering Your Questions About Trend Trading
Even with the best strategy in hand, the live market always throws a few curveballs. Doubts creep in. It's totally normal. Let's tackle some of the most common questions I get from traders so you can build the confidence to pull the trigger when it counts.
One of the biggest anxieties is figuring out when a great run is coming to an end. How do you know when to bail on a trend without giving back a huge chunk of your profits?
The answer isn't a feeling or a guess—it's written right there in the market structure. A real trend reversal isn't subtle; it's a clear break in the established pattern.
- In a solid uptrend, the party isn't over until the price creates a lower low. That means it has to break decisively below the last significant swing low.
- In a strong downtrend, the alarm bell is a higher high. Price has to push past the previous major swing high to signal a potential reversal.
Until you see that clear structural break, the trend is, technically speaking, still your friend.
What If The Market Is Just… Stuck?
Another tricky spot is when there’s no clear trend at all. The chart looks choppy, messy, and price is just bouncing around sideways in a range. There are no higher highs or lower lows to be found.
The best advice here is also the simplest: do nothing.
Trying to force a trend trade in a sideways, range-bound market is probably the single fastest way to chop up your account. A ranging market needs a completely different playbook, and real discipline is having the patience to sit on your hands and wait for your A+ setup to reappear.
Your job isn't to trade every single day. It's to trade when the odds are stacked in your favor. If there’s no trend, your edge is gone. Protect your capital and your mental sanity for when a real opportunity shows up.
Which Is The "Best" Timeframe For Finding Trends?
This is a classic. Traders often get stuck trying to find the one "perfect" timeframe. Is the daily chart better than the 4-hour? Or should you be on the 15-minute?
Here’s the truth: trends happen on every single timeframe, from the monthly all the way down to the 1-minute chart. The "best" one has nothing to do with the market and everything to do with you—your personality and how much time you can dedicate to the charts.
- Long-term position traders will live on the weekly and daily charts, aiming to ride massive trends that can last for months or even years.
- Swing traders (like myself) usually find the 4-hour and daily charts to be the sweet spot, holding positions for a few days to a few weeks.
- Day traders will naturally focus on lower timeframes like the 1-hour and 15-minute charts to catch trends that play out within a single trading session.
The secret ingredient here is consistency. Pick your primary timeframe for identifying the trend and stick with it. You can always drop down one level to a lower timeframe to pinpoint a more precise entry, but don't jump around randomly. That’s a recipe for confusion and analysis paralysis.
Here at Colibri Trader, my entire approach is built on mastering these core price action principles. My programs are designed to give you a clear, repeatable process for spotting and managing high-probability trades, no matter what the market is doing.
If you're ready to stop guessing and start trading with a genuine edge, take a look at my proven trading programs.