


How to Trade With The Trend Using Price Action

Trading With The Trend means syncing your positions to the market’s dominant move: buying on upswings and selling on downswings. You tap into the market’s collective momentum, significantly boosting your odds, instead of taking on the fight. It’s simply letting the current carry you.
Why You Should Always Trade With The Trend
You’ve heard “the trend is your friend,” but few realize how vital it is. In practice, it:
- Distinguishes consistently profitable traders from those guessing tops and bottoms
- Avoids battling massive institutional flows
- Focuses on joining the existing wave, not predicting its end
This mindset simplifies every trade. Spot the confirmed trend, then look for low-risk entries. You’re not wrestling with the market’s power, so stress and second-guessing drop dramatically.
Embracing Market Momentum
Imagine a torrent. Paddling upstream (counter-trend) takes endless effort—and you risk capsizing. Hop in a raft and drift with the flow (trend trading), and the river does the heavy lifting. That’s the professional’s edge.
In big, liquid arenas this principle shines brightest. For example, in April 2025 the foreign exchange market surged to $9.6 trillion in daily turnover—a 28% leap since 2022. Geopolitical shocks drove volatility and massive swings, creating ripe opportunities for traders aligned with those moves.
“The goal of a successful trader is to make the best trades. Money is secondary. By focusing on the process and aligning with the market’s direction, profitability becomes a natural byproduct.”
The Psychology Of Trend Following
Switching to a trend-following mindset frees you from being “right” about direction and anchors you in real price action. You’re effectively trading the crowd’s collective psychology—be it bullish optimism or bearish fear. To deepen your grasp, check out our guide on market sentiment.
This approach builds confidence and discipline, giving you a clearer roadmap through the markets.
Trend Trading vs Counter-Trend Trading Key Differences
Below is a quick comparison highlighting the core philosophies and outcomes of aligning with the market versus fighting it.
| Aspect | Trading With The Trend | Counter-Trend Trading |
|---|---|---|
| Philosophy | Join established momentum | Seek reversals against the flow |
| Risk Profile | Lower stress, controlled drawdowns | Higher stress, wider stops |
| Entry Criteria | Pullbacks within a confirmed trend | Exhaustion patterns at potential turning points |
| Win Rate Expectations | Steady wins, moderate targets | Fewer signals, bigger targets but lower consistency |
| Psychological Demand | Discipline to wait for clear setups | Requires strong conviction and tolerance for drawdown |
Understanding these differences helps you choose the approach that fits your style and comfort level.
How To Identify The Real Market Trend
Forget about all those complicated indicators that clutter your charts and lag behind the price. The purest way to trade with the trend is to simply read the story the market is telling you through its structure.
At its core, identifying a trend just comes down to watching the rhythm of the peaks and troughs—what traders call swing highs and swing lows. This price action approach is timeless because it’s a direct reflection of market psychology. It shows you the raw buying and selling pressure creating momentum, no fancy software needed. Just a clean chart and a trained eye.
Understanding Market Structure The Foundation
The market only ever does three things: it goes up, down, or sideways. Your first and most important job is to figure out which one it's doing right now. The definitions have been around forever because they work.
- Uptrend: You'll see a clear series of higher highs (HH) and higher lows (HL). Each new peak climbs above the last one, and every dip finds support at a higher price than the one before it.
- Downtrend: This is just the opposite, marked by a series of lower highs (LH) and lower lows (LL). Each new low punches through the previous one, and any bounces are weak, failing to reclaim the prior high.
- Range (Sideways Market): Here, the price is just stuck bouncing between a clear floor (support) and ceiling (resistance). It’s not making any progress up or down, which tells you the market is in a state of indecision.
Spotting these simple patterns is everything. When you see that clean sequence of higher highs and higher lows, you have a solid, objective reason to start hunting for buys. A series of lower highs and lower lows? That's your signal to focus only on selling.
The most powerful trends are obvious. If you have to squint and search for a trend, it probably isn’t strong enough to trade. Your best opportunities will jump right off the chart.
Combining Timeframes For A Clearer Picture
A classic mistake traders make is getting tunnel vision on a single timeframe. The "trend" on a 15-minute chart can be—and often is—completely different from the real trend on the daily chart.
To truly trade with the trend, you have to get these timeframes aligned. This technique, called multi-timeframe analysis, gives you the context you desperately need to make high-probability decisions. Think of it like a map. The higher timeframe is your satellite view showing the main highway (the dominant trend). The lower timeframe is your street-level view, helping you pinpoint the perfect on-ramp (your trade entry).
A Practical Timeframe Combination
A simple and highly effective combo for swing traders is the Daily and the 4-Hour chart.
- The Daily Chart (Your Anchor): Use this to define the primary trend. Is the market carving out clear higher highs and lows, or lower highs and lows? This sets your directional bias. If the Daily is in a monster uptrend, you have no business looking for sell signals on lower timeframes.
- The 4-Hour Chart (Your Entry Timeframe): Once the Daily has given you the green light, zoom into the 4-Hour chart. This is where you’ll look for your precise entry, like a pullback to a key support level that lines up with that bigger uptrend.
This top-down approach forces you to trade in harmony with the market's main momentum, which drastically stacks the odds in your favor. Truly mastering this is paramount, and for those who want to go deeper, there is a complete guide to identifying market trends that offers some great additional perspectives.
Distinguishing Pullbacks From Reversals
Once a trend is established, the market never moves in a straight line. It ebbs and flows. You'll see strong moves in the direction of the trend, followed by smaller counter-trend moves. These are called pullbacks or retracements, and they are your golden opportunities to enter.
But how can you tell if it's just a healthy pullback and not the start of a complete reversal? The answer, once again, is in the market structure.
- In an uptrend: A move is just a pullback as long as it does not create a new lower low below the previous higher low. If it holds that level, the uptrend is still intact.
- In a downtrend: A bounce is just a pullback as long as it does not create a new higher high above the previous lower high. As long as that high holds, sellers are still in control.
A break in that structure is your first major red flag that the trend might be losing steam. For a more detailed look at this, you can learn more about how to identify market trends in our guide. By focusing on these clear, mechanical rules, you take emotion and guesswork out of the equation. You start reacting to what the market is actually doing, not what you think it should be doing.
Pinpointing High-Probability Trade Entries
Confirming the trend direction is the strategic half of the battle; execution is where tactical precision wins the day. This is the moment your analysis turns into action. A high-probability entry isn't about impulsively jumping in when the market moves your way. It's about patiently waiting for a specific, logical setup that stacks the odds firmly in your favor.
The real goal here is to find those moments where the institutional order flow—the very force that created the trend—is likely to re-engage and give the market another push. We absolutely do not want to chase price after a big move has already happened. Instead, we wait for the market to come to us at a predetermined level, offering a low-risk, high-reward chance to join the prevailing momentum.
The Power Of Pullbacks To Key Levels
By far, the most reliable way to trade with the trend is to enter on a pullback. Think of a pullback as a temporary counter-move within a larger trend, like a wave pulling back before it crashes onto the shore. These moments are golden opportunities because they allow you to enter at a much better price—effectively buying "on sale" in an uptrend or selling at a premium in a downtrend.
But these aren't just random dips or bounces. The highest-probability entries happen when a pullback reaches a significant area of prior market structure.
- In an uptrend: We look for price to retrace back down to a previous resistance level that should now act as new support.
- In a downtrend: We watch for price to rally back up to a previous support level that should now act as new resistance.
This simple concept of support and resistance flipping roles is a cornerstone of price action trading. When you see price pull back to one of these zones and show signs of rejecting it, you have a powerful signal that the dominant trend is ready to resume. To really nail this down, it’s worth exploring our detailed guide on what is a pullback in trading.
This chart gives you a clean, high-level look at the three primary market states you must be able to identify before even thinking about an entry.
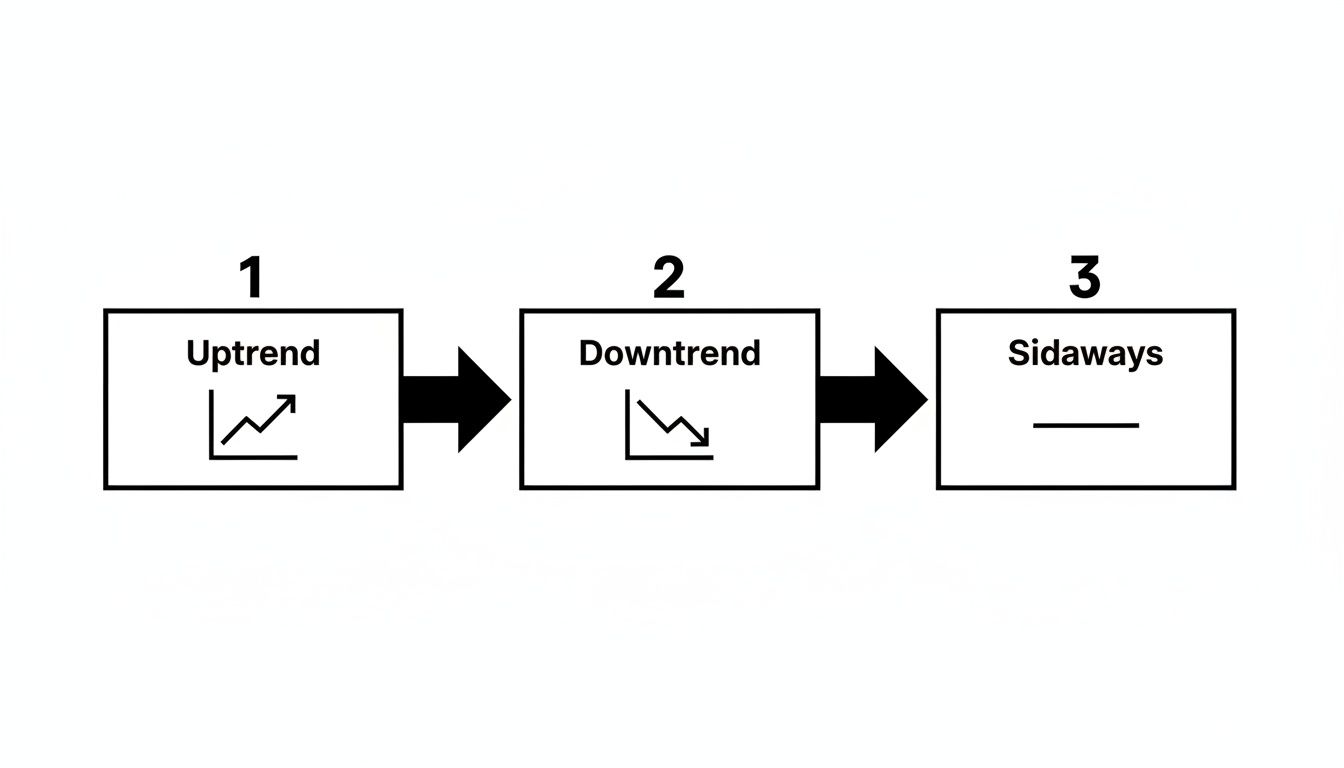
This visual helps simplify trend identification into its core components, allowing you to quickly classify market conditions so you can focus your energy on finding the right entry point.
Using Price Action Candlesticks As Your Trigger
Okay, so the price has pulled back to your key level. Now what? You need one final confirmation—a trigger to actually enter the trade. This is where individual candlestick patterns become incredibly useful. They provide that last piece of evidence that buyers (in an uptrend) or sellers (in a downtrend) are stepping back in right where you expected them to.
You don’t need to memorize dozens of esoteric patterns. Focusing on a few powerful and reliable ones is far more effective.
Key Candlestick Patterns For Trend Entries
- Engulfing Candle: This is a very strong signal of intent. A bullish engulfing candle completely swallows the previous bearish candle at a support level, showing an aggressive shift to buying pressure. A bearish engulfing candle does the opposite at resistance.
- Pin Bar (or Hammer/Shooting Star): This candle has a long wick and a small body, indicating a sharp rejection of a price level. A pin bar with a long lower wick at support shows buyers forcefully rejecting lower prices. One with a long upper wick at resistance shows sellers are defending that level.
- Inside Bar: This signals a brief pause or consolidation in the market. An inside bar forms entirely within the high-low range of the previous candle. A breakout from this tight range in the direction of the main trend can be an excellent entry signal.
Let’s imagine the EUR/USD is in a strong daily uptrend. It recently broke above a major resistance level at 1.0850. You're now patiently waiting for a pullback to this level, anticipating it will act as new support. Price slowly drifts down over a few sessions and finally touches 1.0850. At that exact level, a large bullish engulfing candle forms on the 4-hour chart. That is your A+ entry signal, right there.
Professional traders don’t predict; they react. They define a high-probability zone, wait for the market to come to it, and then look for a clear price action signal to confirm their thesis before risking a single dollar.
Defining Your Risk Before You Enter
A trade setup is completely worthless without a predefined exit for when you are wrong. Your stop-loss isn't just a safety net; it’s an integral part of the trade idea itself. Placing it correctly is what separates disciplined trading from pure gambling.
The logic is simple: your stop-loss should be placed at a level that, if hit, completely invalidates your reason for taking the trade in the first place.
- For a long (buy) entry in an uptrend: Your stop-loss should be placed just below the swing low of the pullback. If the price breaks below that low, the market structure of "higher lows" has been violated, and the uptrend may be over.
- For a short (sell) entry in a downtrend: Your stop-loss should be placed just above the swing high of the pullback. A break above that high would violate the pattern of "lower highs," signaling that sellers have lost control.
By setting your stop-loss based on market structure, you give the trade room to breathe while ensuring you get out immediately if the core reason for your entry fails. This mechanical approach removes emotion from the equation and protects your capital—the ultimate key to longevity in this business. This is how you transform a good analysis into a concrete, manageable trading plan.
Managing Your Trades Like A Professional

Finding a great entry is just the start of the race. The real money—where profits are protected and compounded—is made after you’re in the trade. This is where professional trade management separates the consistently profitable traders from everyone else.
It's less about hitting a perfect entry and far more about having a disciplined, mechanical plan for every possible outcome. That means you're defending your capital like a hawk while giving your winning trades the room they need to breathe and run.
The Cornerstone Of Survival: Risk Management
Before you even think about profits, your number one job is to protect your trading account. The single most important rule is to never risk more than 1% of your account balance on any single trade. This isn’t a friendly suggestion; it’s the bedrock of survival in this business.
Sticking to this rule ensures that a string of losses—which I guarantee will happen to every single trader—won't knock you out of the game. It’s what keeps you funded and ready to catch the big winning trades that truly define a successful trend-following account.
Here’s how to put this into practice on every single trade:
- Calculate Your Maximum Loss: Figure out what 1% of your account is. If you have a $10,000 account, your max risk is $100. This is the most you can lose if your stop-loss gets hit. No exceptions.
- Define Your Stop in Pips: Based on your analysis of market structure, determine where your stop-loss logically needs to be. Let's say it's 50 pips from your entry.
- Calculate Your Position Size: Now, just divide your risk amount by your stop-loss distance. This tells you exactly how many lots to trade to maintain your 1% risk.
This isn't optional. It’s a non-negotiable process that takes emotion out of the equation and prevents one bad decision from blowing up your account.
Active Trade Management Techniques
Once your trade is live, your job instantly switches from analyst to risk manager. The new mission is simple: cut your risk as the trade moves in your favor and maximize profit if the trend keeps going.
The first major milestone for any trade is hitting a 1:1 risk-to-reward ratio. This means the price has moved in your favor by the same amount you're risking. So, if you risked 50 pips, the trade is now 50 pips in profit.
This is your first and most critical decision point. As soon as your trade hits 1:1, you must immediately move your stop-loss to your entry price. This is called setting your stop to breakeven. Your trade is now "risk-free"—the worst possible outcome is getting stopped out for zero loss.
This one move is a massive psychological win. It kills the fear of a winning trade turning into a loser, letting you manage the rest of the position from a place of strength, not anxiety.
Letting Your Winners Run With A Trailing Stop
After you've locked in a risk-free trade, the game changes. Now, it's all about capturing as much of that trend as you possibly can. This is where most traders stumble, either grabbing profits way too early or giving everything back. A trailing stop-loss is the systematic fix for this.
Instead of a fixed profit target, a trailing stop mechanically follows the price as it moves in your favor, locking in gains along the way. There are a few solid ways to do this:
- Structure-Based Trail: In an uptrend, wait for the market to make a new higher high and then pull back to form a new higher low. You then manually move your stop just below that new higher low. It's simple and effective.
- Moving Average Trail: A popular method is to trail your stop just below a key moving average, like the 20 EMA on the 4-hour chart. You only exit if the price gives a convincing close below it.
- ATR-Based Trail: For a more mathematical approach, you can set your trail at a multiple of the Average True Range (ATR) away from the current price. This adapts your stop based on the market's recent volatility.
The key is to have a predefined method and stick to it. This discipline forces you to trade with the trend logically, keeping you in the move as long as the market structure holds up and getting you out when it finally breaks. This is how you turn small, consistent wins into the big, account-defining trades.
Common Trend Trading Mistakes To Avoid
Even with a perfect strategy on paper, it’s the little unforced errors that will bleed a trading account dry. Knowing the psychological and technical traps that ensnare most traders is just as vital as knowing where to click "buy."
When you learn to spot these classic mistakes, you can sidestep them, protecting your capital and building the discipline needed to trade with the trend successfully over the long haul. It's about shifting from an emotional, reactive state to a calm, rule-based mindset. Let's break down the most destructive habits I see traders make.
Fighting The Urge To Pick Tops And Bottoms
There’s a magnetic pull to want to be the hero who calls the exact market turning point. This ego-driven desire to "outsmart" everyone else is one of the single most expensive mistakes a trader can make. Trying to sell the very top of a roaring bull run or buy the absolute bottom of a nosedive is a low-probability gamble, not a professional strategy.
A professional trend trader doesn't try to catch a falling knife. Instead, they wait for the market to prove that the direction has changed. This means waiting for the established structure of higher highs and higher lows (in an uptrend) to be definitively broken. Patience is your greatest weapon here.
Chasing Price After A Big Move
Fear of missing out (FOMO) is a killer. You see a massive candle explode in your direction, and your gut screams to jump in before you're left in the dust. This is what we call chasing the market, and it almost always ends with you getting the worst possible price—usually right before a deep pullback or a flat-out reversal.
A professional entry is a calm, calculated decision made at a level you defined before the move happened. If you miss the boat, you have to have the discipline to let it sail and wait for the next high-quality setup.
A missed trade costs you nothing. A bad trade, taken out of FOMO, is a direct hit to both your capital and your confidence. There will always be another trade tomorrow.
Misinterpreting A Pullback As A Reversal
In a strong, healthy trend, the market breathes. It will pull back, sometimes sharply, and it can feel scary. These counter-trend moves can retrace 50% or even more of the prior leg, shaking out nervous traders and making it look like the trend is over. Mistaking this for a reversal is a critical error.
Remember the rules of market structure. A pullback is just a pullback—a chance to get in at a better price—as long as the previous major swing point holds.
- In an uptrend: A steep drop is not a reversal until it breaks below the last significant higher low.
- In a downtrend: A sharp rally is not a reversal until it breaks above the last significant lower high.
Getting this wrong is a recipe for disaster. You'll either cut winning trades far too early or, even worse, flip your bias and start trading against the dominant momentum right before it kicks back in.
Ignoring The Higher Timeframe Context
This is the classic rookie mistake, and it’s a big one. You might spot a beautiful downtrend on the 1-hour chart and start hunting for shorts, completely blind to the fact that the daily chart is in a monster uptrend. Your 1-hour "downtrend" is nothing more than a shallow pullback on the bigger picture.
Trading like this is like trying to swim against a powerful ocean current. You might make a little headway, but eventually, the tide will win.
Your primary job is to align your trades with the market's dominant flow. Always start your analysis on a higher timeframe (like the daily or weekly) to establish your directional bias. Only then should you zoom into a lower timeframe (like the 4-hour or 1-hour) to pinpoint your entry. This top-down analysis keeps you on the right side of the market's real power. When you fail to do this, you're not learning how to trade with the trend; you're just trading noise.
Your Trend Trading Questions Answered
When you're in the trenches, trying to follow a trend, a lot of practical questions pop up. Getting these sorted is key to building the confidence you need to actually pull the trigger on your trades. Let's tackle some of the most common hurdles I see developing traders face.
How Do I Know If A Trend Is Ending Or Just Pulling Back?
This is the million-dollar question, isn't it? The difference between a healthy dip and a dying trend comes down to one thing: market structure.
A pullback is just the market taking a breather. It’s a counter-move within the larger trend, and it usually has less momentum and respects the previous swing points. A reversal, on the other hand, is a fundamental break in that established pattern of highs and lows.
Think about a strong uptrend making higher highs and higher lows. A dip in price is just a pullback as long as it does not break below the last significant higher low. The moment it snaps that level and creates a lower low, the uptrend is officially in jeopardy. That structural break is the clearest sign you're going to get that the party might be over.
What Are The Best Currency Pairs For Trend Trading?
You can find a trend on any chart if you look hard enough, but some pairs are just built for it. The best ones are those that tend to make clean, sustained directional moves without a year's worth of chop in between.
- Major Pairs: Instruments like EUR/USD, GBP/USD, and AUD/USD are great places to start. Their high liquidity generally leads to smoother, more predictable price action.
- Cross Pairs: This is where you find the real runners. Pairs like GBP/JPY or EUR/JPY can be wild, but they often produce monster trends that last for weeks or months. They demand wider stops, but the profit potential is huge when you catch a big one.
The pro move here is to stop having a "favorite" pair. Instead, build a watchlist of 10-15 pairs. Each week, you scan them and put your capital to work on the one or two that are showing the most obvious, clean trend on the daily and 4-hour charts.
The key is to trade the best-looking chart, not your favorite currency pair. Let the market tell you where the opportunity is.
Can I Trade With The Trend On Lower Timeframes?
Absolutely. The principles of market structure are fractal, which is a fancy way of saying they work on any timeframe, from the monthly all the way down to the 1-minute chart. But—and this is a big but—trading trends on something like the M15 is a completely different ballgame.
It requires a ton more screen time, experience, and mental horsepower. Trends on these lower timeframes are short-lived and get slapped around by news events and daily noise. A much smarter path is to first master trend trading on the 4-hour and daily charts. Once you're consistently profitable there, you can take the exact same principles and apply them to the faster charts, always using the higher timeframe as your guiding light.
What Should I Do If There Is No Clear Trend?
This is the most important question of all, and the answer is painfully simple: do nothing. Sit on your hands. Go for a walk.
A huge percentage of the time, the market is a choppy, directionless mess. This is the killing floor for aspiring traders. It’s where they bleed their accounts dry trying to force trades that just aren't there.
A professional trend trader knows their real job is waiting. You don't get paid to trade; you get paid to wait patiently for the market to serve up an obvious, A+ setup that meets every single one of your rules. Use the quiet periods to study, review your journal, and prepare. When there’s no trend, the best trade is no trade at all.
Ready to stop guessing and start trading with a clear, repeatable price action strategy? At Colibri Trader, we provide the no-nonsense education and mentorship you need to master the markets. Discover your trading potential today. https://www.colibritrader.com