


A Price Action Guide to Trade the Trend
To really trade the trend, you have to learn how to read price action right off the chart. Forget about complex indicators for a moment and focus on the raw market structure. This is all about spotting the natural rhythm of impulse moves and corrective pullbacks that truly define a trend’s direction and muscle.
Once you master this, you'll start pinpointing high-probability entries and exits with a lot more confidence.
Reading the Story of the Market
The key to successful trend trading isn't some secret algorithm; it's written in plain sight on your charts. Every single price movement tells a piece of a larger story—the ongoing battle between buyers and sellers. Learning to read this story is the most important skill you can build.
Let's ditch the rigid textbook definitions for a bit and talk about the real-world feel of market structure. This is what helps you see the huge difference between a powerful, established trend and a temporary, meaningless pullback. It’s the difference between catching a monster move and getting stopped out on a minor wiggle.
The Rhythm of Impulse and Correction
At its core, a trend is just a series of waves. Think of it like the tide coming in. Each wave pushes further up the beach (that's your impulse move), recedes a bit (the correction), and then the next wave pushes even higher. This natural rhythm is the market's heartbeat.
- Impulse Waves: These are the strong, decisive moves going in the direction of the main trend. In an uptrend, these are the big upward thrusts that punch through to new highs. They show you when one side—buyers or sellers—is completely in control.
- Corrective Waves (Pullbacks): These are the smaller moves that go against the trend. They often represent periods of profit-taking or simple consolidation before the dominant trend kicks back in. Seeing these as temporary pauses is crucial for not panicking and getting shaken out.
A healthy uptrend is built on a series of higher highs and higher lows. On the flip side, a downtrend is marked by a clear pattern of lower lows and lower highs. When you see this pattern playing out consistently, you've got yourself a tradable trend.
The market is a story told in waves of buying and selling. Your job as a price action trader is not to predict the future, but to read the present chapter accurately and align yourself with the dominant narrative.
Identifying Key Swing Points
To really map out a trend's structure, you need to mark its key turning points. We call these swing points. These are simply the peaks and troughs that create the higher highs, higher lows, lower lows, and lower highs.
A swing high is a peak that forms when price rallies and then pulls back. A swing low is a valley created when price drops and then bounces. Pinpointing these isn't just about connecting dots; it’s about understanding the psychology. A swing high shows where sellers temporarily overwhelmed buyers, and a swing low is where buyers stepped back in with force.
For a deeper dive into this foundational concept, our detailed guide on how to identify market trends provides additional context and examples.
Recognizing Shifts in Momentum
Beyond the basic structure, you can find subtle clues in the price action that signal a change in the trend's health. Is the momentum picking up, or is it starting to look tired?
Think about an uptrend. If you notice the impulse waves are getting shorter while the corrective waves are getting deeper and lasting longer, that's a red flag. It suggests buyers are losing their nerve and sellers are getting more aggressive. While it doesn't guarantee a reversal, it's a clear signal to be more cautious. Maybe it's time to tighten your stop-loss or hold off on taking any new long positions.
This intuitive feel for momentum comes from watching how price behaves at key levels and observing the "character" of the candlesticks themselves. This is the art of trading that perfectly complements the science of market structure, giving you a complete way to truly trade the trend.
Confirming Trends With Price Action Signals
Spotting a potential trend is a great start, but a simple series of higher highs is just an observation. An emerging trend is nothing more than a hypothesis until the price action itself gives you a reason to believe it. This is where you switch from being a market analyst to an active trader, zeroing in on specific signals that validate a trend's strength and reveal solid entry points.
This isn't just about spotting a common candlestick pattern. Context is everything. A massive bullish engulfing candle that forms right at a key support level in a clear uptrend? That's a high-confidence signal. But if that same pattern pops up in the middle of a choppy, directionless market, it’s just noise. Your job is to filter out that noise and act only on the signals that align with the established market structure.
This visual shows the ideal rhythm of a healthy trend: the initial powerful impulse, the necessary correction, and finally, the confirmation that it's ready to continue.
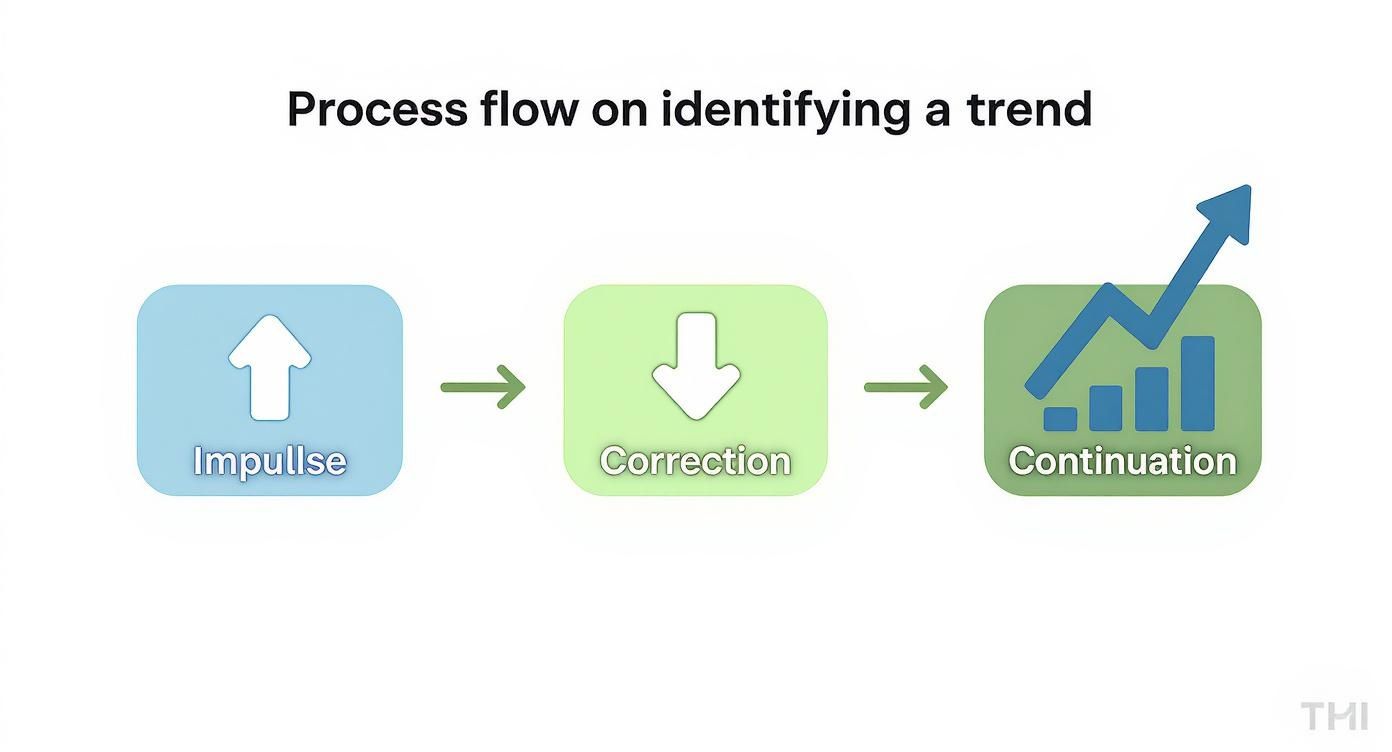
As the flowchart shows, a strong trend builds on itself. This creates fantastic opportunities for disciplined traders who have the patience to wait for a correction to play out and let the primary momentum show its hand again.
The Breakout And Retest Blueprint
One of the most reliable and time-tested setups in trend trading is the breakout and retest. It's a classic for a reason. This pattern gives you a clear, logical entry point that confirms both the trend's direction and the market's acceptance of a new price level. For many pros, it's a cornerstone strategy.
Here’s the play-by-play in an uptrend:
- The Breakout: Price makes a strong, impulsive move, decisively breaking above a clear resistance level (like a previous swing high). This initial surge shows commitment from the buyers.
- The Retest: After the initial excitement fades, the price pulls back to "retest" the old resistance level. This level should now act as new support. This pullback is crucial—it shakes out weak hands and validates the level's new role.
- The Confirmation: This is your cue. You watch for a clear bullish price action signal right at this new support zone. It could be a pin bar, an engulfing candle, or a strong rejection wick, telling you that buyers are defending the level and the trend is likely to resume.
This setup is powerful because it gives you a well-defined area to enter the trade and a logical place to put your stop-loss (just below the new support), often creating an excellent risk-to-reward profile.
Reading The Story Of Individual Candles
Individual candlesticks are the words that form the sentences of market structure. Learning to read their story in context is an essential skill. For a great overview of the key formations, this candlestick patterns cheat sheet is an excellent resource to have handy.
Beyond recognizing basic patterns, you need to look for the subtle clues about momentum. In an uptrend, are the bullish candles long and strong, closing near their highs? That shows conviction. Or are they getting smaller, with long upper wicks showing up? That suggests sellers are pushing back and the buyers might be losing steam.
Price action confirmation is your final filter. It forces you to wait for the market to prove your trend analysis correct before you risk any capital. Patience here is not passive; it's a strategic weapon.
A handful of price action signals are particularly effective for confirming trend entries.
Here’s a quick breakdown of some of the most reliable ones I look for:
High-Probability Price Action Entry Signals
| Price Action Signal | Ideal Trend Context | What It Signals | Trader Action |
|---|---|---|---|
| Bullish/Bearish Engulfing | During a pullback to a support/resistance level in a strong trend. | A powerful and sudden shift in momentum, overwhelming the previous candle. | Enter on the close of the engulfing candle or a slight pullback. |
| Pin Bar (Hammer/Shooting Star) | At the peak of a correction, rejecting a key support/resistance level. | Strong rejection of a price level, indicating buyers/sellers are stepping in. | Enter once price breaks the high/low of the pin bar. |
| Inside Bar | After a strong impulse wave, signaling a brief pause or consolidation. | A temporary equilibrium before the next move. Signals a potential continuation. | Enter on the breakout of the inside bar's range in the trend's direction. |
| Breakout & Retest Confirmation | After price breaks a key level and pulls back to retest it. | Confirmation that the old resistance has become new support (or vice-versa). | Look for any bullish/bearish signal at the retest level to trigger an entry. |
These signals provide the final piece of the puzzle, turning a good trend analysis into a high-probability trade setup.
Spotting Early Signs Of Trend Exhaustion
Just as price action confirms a trend's strength, it also flashes early warnings that the party might be ending. Catching these signals can save you from taking those late, low-probability entries that so often fail.
Keep an eye out for these tell-tale signs:
- Shrinking Impulse Waves: When the moves in the direction of the trend get noticeably shorter and weaker, it's a clear sign of fading momentum.
- Deepening Corrections: If pullbacks start retracing a much larger percentage of the prior impulse move, it shows the opposing side is gaining strength and confidence.
- A Break in Market Structure: This is the ultimate sign of a trend's death. An uptrend is invalidated when price fails to make a new higher high and then breaks below the last significant higher low.
By combining the big-picture view of market structure with the fine details of candlestick behavior, you create a robust and repeatable process. This allows you to confirm trends with confidence and pull the trigger only when the odds are stacked firmly in your favor.
Building Your Personal Trading Rulebook
Trading without a plan isn't trading at all—it's gambling. Hope is not a strategy. This is the moment you stop being a market observer and start acting like a business owner by creating your personal rulebook, a document that will govern every single decision you make from here on out.
Your entire framework will rest on three critical pillars: your entry criteria, your exit strategies, and your risk management.

This rulebook is more than just a set of guidelines. It's a binding contract you make with yourself to enforce discipline, especially when market volatility starts messing with your emotions. It's what separates the consistently profitable traders from the crowd.
Defining Your Precise Entry Criteria
Your entry rules need to be so specific that there is zero room for interpretation. You should be able to glance at a chart and get a definitive "yes" or "no" on whether a setup meets your criteria. This is how you eliminate hesitation and stop yourself from making impulsive trades based on a gut feeling.
Start by laying out the exact conditions that absolutely must be met before you risk a single dollar of your capital. These rules should cover the overall market structure and the specific price action signal you need to see.
Here are a few components your entry rules should have:
- Market Structure: Does the chart show a clear series of higher highs and higher lows (for an uptrend)? Or lower lows and lower highs (for a downtrend)? You have to define what "clear" means to you.
- Location: Where on the chart must the setup appear? For example, a rule could be: "I will only take long trades in an uptrend after a pullback to a confirmed support level, like a previous swing high."
- The Signal: What specific candlestick pattern or price action behavior has to show up at that location? A good rule might be: "I will enter only after a clear bullish engulfing candle or a pin bar forms at the support level."
These are your non-negotiables, the very foundation of your strategy. A well-thought-out approach is everything, and you can get some great ideas by checking out a professional trading plan template to make sure you've covered all your bases.
Crafting Intelligent Exit Strategies
Knowing when to get out is arguably more important than knowing when to get in. This applies whether you're right or wrong on a trade. Your rulebook must explicitly detail how you'll take profits and, just as crucially, how you'll cut your losses.
There are a few solid ways to exit a trade, and the best approach often comes down to your personality and what the market is doing at the moment.
A great entry can make you feel smart, but a disciplined exit is what actually pays you. Your exit strategy determines your profitability over the long run.
Think about building these types of exits into your plan:
- Fixed Profit Targets: You can set a profit target based on market structure. A common and logical rule is to aim for the next major resistance level in an uptrend or the next support in a downtrend. It gives you a predefined place to cash out.
- Trailing Stop-Loss: This is a fantastic technique to really trade the trend. Instead of a fixed target, your stop-loss moves up behind your position as the price trends in your favor. In an uptrend, for instance, you might trail your stop just below each new higher low that forms. This lets you ride the majority of the move without giving back too much profit when it finally turns.
- Invalidation Point: Your initial stop-loss is your "I was wrong" point. It needs to be placed at a logical level where your original trade idea is proven incorrect. For a long trade taken at support, the stop should go just below that support level. If that level breaks, the entire setup is invalidated.
Mastering Your Risk Management
This is the most critical pillar of your entire trading business. Period. Without solid risk management, even the most brilliant strategy will eventually blow up your account. Your number one job as a trader isn't to make money; it's to protect the capital you have.
The cornerstone of risk management is position sizing, which is simply figuring out how many shares or lots to trade based on your risk tolerance. The most respected rule in the game is the 1% Rule.
- The 1% Rule: This rule is simple: never risk more than 1% of your total trading account balance on any single trade. If you have a $10,000 account, the absolute most you can lose on one trade is $100.
This simple rule is a game-changer. It ensures that a string of losses—which is an inevitable part of trading—can't wipe you out. It keeps you in the game long enough for your winning edge to play out over time.
By building and strictly following this personal trading rulebook, you transform your trading from a reactive, emotional hobby into a disciplined, proactive business. Every decision is made ahead of time, taking emotion out of the equation and creating the consistency required for long-term success.
Understanding How Global Trade Influences Trends
While pure price action is your main analytical tool, the biggest trends don't just appear out of nowhere. They're often powered by massive undercurrents in the global economy. Getting a handle on these macro forces can give you the conviction to stay in a trade for weeks or even months, turning a decent profit into a game-changing one.
You don't need a degree in economics to trade trends. Not at all. But having a basic grasp of how capital flows between countries helps you see the bigger picture. When a nation's economy gets stronger, international investors start to notice. Money pours in, and that can kickstart a sustained trend in its currency or stock market.
Connecting Trade Data to Market Moves
One of the most powerful drivers of these long-term capital flows is international trade. A country’s trade balance—the difference between its exports and imports—is a fantastic snapshot of its economic health and how competitive it is on the world stage.
- Strong Exports: When a country sells more than it buys, it creates massive demand for its currency. Why? Because foreign partners have to buy that currency to pay for the goods. This is a fundamental driver for a strong, sustained uptrend in a currency pair.
- Weakening Imports: On the flip side, if a nation's imports suddenly drop off, it can be a red flag for a slowing domestic economy. This can lead directly to weakness in its currency and equity markets.
These aren't just quick, one-day catalysts. A shifting trade balance reflects deep, structural changes in supply and demand that can fuel a trend for a very, very long time.
Let's look at a real-world example. In June 2025, U.S. exports were $277.3 billion while imports fell to $337.5 billion. This caused the trade deficit to narrow by a significant 16.0% down to $60.2 billion. This kind of shift shows changing global demand and can absolutely influence the long-term value of the US dollar. You can dig into more of these US trade figures on the BEA website.
Macroeconomic factors like global trade don't give you a specific entry signal. Think of them as the powerful river current. Your price action setups are the boat. Aligning your boat with the current gives your trades a much higher probability of reaching their destination.
How This Looks on a Chart
So, how does all this high-level economic talk translate into something you can actually trade? It shows up as persistent, one-sided momentum on your charts.
Imagine a country's central bank is aggressively hiking interest rates to fight inflation, and at the same time, its trade balance is getting stronger. You will almost certainly see its currency climb against others.
On a chart, this won't be a random series of spikes. It will look like a clear, sustained sequence of higher highs and higher lows. The price action itself will show deep conviction from buyers, characterized by strong impulse moves and shallow, quick pullbacks.
When you're aware of the underlying economic story, you'll trade with much more confidence when a price action setup forms in the direction of that macro trend. It helps you filter out the market noise and focus only on the highest-quality opportunities, turning a simple chart pattern into a well-reasoned, high-conviction trade.
Common Trend Trading Mistakes and How to Fix Them
Every profitable trader I know has a graveyard of costly mistakes in their past. Experience is one hell of a teacher, but the tuition can be brutal. Consider this section your shortcut, a way to sidestep the most common traps that snare aspiring trend traders.
We'll get into the psychological blunders, like that gut-wrenching fear of missing out (FOMO) that convinces you to chase a chart that's already gone vertical. We'll also dissect the analytical errors, like mistaking a perfectly healthy pullback for a full-blown trend reversal and ending up on the wrong side of the market's momentum.

For every common pitfall, there's a practical, rule-based fix. Building a disciplined framework isn't just a suggestion; it's your best defense against emotional decisions and analytical slip-ups.
Chasing Extended Moves
This is mistake number one, and for good reason. You see a stock making a massive run, and that primal urge to jump on board is almost overwhelming. You're certain it's headed for the moon, so you buy near the top… just in time for the inevitable correction. Sound familiar?
Chasing price like this is a recipe for buying high and selling low. The absolute best entries in any trend are almost always found during the quiet moments—the pullbacks and consolidations—not during the peak excitement.
The Fix: Implement a strict "three pushes" rule. If a price has made three clear upward thrusts without a decent pullback, you are forbidden from entering. Period. Instead, you must patiently wait for the price to come back to a logical support level before you even think about placing an order.
Misreading a Pullback as a Reversal
In a strong, healthy uptrend, a pullback is just the market taking a breath. It's a necessary pause before the next leg higher. Yet, so many newer traders see red candles and immediately panic, assuming the entire trend is over.
This leads them to either exit a perfectly good winning trade way too early or, even worse, try to be a hero by shorting the pullback. That's like trying to swim against a riptide; it rarely ends well.
A trend is innocent until proven guilty. The only real proof is a clear break in market structure—not just a few down days.
The Fix: You need to define exactly what a trend reversal looks like in your trading plan. For an uptrend, this means two things must happen: the price must first fail to make a new higher high, and then it must break below the previous significant higher low. Until both of those conditions are met, your default assumption must be that the primary trend is still in charge.
Cutting Winners Short and Letting Losers Run
This is a classic, and it's born from pure emotion. When a trade is in the green, fear takes the wheel. You snatch a small gain because you're terrified of giving it back. But when a trade goes against you, hope takes over. You hang on, convinced it'll turn around, often until the loss becomes catastrophic.
This behavior torches your risk-to-reward profile and makes long-term profitability mathematically impossible. It doesn't matter if you have a high win rate; a few huge losses will always wipe out dozens of tiny wins.
The Fix: This one demands two non-negotiable rules in your plan:
- For Winners: Use a trailing stop-loss. In an uptrend, as the price forms a new higher low, you manually move your stop up to just below it. This mechanical process forces you to stay in the trade to capture the majority of the move while systematically protecting your profits.
- For Losers: Your initial stop-loss is sacred. Once you set it, you never, ever move it further away. That stop represents your "I was wrong" point, and respecting it is the bedrock of preserving your capital.
By tackling these common errors with clear, unbreakable rules, you'll start shifting from a reactive, emotional gambler to a disciplined, strategic trader. This mental and tactical framework is what truly separates the pros from the crowd.
Your Top Trend Trading Questions Answered
Even with a solid game plan, you're going to have questions when you're first learning to trade the trend. That's completely normal. Getting a real feel for price action takes screen time and a bit of guidance. Let's tackle some of the most common questions I hear from new traders to help you sharpen your approach.
What Timeframes Are Best for Trend Trading?
There's really no single "best" timeframe. It all comes down to your personality and how you want to trade.
Higher timeframes, like the daily or 4-hour charts, are fantastic for beginners. The trends are just so much clearer, and you don't get whipsawed by all the market "noise" that plagues the lower charts. Swing traders feel right at home here.
On the flip side, if you're a day trader, you might live on the 1-hour or 15-minute charts, looking to catch trends that begin and end in a single day.
The real key is consistency. A powerful technique that a lot of pros use is multi-timeframe analysis. It works like this:
- Find Your Bearing: Use a higher timeframe, like the daily chart, to get the lay of the land. What’s the dominant direction? This is your big-picture view.
- Zoom In for the Entry: Drop down to a lower timeframe, maybe the 4-hour or 1-hour, to pinpoint a much cleaner, low-risk entry that lines up with that bigger trend.
How Can You Possibly Trade Without Indicators?
Trading without indicators just means you're focusing on pure price action—the raw, unfiltered story the market is telling you. Instead of waiting for a lagging tool like a moving average or RSI to give you a signal, you build your analysis on the foundation of market structure.
You're watching the sequence of highs and lows. You're identifying critical support and resistance zones. You're reading candlestick patterns in context. For example, in a textbook uptrend, you'd be patiently waiting for the price to pull back to an old resistance level that might now act as new support.
Trading with pure price action isn't about having a crystal ball. It’s about realizing that price itself is the only true leading indicator. It tells you everything you need to know about the current tug-of-war between buyers and sellers.
Only at that specific level would you start looking for a bullish confirmation signal, like a strong engulfing candle, before you'd even think about pulling the trigger.
What’s the Difference Between Trend Trading and Swing Trading?
These two styles are definitely related, but the main differences are time and intent. Trend trading is the bigger-picture strategy. You're trying to capture the lion's share of a major market move, which might mean holding a position for weeks or even months.
A swing trader, however, is working on a much shorter timeline. Their goal is to catch the individual "swings" or waves inside that larger trend. So, in a major uptrend that runs for three months, a swing trader might buy a dip and sell at the next peak, doing that over and over. The trend trader is trying to hold on through all those smaller ups and downs.
You could say that most swing trading is really just a shorter-term version of trend trading.
How Do You Know When a Trend Is About to End?
Trying to nail the exact top or bottom is a fool's errand, but price action gives us some powerful clues that a trend is running out of steam. The single most reliable sign is a clean break in market structure. For an uptrend, that means the price fails to make a new higher high and then slices right through the last significant higher low.
Here are a few other warning signs to keep on your radar:
- Momentum Fades: You start to see the bullish candles getting smaller and weaker, while the bearish candles get bigger and more aggressive.
- Classic Reversal Patterns Appear: You spot a textbook pattern like a Head and Shoulders or a Double Top forming right at a key resistance level.
- A Violent Rejection: The price hits a major, historical resistance level and gets slammed down hard. This shows a huge wave of sellers just stepped into the market.
The trick is to wait for confirmation. A single warning sign might just be a deep pullback. But when you see several of these clues lining up together, the case for a real trend reversal gets a whole lot stronger.
Ready to stop guessing and start trading with a clear, repeatable price action strategy? At Colibri Trader, we provide the no-nonsense education and mentorship you need to master the markets without indicators. Transform your trading with proven techniques that build confidence and deliver consistent results.