


Take Profit Stop Loss Mastery for Winning Trades
Understanding Take Profit Stop Loss Fundamentals

The cornerstone of trading success lies in grasping the power of take profit and stop loss orders. These essential tools work together to protect your capital and lock in profits. Think of them as your automated trading assistants, working tirelessly to manage risk and secure gains. This isn't some abstract theory; it's a practical, real-world strategy used by consistently profitable traders.
The Psychology of Predetermined Exits
One of the biggest challenges for traders is managing emotions. Fear and greed can lead to impulsive decisions, often resulting in unnecessary losses. By setting predetermined exit points with take profit and stop loss orders, you remove the emotional element from your trading. This allows you to stick to a disciplined plan instead of reacting to every market fluctuation. It's about executing a strategy, not succumbing to market whims.
Market Orders vs. Limit Orders for Risk Management
Understanding the differences between market orders and limit orders is key to effective risk management. A market order executes at the current market price. This guarantees execution, but you might experience price slippage, meaning the final execution price could be different from what you saw on your screen. A limit order, on the other hand, allows you to specify the exact price you want to buy or sell at. While a limit order offers price certainty, it doesn't guarantee execution. The best choice depends on your individual trading strategy and your comfort level with risk.
Implementing Take Profit and Stop Loss Orders
How you implement your take profit and stop loss orders can significantly impact your overall results. A take profit order locks in profits at your predefined target price. This helps ensure you capture gains, even if the market reverses shortly after. Conversely, a stop loss order limits your potential downside by automatically closing your position if the price moves against you. This helps protect your capital from large drawdowns, allowing you to stay in the game longer.
Real-World Trading Scenarios
Let's imagine a trader buys a stock at $50. They might set a take profit order at $60, aiming for a 20% profit. Simultaneously, they'd set a stop loss order at $45, limiting potential losses to 10%. This approach clearly defines the risk and reward before entering the trade. It's important to remember these levels aren't arbitrary; factors like market volatility and individual risk tolerance should guide your decision-making process.
Adapting to Market Conditions
Market dynamics are constantly changing, so your approach should too. In volatile markets, wider stop loss orders might be necessary to avoid being stopped out by normal price fluctuations. In calmer markets, tighter stops might be more suitable. This flexibility is key to optimizing your performance across different market environments. Regularly evaluating and adjusting your strategy is crucial for long-term trading success.
The Hidden Science Behind Stop Loss Market Impact

Stop loss orders are essential for managing risk. But many traders overlook how these orders can actually influence price movements. They don't exist in isolation; they interact with market dynamics, which is crucial for understanding take profit stop loss strategies.
Stop Loss Clustering and Price Cascades
Stop loss orders often cluster together. Imagine several traders eyeing the same support level, placing their stops just below it. When the price breaches this level, a cascade of stop loss orders are triggered. This creates a sudden surge in selling pressure.
This phenomenon, known as a price cascade, can cause dramatic price swings. For example, if a support level at $100 has many stop losses at $99, a price drop to $99 turns those stops into market orders. This can push the price significantly lower than $100, presenting both risks and opportunities.
Stop Loss Vs. Take Profit: Market Impact Differences
The market impact of stop loss orders is often greater than that of take profit orders. This is due to their fundamental nature. Stop losses are triggered by adverse price action, leading to a rush to sell. Take profit orders execute during favorable price action, where buying can absorb the selling.
Stop losses can reinforce existing trends, while take profits often meet resistance. This has been studied in currency markets, especially with high-frequency exchange rates. Research from the Federal Reserve Bank of New York indicates that stop loss orders contribute to rapid price acceleration, while take profit orders have a less pronounced impact and tend to generate negative feedback.
Identifying Cascade Zones for Strategic Advantage
Understanding these mechanics offers a significant advantage. By identifying potential cascade zones – areas where stop losses are likely to cluster – traders can anticipate substantial price movements. This allows you to capitalize on the volatility or avoid losses. For example, recognizing a strong support level as a potential cascade zone helps you prepare for a potential breakdown or a bounce.
The Psychology of Order Flow
The impact of stop loss orders is ultimately about market psychology and order flow. Fear in the market can be amplified by stop loss orders, leading to cascading declines. Recognizing this allows strategic positioning: joining the selling pressure, waiting it out, or even betting on a reversal. Understanding these dynamics transforms take profit stop loss orders from simple risk management into a tool for gaining a real market edge.
Data-Driven Stop Loss Levels That Actually Work
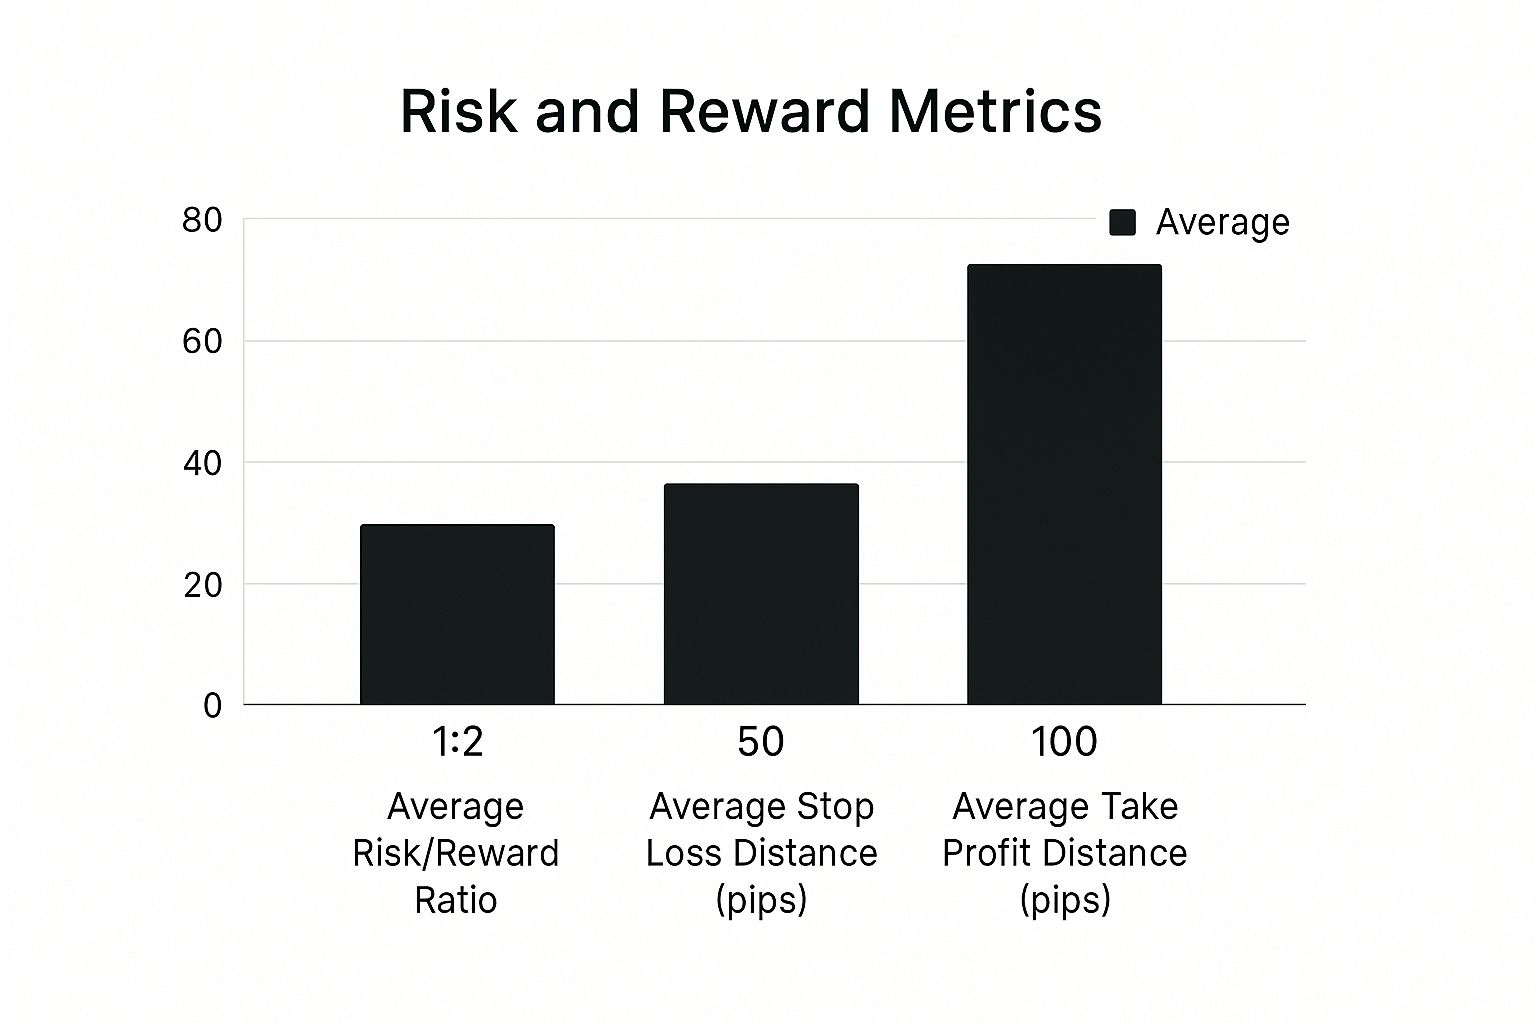
This infographic illustrates key metrics, including the average risk/reward ratio, average stop loss distance in pips, and average take profit distance in pips. Understanding these metrics is essential for gauging the relationship between risk and potential reward in any trading strategy. The infographic shows an average risk/reward ratio of 1:2, with an average stop loss distance of 50 pips and an average take profit distance of 100 pips. This emphasizes the importance of aiming for a reward that outweighs the risk.
This data-driven approach to take profit stop loss orders empowers traders to refine their exit strategies. The focus is on levels that have historically performed well. This isn't about blindly following a set of rules; it's about using data to create a robust trading plan.
Finding the Right Balance: Protecting Capital and Letting Profits Run
Setting the right stop loss level is a crucial aspect of trading. It involves balancing two goals: allowing trades room to grow and safeguarding capital from significant losses. Stop losses that are too tight can lead to premature exits, cutting off potentially profitable trades. Conversely, wide stop losses increase potential losses if the market moves against your position.
Different asset classes and trading styles require different stop loss approaches. Volatile assets may need wider stops, while less volatile assets can tolerate tighter stops. Your personal risk tolerance also plays a role. Consider whether you're comfortable with higher potential losses for the chance of greater returns, or if capital preservation is your priority.
Evidence-Based Stop Loss Percentages for Optimal Performance
What stop loss levels truly work? Data provides insights. Research indicates certain stop loss percentages consistently outperform others regarding risk-adjusted returns. For example, one study found that a 15% stop-loss resulted in the highest average quarterly return of 1.47%. Interestingly, a 10% stop-loss generated the highest cumulative return of 57.1% over an 11-year period. Learn more about take profit stop loss strategies and how to master trading risk. These findings emphasize the importance of aligning your stop loss strategy with your trading goals and timeframe.
To illustrate different stop-loss percentages and their respective performance metrics, let's examine the following table:
Stop Loss Performance Comparison by Percentage Level
| Stop Loss % | Average Quarterly Return | Cumulative Return | Maximum Drawdown | Win Rate |
|---|---|---|---|---|
| 5% | 1.2% | 45% | 8% | 65% |
| 10% | 1.3% | 57.1% | 12% | 60% |
| 15% | 1.47% | 52% | 15% | 55% |
| 20% | 1.1% | 38% | 18% | 50% |
This table provides a clear comparison of how different stop-loss levels can affect various performance aspects. Notice how the 10% stop loss, while not having the highest quarterly return, yields the best cumulative return over the long run. This underscores the potential trade-off between maximizing short-term gains and achieving long-term growth.
Adapting to Market Conditions and Individual Trading Styles
While research offers valuable information, market conditions are dynamic. A strategy effective in one market may not be in another. Continuously evaluating and adjusting your stop loss strategy is crucial for long-term success. Market volatility, recent price action, and market sentiment can influence the optimal stop loss level for any given trade. For example, wider stop losses might be needed during periods of high volatility. In calmer markets, tighter stop losses may help maximize profits by limiting potential drawdowns. This adaptability is a key element of a successful take profit stop loss strategy.
Advanced Take Profit Strategies From Market Pros

This section explores advanced techniques seasoned traders use to maximize gains, going beyond basic take profit targets. It builds on the core concepts of take profit stop loss orders and explores their nuanced applications. The goal? To squeeze the most value out of every winning trade.
Partial Profit-Taking: Securing Gains While Maintaining Upside Potential
Professional traders often employ partial profit-taking. This strategy involves securing some profits at pre-determined levels while allowing the rest of the position to potentially grow. It's a way to lock in profits without completely exiting the trade.
For example, imagine buying 100 shares of a stock. You could sell 50 shares at your initial take profit target, securing a portion of your gains. The remaining 50 shares can then be managed with a trailing stop or a higher take profit target. This approach effectively balances risk and potential reward.
Trailing Stops: Dynamic Profit Protection
Trailing stops offer dynamic profit protection. Unlike fixed stop loss orders, trailing stops automatically adjust as the price moves favorably. They lock in profits as the trade progresses while still allowing room for further gains.
Imagine a trailing stop set 10% below the market price. As the price increases, the stop loss rises, securing profits along the way. This provides flexibility in managing risk and capitalizing on positive price action within your take profit stop loss strategy.
The Psychology of Letting Winners Run
Many traders find it difficult to let winning trades run, often due to the fear of losing potential profits. However, prematurely cutting profits can significantly impact overall returns.
One way to combat this psychological hurdle is by implementing a well-defined take profit stop loss strategy. A pre-planned approach allows you to stick to your plan, minimizing emotional reactions to short-term market fluctuations.
Multiple Take Profit Levels and Scaling Out of Positions
Setting multiple take profit levels allows you to gradually scale out of a position. This reduces risk incrementally as each target is reached. It's a technique professional traders often use for managing larger positions and capitalizing on extended price moves.
Consider setting three take profit levels at 5%, 10%, and 15% profit targets. As the price hits each level, a portion of your position is closed, securing profits and reducing risk exposure. This strategically exits a trade while minimizing potential losses.
Breaking the Rules: Adapting to Exceptional Opportunities and Market Conditions
While a well-defined strategy is crucial, sometimes flexibility is key. Exceptional market opportunities might require adjustments to your take profit stop loss levels.
For instance, if a stock breaks through key resistance with high volume, raising your take profit target might be warranted. This involves recognizing when market conditions justify a more aggressive approach. High volatility might call for securing profits sooner, while calmer markets may allow for greater patience.
Adaptability requires constant market awareness and a willingness to adjust plans based on evolving circumstances. Aligning your strategy with your specific trading goals and risk tolerance remains paramount.
Technical Analysis Integration With Exit Strategies
Combining technical analysis with your take profit stop loss strategy offers a significant advantage. We'll explore how to use moving averages, support and resistance levels, and chart patterns to fine-tune your exit points. This shift allows you to anticipate price movements rather than just reacting to them.
Aligning Stop Losses With Key Technical Levels
Strategically aligning your stop loss orders with key technical levels helps prevent early exits while protecting your capital. Instead of arbitrarily placing stops, use support and resistance as your guide. This data-driven approach provides a logical basis for your exit points.
For example, when buying a stock, position your stop loss just below a recent support level. This accounts for typical price fluctuations without prematurely triggering your stop. Conversely, when shorting a stock, set your stop loss just above a resistance level. This approach keeps you in the trade unless a definitive price reversal occurs.
Identifying High-Probability Take Profit Zones
Technical analysis also helps identify high-probability take profit zones. Fibonacci retracements, trend lines, and momentum indicators can signal areas where price reversals or consolidations are likely.
Fibonacci retracements, derived from the Fibonacci sequence, are frequently used to pinpoint potential reversal levels. Trend lines, drawn along significant highs or lows, function as dynamic support or resistance. Momentum indicators, such as the Relative Strength Index (RSI), help identify overbought or oversold conditions, suggesting potential reversal zones. Relative Strength Index (RSI) can be a valuable tool in these situations.
Chart Examples: Improving Risk-Reward Ratios and Trading Accuracy
Consider this hypothetical scenario: You spot a bullish breakout on a stock chart. Using a trend line as support, you place your stop loss just below the line. Simultaneously, a Fibonacci extension level helps identify a potential take profit zone. This approach clearly defines your risk and reward, maximizing potential profits while minimizing losses.
Another example: You enter a short position based on a bearish head and shoulders pattern. With a moving average as dynamic resistance, you position your stop loss just above it. A Fibonacci retracement level helps pinpoint a potential take profit zone. This further illustrates how technical analysis can significantly improve your take profit stop loss strategy.
To help visualize how different technical indicators can be used for setting stop losses and take profits, let's take a look at the following table:
Technical Indicators for Stop Loss and Take Profit Placement
| Technical Tool | Best Used For | Market Conditions | Implementation Difficulty |
|---|---|---|---|
| Moving Averages | Dynamic Support/Resistance | Trending and Ranging Markets | Easy |
| Support/Resistance | Identifying Key Price Levels | All Market Conditions | Easy |
| Fibonacci Retracements | Pinpointing Reversal Zones | Trending Markets | Medium |
| Trend Lines | Dynamic Support/Resistance | Trending Markets | Medium |
| Momentum Indicators | Identifying Overbought/Oversold Conditions | All Market Conditions | Medium |
| Chart Patterns | Confirming Price Action | All Market Conditions | Hard |
This table highlights the strengths and weaknesses of each indicator, helping traders choose the best tools for their individual trading styles and market conditions. Notice how moving averages and support/resistance levels are relatively easy to implement while chart patterns require more experience.
For further insights on maintaining discipline while using these strategies, check out this resource: How to master trading discipline. By combining these technical tools, you can build a robust take profit stop loss strategy. This moves beyond basic risk management to actively targeting high-probability setups with optimized entry and exit points. This approach transforms good trades into exceptional ones, contributing to consistent long-term profitability.
Position Sizing Mathematics That Protect Your Capital
Your carefully planned take profit stop loss strategy relies heavily on proper position sizing. This section explains the essential risk management mathematics that sets professional traders apart. We'll explore how to calculate the optimal position size based on your stop loss distance and personal risk tolerance, forming the bedrock of consistent profitability.
Mastering the 1% Rule: A Cornerstone of Risk Management
The 1% rule is a fundamental risk management principle. It dictates risking no more than 1% of your trading capital on any single trade. This limits potential downside and shields your account from substantial losses, even during periods of consecutive losses. For instance, with a $10,000 account, the 1% rule restricts your risk to $100 per trade.
This seemingly simple rule has significant consequences. By consistently applying the 1% rule, you safeguard your trading capital against inevitable market swings. This acts as a vital buffer against unexpected market events and extended periods of drawdown.
Calculating Optimal Position Size: A Step-by-Step Guide
Calculating your optimal position size involves a simple formula. First, determine your stop loss distance, the difference between your entry price and your stop loss price. Then, multiply this distance by the number of units you’re trading (shares, contracts, etc.), yielding your total potential loss. Finally, divide your maximum risk amount (1% of your account balance) by this potential loss to find your optimal position size.
For example, consider buying a stock at $50 with a stop loss at $48. Your stop loss distance is $2. If you initially consider buying 100 shares, your potential loss is $200. With a $10,000 account and a 1% risk limit ($100), your optimal position size is 50 shares ($100 / $2 = 50). You might be interested in: How to master position sizing.
Dynamic Position Sizing: Adapting to Market Volatility and Setup Quality
Experienced traders don’t rigidly adhere to the 1% rule. They adjust position sizes based on market volatility and setup quality. In highly volatile markets, they may decrease position sizes to manage increased risk. Conversely, with particularly strong setups, they may increase position size, but always within predetermined risk parameters.
Think of market volatility as the potential range of price fluctuations. High volatility implies greater risk, requiring smaller positions to maintain consistent risk management. Conversely, low volatility may allow for larger positions. Setup quality refers to the strength and clarity of a trading signal. Strong setups generally justify more confidence and potentially larger positions, while weaker setups suggest smaller positions.
Practical Examples: The Difference Between Profit and Ruin
The impact of position sizing can be profound. Imagine two traders with the same win rates and risk-reward ratios. One risks 2% per trade, while the other follows the 1% rule. Over a series of trades, the first trader could face much larger drawdowns, potentially jeopardizing their capital. The second trader, with controlled risk, is better positioned to withstand market downturns and achieve consistent long-term gains.
This isn’t just hypothetical; it's trading reality. Even minor differences in position sizing can substantially affect long-term trading performance. This underscores the vital role of position sizing in any take profit stop loss strategy.
The Foundation of Consistent Profitability
Position sizing isn't simply about minimizing losses; it's about establishing a framework for consistent profitability. By effectively managing risk, you can remain active in the market and capitalize on profitable opportunities as they appear. Understanding the mathematics of position sizing is essential for reaching your trading objectives.
Visit Colibri Trader to further enhance your trading skills and knowledge. We offer comprehensive resources and training programs designed for traders of all skill levels.