


Discover supply and demand trading strategies for confident trading
Supply and demand trading isn't about slapping lagging indicators on a chart. It’s a raw, pure form of technical analysis that zeroes in on the price zones where big-money players—the institutions—previously showed their hand with massive buying or selling.
We’re essentially reading the raw price action to find where market imbalances are likely to happen again. This gives us high-probability spots to plan our entries and exits.
The Real Principles Behind Supply And Demand Trading
Forget the complicated stuff for a second. At its core, supply and demand trading is just about understanding the fundamental economic force that moves every market: a constant tug-of-war between buyers and sellers.
When you see a price chart explode upwards or nosedive, that’s not just random market noise. It's the footprint of a massive imbalance.
This whole approach is built on the idea that large institutional orders from banks, hedge funds, and other major players are the real engine behind market moves. These guys can't just click a button and fill a billion-dollar order. They have to build their positions over time, and in doing so, they leave behind very distinct price zones—areas of consolidation—right before a big rally or a sharp drop.
A price chart is more than just data; it's a historical map of market psychology. The key is learning to read the story of where large pools of unfilled orders are waiting, which is the foundation of all effective supply and demand trading strategies.
Before we get into the nitty-gritty of identifying and trading these zones, it's crucial to have a firm grasp of the basic concepts.
Key Concepts At A Glance
| Concept | Description | What It Looks Like On A Chart |
|---|---|---|
| Supply Zone | An area of strong overhead resistance where sellers previously overwhelmed buyers, causing price to drop sharply. Unfilled sell orders are likely waiting here. | A cluster of candles or a "base" right before a significant, sharp downward move. |
| Demand Zone | An area of strong underlying support where buyers previously overwhelmed sellers, causing price to rally hard. Unfilled buy orders are likely waiting here. | A cluster of candles or a "base" right before a significant, sharp upward move. |
| Imbalance | A situation where there is a significant disparity between buying and selling pressure, leading to a strong directional move. | Long, explosive candlestick bodies moving away from a supply or demand zone. |
| Institutional Order Flow | The accumulation and distribution of large orders by major financial institutions, which creates the supply and demand zones we trade. | The "footprints" left behind—the supply and demand zones themselves. |
These core ideas are the building blocks of everything that follows. Understanding them isn't just theory; it's the practical foundation for spotting real opportunities.
The Footprints Of Big Money
These zones of intense buying (demand) or selling (supply) become our primary areas of interest. Why? Because when the price eventually swings back to these levels, there are often a ton of unfilled orders left over. This leftover interest acts like a magnet, either stopping price dead in its tracks or sparking a sharp reversal.
The power of this method is directly linked to that institutional order flow. For instance, reports have shown that institutional option volume at a giant like Citadel Securities can be 2.6 times higher than average during key periods.
In futures markets, you'll see limit orders stacked up in tight bands just 0.25–0.50% away from the current price. This is what creates the very "shelves" of support and resistance that savvy traders look for.
It's this concentrated liquidity that forms predictable, repeatable patterns for those who know what to look for.
Why This Method Works
Trading supply and demand strips away a lot of the guesswork that comes with indicator-heavy systems. Instead of waiting for a lagging signal to tell you what already happened, you are proactively identifying areas where the market has already shown its intent.
The logic is simple but powerful:
- It’s Based on Market Structure: You're trading with the underlying mechanics of how prices actually move, not just a mathematical formula spit out by an indicator.
- It Creates Clear Risk Parameters: These zones give you a natural, logical place to set your stop-loss. Your risk is defined before you ever hit the "buy" or "sell" button.
- It’s Universally Applicable: The principles of supply and demand are the same everywhere. They work across all markets and timeframes, whether you're trading forex, stocks, commodities, or crypto.
By learning to spot these key zones, you stop seeing charts as a bunch of random candlesticks and start seeing them as a clear map of market intent. This is the first, most crucial step toward building repeatable supply and demand trading strategies. You can learn more about how institutions create these phases in our article about the concepts of accumulation, manipulation, and distribution.
How To Identify High-Probability Supply And Demand Zones
Moving from theory to charts is where the rubber meets the road. Identifying a high-probability supply and demand zone isn't about finding any old turning point. It's about learning to spot the specific anatomy of a true market imbalance.
The real secret is to find where price moved away from an area with sudden, explosive force.
This aggressive departure tells you a significant mismatch between buyers and sellers just went down, almost certainly driven by institutional orders. These are the footprints we want to follow, as they leave behind a trail of unfilled orders that act like magnets for price in the future.
The Anatomy Of A Strong Zone
A high-probability zone has very specific characteristics. It's not just a place where price reversed; it's an area that shows clear evidence of a decisive, one-sided battle.
You're primarily on the hunt for two patterns:
- Rally-Base-Drop (RBD): This carves out a supply zone. Price rallies up, churns sideways for a few candles (the "base"), and then drops away with conviction. Those little basing candles mark our zone.
- Drop-Base-Rally (DBR): This creates a demand zone. Price falls, bases for a bit, and then rockets higher with strong buying pressure. Again, the basing candles define the zone.
That "base" is the crucial element. It represents a brief moment of equilibrium right before a massive imbalance took over and sent price flying. The more aggressive the move away from the base, the stronger the zone. A lazy drift away from a base? That’s a red flag for me.
This diagram helps visualize how institutional orders are the engine behind these zones, which in turn gives us predictable areas to watch.
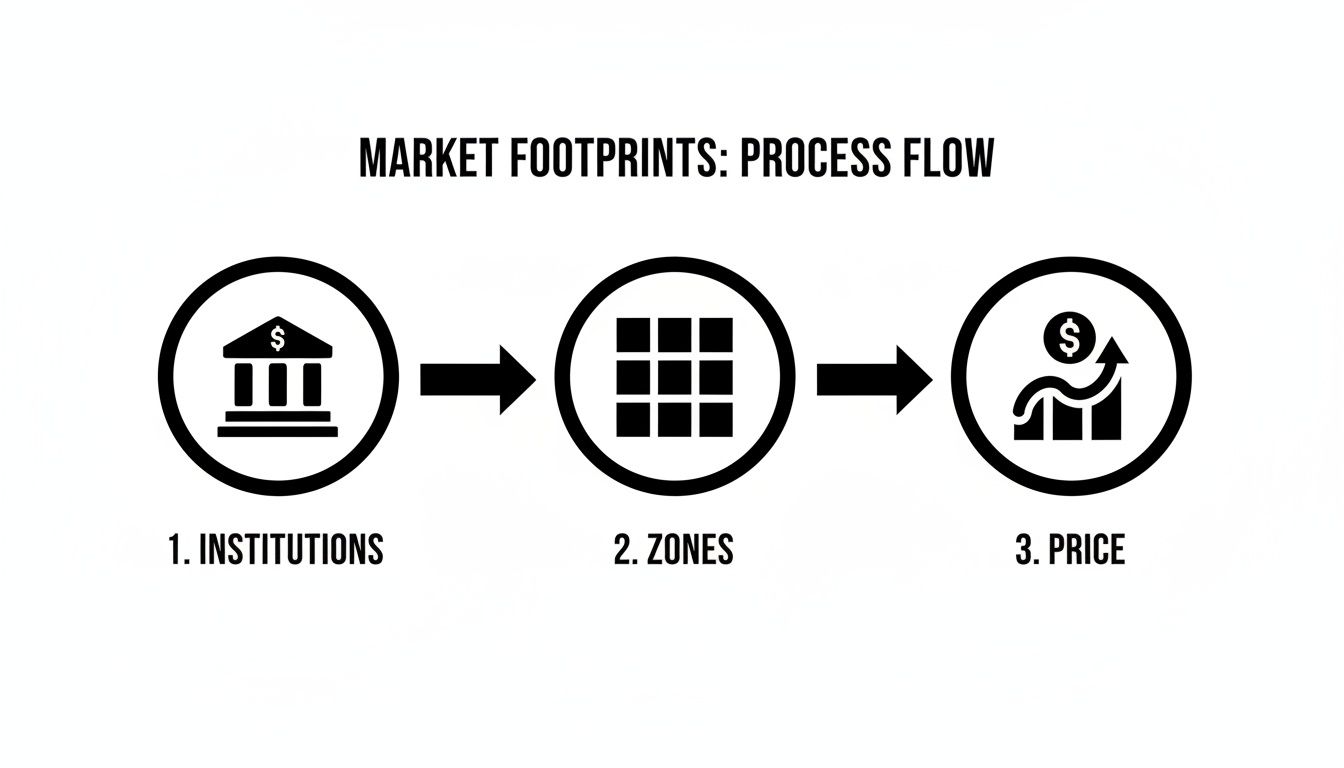
The key takeaway is that the zones we identify are just the visible evidence of the big players making their moves.
Distinguishing Fresh Zones From Weak Zones
Let's be clear: not all zones are created equal. One of the most important distinctions you'll ever make in supply and demand trading is understanding the concept of "freshness."
A fresh zone is a supply or demand area that price has not returned to since it was formed. These are your A+ setups because that stack of unfilled institutional orders is still sitting there, untouched and waiting.
On the flip side, a tested zone is one that price has already revisited. Every time price taps into a zone, it's like a withdrawal from a bank account—it consumes some of those unfilled orders and weakens the level. Think of it like a brick wall; each hit chips away at its integrity.
While a tested zone might hold a second time, the odds diminish with every touch. For traders just getting their feet wet, I can't stress this enough: focusing exclusively on fresh zones is one of the most powerful filters you can apply.
These ideas are foundational to price action and tie in closely with classic support and resistance. If you want to go deeper on how these levels work, our guide on understanding resistance and support provides some excellent context.
A Practical Zone Scorecard Method
To make this less about gut feeling and more of a systematic process, I recommend using a simple scorecard. This gives you an objective way to grade potential zones before you put a single dollar at risk.
For any zone you're considering, give it a point if it meets the following criteria:
- Strength of Departure: Did price leave the zone with long, powerful candles? I want to see an "explosive" move away, signaling a major imbalance. (1 point)
- Room to Move: Is there a lot of clean air to the left of the zone? A zone that smashes through previous price structure is far more compelling than one formed in the middle of choppy, congested action. (1 point)
- Freshness: Is the zone completely untouched since it was formed? As we just discussed, fresh is best. (1 point)
- Risk-to-Reward Potential: Does the zone offer a clear path to an opposing level or a logical target that's at least 2x the size of your stop loss? A good setup needs room to run. (1 point)
Any zone that scores a 3 or 4 is a high-probability setup worth a closer look. If it's scoring a 1 or 2, it's usually best to just move on. It simply lacks the clear institutional footprint I'm looking for.
Pro Tip: When you're starting out, try trading only zones that score a perfect 4/4. This forces you to be incredibly selective and builds the discipline of waiting for the absolute best setups—a habit that will pay dividends for your entire trading career.
Executing Trades With Confidence: Entry And Exit Techniques
Spotting a great supply or demand zone is a fantastic start, but it’s the execution that puts money in your account. This is the exact moment where so many traders stumble, letting hesitation or second-guessing get the best of them. To build truly repeatable supply and demand trading strategies, you absolutely need a clear, mechanical plan for your entry, stop, and target.
Finding a prime setup is only half the battle. How you actually engage with that setup is what determines your results. Let’s break down the practical techniques that give you an edge and let you act with conviction when it matters most.

Choosing Your Entry Method
Your entry style needs to match your personality and how much risk you're comfortable with. There’s no single "best" way to enter a trade, but there is a best way for you. Each approach has its own trade-offs between getting the best price, managing risk, and the odds of your order even getting filled.
There are three primary ways traders tackle this:
- The 'Set-and-Forget' Limit Order: This is the most aggressive and direct method. You simply place a limit order right at the edge of the zone (the proximal line) and let the market come to you.
- The Confirmation Entry: This is a more patient, evidence-based approach. Instead of entering blindly, you wait for the price to poke into your zone and then print a specific signal—like a powerful engulfing candle or a sharp pin bar—that confirms big players are defending the level.
- The Zone Failure (Breakout) Trade: This is a contrarian play. Rather than betting on the zone holding, you anticipate it's going to break. You’d place a stop order just outside the far edge of the zone to catch a powerful breakout move.
Let’s quickly compare these styles so you can see which one resonates with you.
Entry Strategy Comparison
Choosing an entry method is a personal decision that balances your desire for a high win rate against your need for a great price. This table breaks down the pros and cons of each of the three main approaches.
| Entry Method | Best For | Pros | Cons |
|---|---|---|---|
| Set-and-Forget | Traders who can't watch charts all day and want the best possible price. | Excellent risk-to-reward ratio, no screen time required once set. | Higher chance of being wrong, as there is no confirmation the zone will hold. |
| Confirmation Entry | Patient traders who want to increase their win rate by waiting for more evidence. | Higher probability of the trade working out, builds confidence. | You might miss the trade if price turns just before your signal, and you get a worse entry price. |
| Zone Failure | Breakout traders who excel in fast-moving, trending markets. | Can lead to very powerful, momentum-driven moves. | Prone to "false breakouts" that can quickly reverse and stop you out. |
When you're starting out, I highly recommend focusing on the confirmation entry. It forces you to be patient and deliberate, which helps build confidence by trading only when you have more evidence on your side. As you get more experienced, you can start experimenting with the set-and-forget method on your highest-conviction setups.
Placing Your Stop Loss The Smart Way
Your stop-loss is your safety net. It's your get-out-of-jail-free card when a trade goes wrong. Its placement can't be random; it has to be rooted in the logic of your setup. With supply and demand zones, the rule is wonderfully simple and effective.
Always place your stop-loss just a few pips or ticks beyond the distal line—the far edge of your zone.
Why there? The entire reason for the trade is that you expect the zone to hold. If the price manages to break all the way through the other side, your trade idea is completely invalidated. Placing your stop just outside this boundary gives your trade room to breathe and absorb some market "noise" without kicking you out of a trade that has clearly failed.
A classic rookie mistake is putting the stop inside the zone to try and tighten the risk. This massively increases your chances of getting wicked out by a minor price swing right before the real move happens. Let the zone do its job.
Smart Profit Taking Strategies
Your exit is just as crucial as your entry. A brilliant entry is worthless if you let profits evaporate or get greedy. A structured exit plan is the only way to remove emotion from your profit-taking.
Here are two of the most effective strategies for taking profits:
- Target the Next Opposing Zone: This is the most logical approach in the world of supply and demand. If you buy at a demand zone, your first target should be the next major supply zone above you. That’s the most probable spot where sellers will show up in force.
- Use a Fixed Risk-to-Reward Ratio: This is a simpler, more mechanical method. You just aim for a fixed multiple of whatever you risked. Many pros won’t even touch a trade unless it offers at least a 1:2 R:R (risking $1 to make $2). Aiming for a 1:3 R:R is even better.
This fixed-ratio approach is incredibly powerful because it means you don't have to be right all the time to be profitable. With a 1:2 R:R, you only need to win more than 33% of your trades to break even. At a 1:3 R:R, that break-even point drops to just 25%. This is the mathematical edge that underpins long-term consistency.
For a deeper dive, our comprehensive guide offers more detail on how to properly set up a stop-loss and take-profit.
Mastering Risk To Protect Your Trading Capital
Let's be blunt. Even the most powerful supply and demand strategy will blow up your account without an ironclad approach to risk management. This isn't the sexy part of trading, but it's the invisible line that separates the pros from the hopefuls. It’s the very foundation of your survival in this game.
We need to go way beyond the stale advice of "just use a stop-loss." Real capital protection means building a mathematical edge that works for you over hundreds of trades, insulating your account from the inevitable winning and losing streaks.
The Power Of Asymmetric Risk To Reward
The concept that makes professional trading a viable business is asymmetric risk-to-reward. It's a simple idea: structure your trades so that your potential profit is always a multiple of your potential loss. This is the secret sauce that allows you to be profitable even if you lose more trades than you win.
Think about it. If you risk $100 on every single trade, but your average winning trade nets you $300, you only need to be right one-third of the time just to break even. Anything better than that, and you're making money.
This is the complete opposite of how most retail traders operate. They snatch small profits out of fear but let their losing trades run, hoping for a miracle reversal. This creates a negative asymmetry that slowly, or sometimes quickly, bleeds an account dry.
Calculating Your Position Size
The first step to trading like a professional is to stop thinking about risk in dollars and start thinking in percentages. You need to decide on a fixed percentage of your total trading capital you're willing to risk on any single trade.
A widely accepted industry standard is 1% of your account balance. For a $10,000 account, this means risking no more than $100 per trade.
Let's walk through a real-world example:
- Account Size: $25,000
- Risk Per Trade: 1% ($250)
- Trade Setup: You've spotted a solid demand zone on EUR/USD. Your entry is planned for 1.0850, and your stop-loss sits just below the zone at 1.0825.
- Risk in Pips: The distance from your entry to your stop is 25 pips (1.0850 – 1.0825).
- Position Size Calculation: Your risk per trade ($250) divided by your risk in pips (25) and the value of each pip will give you the exact position size. This ensures that if the trade hits your stop, you lose exactly $250—your predefined 1% risk.
This mechanical process removes all emotion and guesswork. Your position size is no longer a "gut feeling"; it's a precise calculation based on your risk tolerance.
By fixing your risk as a constant percentage, your position size automatically adjusts to the trade setup. Wider stops mean smaller positions, and tighter stops mean larger ones, but the dollar amount you stand to lose remains the same, every single time.
The 1-to-2 Ratio Minimum
A cornerstone of sound money management in supply and demand trading is refusing to even consider trades that don't offer at least a 1:2 risk-to-reward ratio (R:R). This means for every dollar you risk, you must have a clear, logical path to making at least two dollars in profit.
This is why serious educators insist that supply and demand strategies are paired with disciplined money management. Professional trading guides often recommend a minimum 1:2 risk–reward ratio. A trader risking $100 per trade systematically targets $200 or more, which means even a 40% win rate can be profitable over a large number of trades. You can dig deeper into how the pros approach supply and demand charting with real-world strategies on colibritrader.com.
Journals and backtests of zone-based methods repeatedly show that when traders risk a small, fixed percentage—usually 0.5%–2.0% per trade—and avoid excessive leverage, major drawdowns stay below that psychologically crushing 20–25% threshold that causes so many traders to give up.
This disciplined approach brings huge psychological benefits. It frees you from the pressure of needing to be right on every trade. When you know one winning trade can wipe out two or even three losses, it becomes much easier to execute your plan calmly and consistently, even during a losing streak.
Using Multiple Timeframes To Improve Your Odds
The best trades are never found by staring at a single chart. The real high-probability setups are the ones that line up with the bigger market picture, where the dominant trend acts like a tailwind pushing your trade forward. This is why top-down, multi-timeframe analysis isn't some fancy, optional technique; it's a fundamental part of a solid supply and demand trading strategy.
When you start your analysis on a higher timeframe, you get crucial context that's completely invisible on the shorter-term charts. This simple habit keeps you from getting chopped up by minor counter-trend noise and, more importantly, stops you from fighting the primary flow of institutional money.
Start With The Big Picture
Always begin your analysis on a higher timeframe, like the weekly or daily chart. This is where you'll spot the overall market direction and locate the most significant, institutionally-backed supply and demand zones. These are the major levels that can control price for days, or even weeks.
Think of yourself as a general surveying the battlefield before sending in your troops. Your first job on the higher timeframe is to answer one simple question: who is in control, the buyers or the sellers?
Once you’ve identified the dominant trend and marked out the major zones, you've established your trading bias. If the daily chart is in a clear uptrend and price is pulling back into a major daily demand zone, your bias is to look for buying opportunities. If it’s in a downtrend approaching a key supply area, your focus shifts to selling. It's that straightforward.
Drill Down for Precision Entries
With your high-level bias set, you can now drill down to lower timeframes, maybe the 4-hour or 1-hour chart. This is where you hunt for your precise, low-risk entry points. You’re not looking for new zones here that contradict the bigger picture.
Instead, you're looking for smaller, more refined supply or demand zones that exist inside the larger zones you've already found. This "nesting" of zones is an incredibly powerful concept. It allows you to get into a trade with a much tighter stop-loss, which can dramatically improve your potential risk-to-reward ratio.
The whole point of multi-timeframe analysis is to find a low-risk entry on a smaller chart that lines up perfectly with a high-probability setup on a larger chart. You're stacking the odds in your favor by making sure both the macro and micro pictures are telling the same story.
Let's say you spot a large, fresh weekly demand zone on GBP/USD. Instead of just placing a market order with a wide stop that covers the entire zone, you wait. Once price enters that weekly area, you switch to a 4-hour chart and look for a classic drop-base-rally pattern to form within it.
That refined 4-hour demand zone becomes your new entry point. Your stop-loss now only needs to go just below this much smaller zone, which massively reduces your risk while keeping you in harmony with that powerful weekly level.
Adapting To Your Trading Style
This top-down approach isn't just for one type of trader; its principles are universal. How you apply it simply comes down to the timeframes you pick.
- For Swing Traders: Your higher timeframe might be the weekly chart, with your execution timeframe being the daily or 4-hour.
- For Day Traders: You could use the daily chart to establish your bias, the 1-hour to find your key zones, and the 5-minute or 15-minute chart for surgical entries.
The process is exactly the same regardless of how long you plan to hold a trade. Always start with the larger perspective to define the trend and key levels, then zoom in to pinpoint a sharp entry. This structured approach helps kill impulsive decisions and grounds your trading in a logical, repeatable framework that moves with the dominant market flow.
How To Validate Your Edge With Backtesting
Confidence in your trading strategy isn't something you can just wish for; it’s forged with cold, hard data. Before you ever think about putting real money on the line, you have to prove to yourself that your approach actually has a statistical edge.
This is exactly what backtesting is for. It’s the process of taking your trading rules and applying them methodically to historical charts to see how they would have actually performed.
This isn't about finding some magic formula that never loses. It's about building a realistic baseline for performance. You need to understand your system's personality—its likely win rate, its average drawdown, its profit potential—and burn those visual patterns into your brain until spotting them becomes second nature. Think of it as a pilot logging hours in a simulator before ever stepping into a real cockpit.
The Manual Backtesting Process
Forget about fancy, complicated software for a moment. Manual backtesting is incredibly simple, surprisingly powerful, and one of the best educational tools you have. All you need is your charting platform.
Just go back in time on a chart—say, six months or even a year—and then scroll forward one candle at a time, making decisions as if you were trading it live.
Your job is to apply your complete set of rules with ruthless consistency:
- Identify Zones: Mark every single supply and demand zone that fits your specific criteria (like the strength of the move away from the zone, or if it's a "fresh" zone).
- Execute Entries: When price comes back to one of your zones, apply your chosen entry technique. Maybe it's a set-and-forget limit order, or perhaps you wait for a specific confirmation candle.
- Manage Trades: For every single setup, you must place your stop-loss and take-profit targets according to your risk management plan. No exceptions.
The most important part? Brutal honesty. Don't skip a trade just because you can see in hindsight it was a loser. You have to log every single setup that meets your criteria, whether it won or lost.
Backtesting is more than just crunching numbers; it's a form of deliberate practice. It trains your eye to recognize high-probability setups in a split second and builds the mental discipline you absolutely need to execute your plan without hesitation when real money is at stake.
Tracking The Metrics That Matter
A simple spreadsheet will become your best friend during this process. For every trade you identify in your backtest, you have to log the critical data points. This is how you turn your subjective chart observations into objective, undeniable statistics.
Your trading journal should track:
- Date and Asset: What did you trade and when?
- Setup Type: Was it a long from a demand zone or a short from a supply zone?
- Entry and Exit Prices: The exact levels for your entry, stop, and target.
- Risk-to-Reward Ratio: What was the potential R:R on the table? (e.g., 1:3)
- Outcome: Did it hit your stop (Loss), your target (Win), or did you get out for another reason?
After you've logged at least 50-100 trades, you'll have a meaningful data set to work with. Now you can calculate your strategy's real-world win rate, your average R:R, and its overall profitability. These numbers are your proof of concept.
Between 2010 and 2020, extensive backtests showed that rule-based supply and demand trading strategies consistently outperformed random entry, mainly because of their asymmetric risk profiles. In fact, a setup targeting a 1:2 risk–reward can be profitable with a win rate as low as 35–40%. Many common zone strategies actually report win rates closer to 50–60% on liquid markets. You can dive deeper by exploring the full analysis on chartswatcher.com.
This data-driven validation is the final, essential step. It’s what replaces fear and hope with genuine statistical confidence, getting you ready to trade not on emotion, but on a proven edge.
At Colibri Trader, we provide the tools and mentorship to help you build and validate your own price action strategy from the ground up. If you're ready to stop guessing and start trading with a proven, repeatable edge, discover your trading potential with our free quiz.