


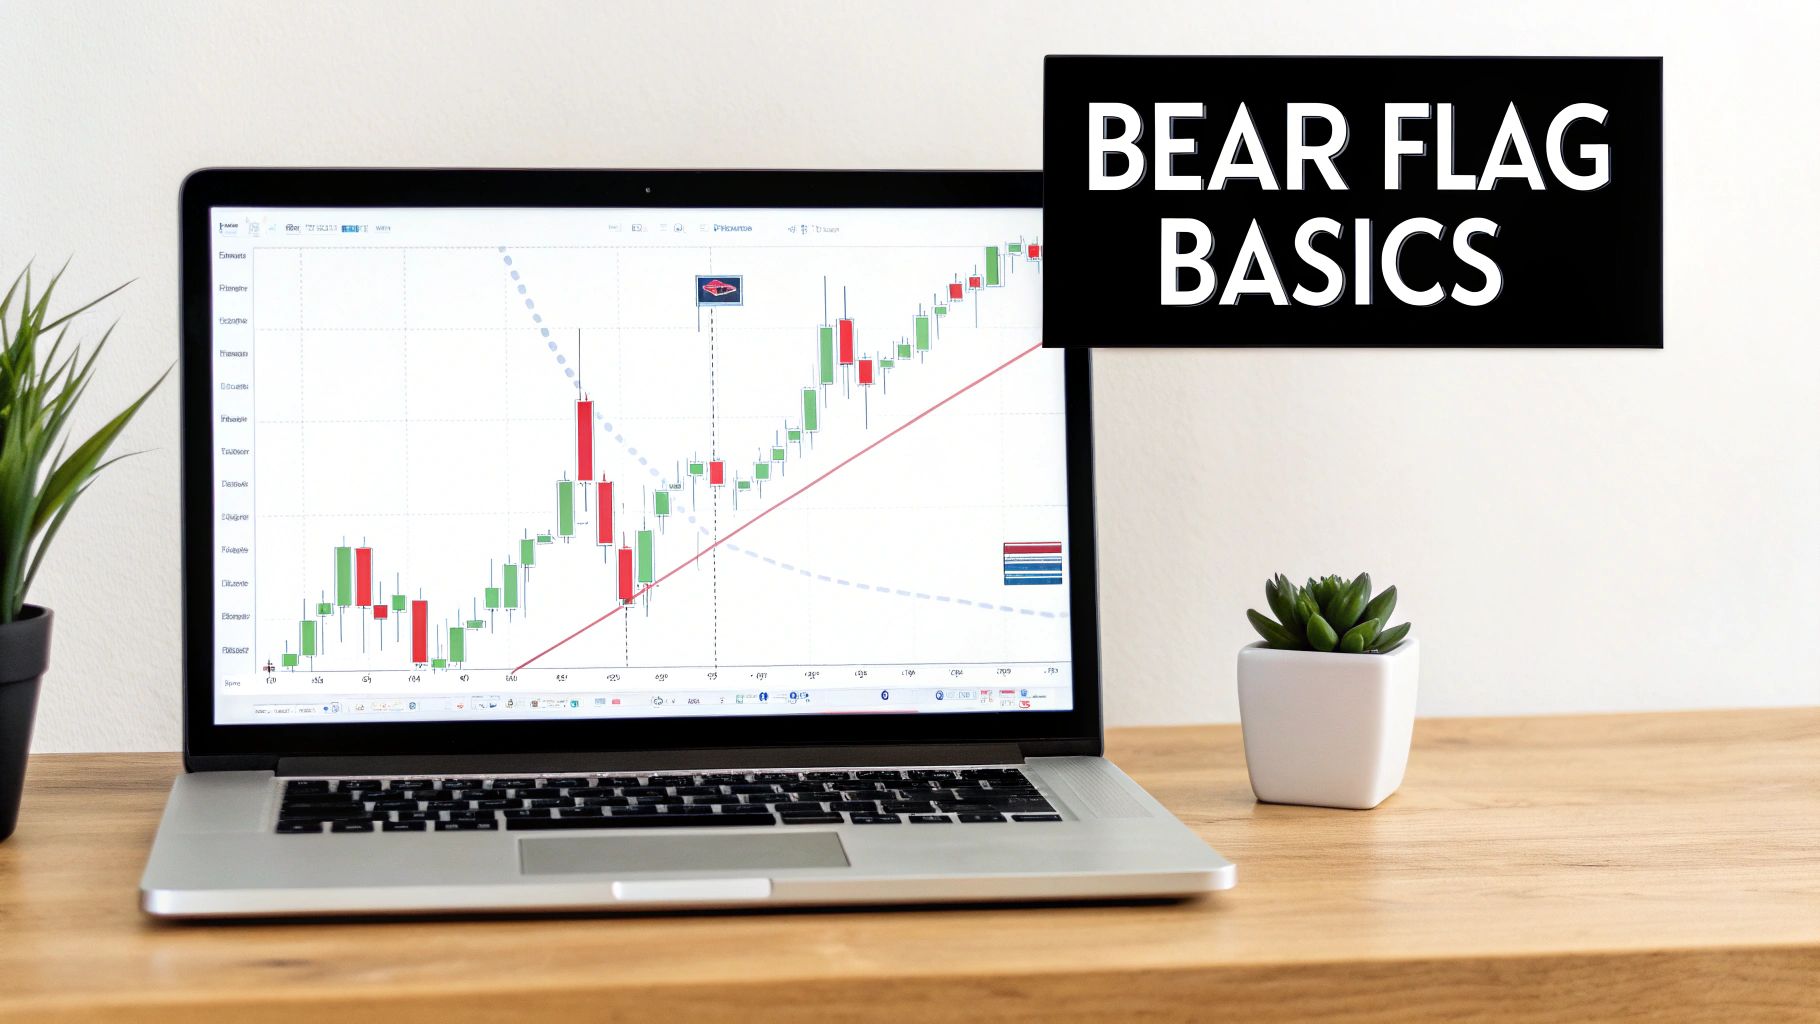
Trading the Stock Bear Flag Pattern

A stock bear flag is a classic technical pattern that tells you one thing: a downtrend is probably about to continue after a quick breather.
It’s made up of two distinct parts: a sharp, aggressive drop in price (what we call the flagpole), followed by a brief, weak rally (the flag itself). This pause is often just a temporary illusion before the stock makes another significant move lower.
What Is a Bear Flag and How Do You Spot It?
Before you can even think about trading a bear flag, you have to be able to spot one with confidence. The best way I can describe it is like watching a ball bounce down a flight of stairs. The first drop is fast and hard, followed by a weak little bounce before gravity yanks it down again.
This whole pattern paints a clear picture of the battle between buyers and sellers—and in this case, the sellers are winning.
At its heart, a bear flag has two parts you absolutely need to identify. Getting these two components right is the first real step to mastering this setup.
The Flagpole
Every bear flag starts with the flagpole. This isn’t a slow, grinding move down; it's a sharp, almost vertical plunge in the stock’s price. Think of a stock getting hit with bad news or just pure panic selling—that's the kind of aggressive move we're looking for.
One of the key signatures of a real flagpole is a massive spike in trading volume. That high volume is your confirmation that sellers are firmly in the driver's seat and there’s real conviction behind the drop. If you don't see that initial burst of selling pressure, you don't have a valid flagpole. It's that simple.
The Flag
Right after that steep decline, the price action shifts into a consolidation phase we call the flag. On a chart, this usually looks like a small, upward-drifting channel or rectangle.
This is where things get interesting. The flag represents a brief pause where some bargain hunters might be stepping in, and some of the early short-sellers are taking a little profit off the table.
But here’s the critical clue: this consolidation happens on much lower volume than the flagpole. The volume just dries up. We're often talking about volume dropping 50% or more compared to the average during that initial sell-off. The flag phase itself is usually pretty short, lasting somewhere between 3 to 10 trading sessions.
This lack of volume is a massive tell. It screams that there's no real conviction from the buyers. The bounce is weak, it's temporary, and it’s setting the stage for the next leg down.
Key Takeaway: The psychology here is pretty straightforward. The flagpole creates fear and panic. The flag offers a moment of false hope. When that hope starts to fade and the price breaks below the flag's support level, the sellers who were just taking a break come rushing back in.
To help you get a feel for this pattern, I've broken down the key characteristics of each component in this table.
Anatomy of a Bear Flag Pattern
| Component | Price Action | Volume Signature | Typical Duration |
|---|---|---|---|
| Flagpole | A sharp, almost vertical drop in price. | Very high, spiking well above average. | Usually forms over 1-3 sessions. |
| Flag | A slight, upward-drifting consolidation channel or rectangle. | Very low, often 50%+ below the flagpole's average. | Typically lasts between 3 and 10 sessions. |
Think of this table as a quick cheat sheet. When you see these characteristics lining up, you know you might have a valid bear flag on your hands.
This pattern is a close cousin to another powerful bearish setup, which you can read about in our deep dive on the bear pennant pattern. Both signal that the sellers are likely to regain control.
Confirming a High-Probability Bear Flag Setup
Spotting a potential bear flag on your chart is one thing. Knowing which ones are the real deal and which are just noise is a completely different skill. Confirmation is everything in this game. It’s about finding a specific set of clues that scream, "The sellers are back in charge!"
Jumping into a pattern without proper validation is just gambling. If you can train your eye to look for a few key confirmation signals, you’ll dramatically boost your odds and filter out those weak, unreliable setups that chew up accounts. Let's get past simple pattern recognition and dig into what makes a bear flag a trade worth taking.
The Critical Role of Volume
If there's one tool you absolutely must use to validate a bear flag, it's volume. Volume tells the story behind the price action, revealing the conviction—or lack thereof—of buyers and sellers.
During the flag's formation, that lazy upward drift, you want to see volume dry up significantly. This is your first major clue. It shows there's no real buying power behind the rally; it's a hollow, weak bounce that's running on fumes.
Then comes the moment of truth. As the price starts to crack below the flag's lower trendline, you need to see a massive surge in selling volume. This isn't just a "nice to have"; it's essential. A breakdown on light, anemic volume is a huge red flag. It often signals a "fakeout" where the price snaps right back into the pattern.
Pro Tip: I look for a high-conviction breakdown candle to close near its low on volume that is at least 50% above its recent average. This is the market telling you that sellers are aggressively taking control and clearing out any lingering buyers.
That spike in volume confirms that the big sellers have re-entered the market with force, ready to push the stock down for its next leg lower. Without it, the reliability of the pattern drops off a cliff.
Analyzing the Breakdown Candle
The breakdown candle itself gives away so much information. Not all breakouts are created equal, and you're looking for a show of force from the sellers.
What you want to see is a large, decisive bearish candle that closes firmly below the flag's support line. A long, solid red candle with almost no lower wick is a powerful sign. It tells you that sellers were in complete control from the open to the close of that bar, and buyers couldn't even put up a fight. This is the kind of decisive move that confirms the pattern is in play. For a deeper dive into what makes for a powerful move, check out our guide on how to trade breakouts.
On the flip side, be very wary of a breakdown candle that has a long lower wick. This suggests that buyers jumped in near the lows and managed to push the price back up, signaling indecision and a higher chance of a failed breakdown.
Stacking the Odds with Market Context
A stock never trades in a vacuum. The most powerful bear flags—the ones that lead to the biggest wins—almost always form when the broader market is also showing signs of weakness. Before you even think about placing a trade, take a quick glance at a major index like the S&P 500 (SPY) or the Nasdaq 100 (QQQ).
Ask yourself a couple of simple questions:
- Is the index in its own downtrend? A bear flag on a stock is far more likely to play out if the overall market tide is already going out.
- Is the market itself breaking a key support level? A bearish breakdown on a major index can provide a powerful tailwind for your short trade.
Trading in sync with the broader market is like swimming with the current instead of fighting it. When you find that perfect bear flag setup on a stock and the overall market is weak, you've just stacked the probabilities firmly in your favor.
Executing Your Trade on a Bear Flag Break
Alright, so you've spotted a high-probability bear flag and you've confirmed it's the real deal. Now comes the moment of truth: execution. This is precisely where a repeatable, disciplined plan makes all the difference. Hope is not a strategy. A solid execution plan is your entire playbook for managing the trade from entry to exit.
Timing your entry is everything. One of the most common mistakes I see is traders jumping the gun before the flag’s lower support line gives way. I always wait for a candle to close below the lower trendline of the flag. A quick dip below that line during the day that snaps right back up isn't a signal—it's a trap.
The infographic below really nails the sequence you want to see before pulling the trigger.
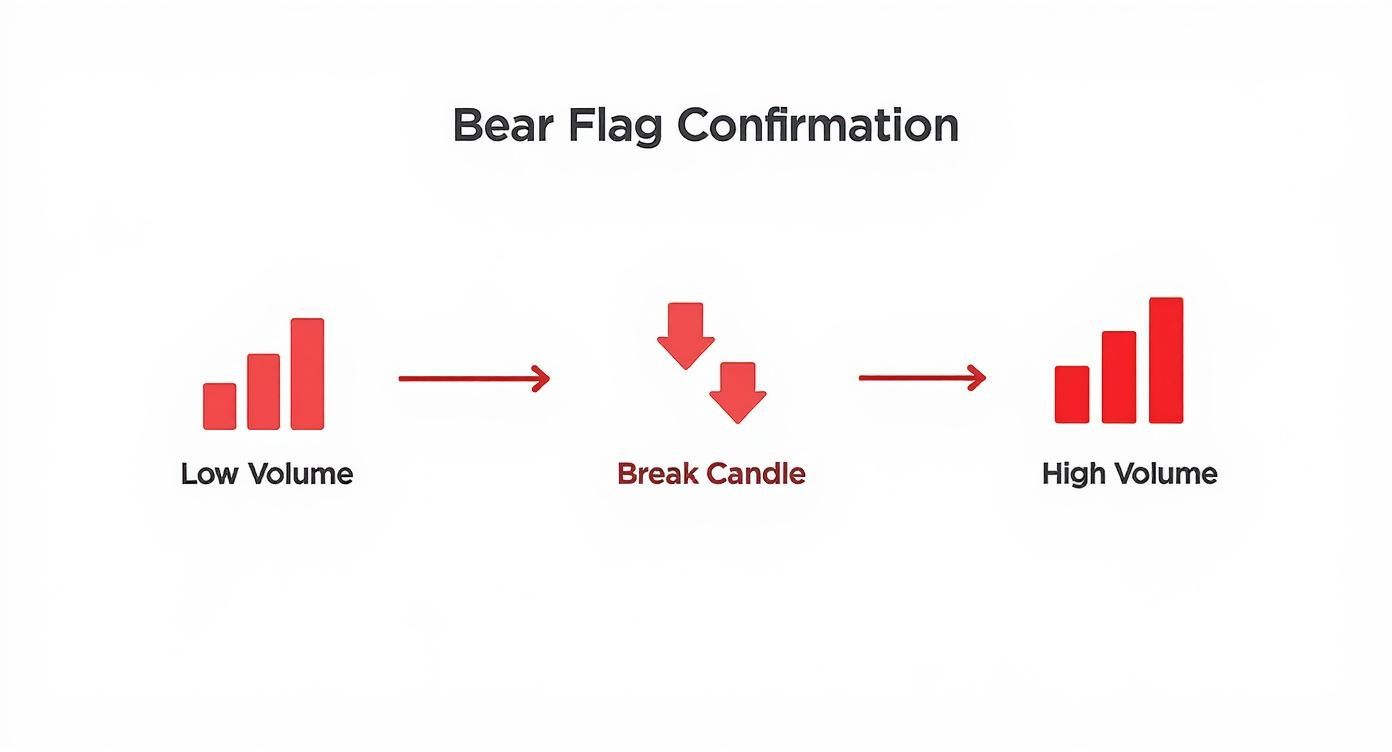
Think of it as a story: the volume fades as the flag forms, then a decisive price break happens, and finally, a surge of sellers comes in to confirm the move. That’s the plot twist you’re looking for.
Pinpointing Your Entry and Stop Loss
The ideal entry point is right as, or just after, that breakdown candle closes. This confirms that sellers were in control for that entire period, which seriously lowers the odds of a violent snap-back rally catching you offside. Chasing a stock after it has already plummeted far below the flag is just bad form; it immediately torches your risk-to-reward ratio.
And before you even think about clicking "sell," you must know exactly where you'll get out if you're wrong. My go-to spot for a stop-loss is just above the high of the flag consolidation. It's the most logical place—if the price rallies back above the flag's peak, the whole bearish idea is busted. For a deeper dive, check out our guide on how to set a proper stop loss.
My Personal Rule: I never risk more than 1% of my trading capital on a single bear flag setup. By setting my entry and stop-loss levels before I trade, I can calculate my position size to the dollar, ensuring one bad trade doesn't blow up my account.
Setting Realistic Profit Targets
With your risk locked in, the last piece of the puzzle is setting a sensible profit target. Getting greedy can quickly turn a winning trade into a loser. I lean on two primary methods to figure out where the stock might be headed.
The Measured Move Technique
This is the classic method for a stock bear flag and for good reason. It’s simple and effective.
- First, measure the distance of the initial flagpole, from the start of the sharp drop down to the lowest point of the flag.
- Next, subtract that same distance from the spot where the price broke down from the flag's upper trendline.
- The price level you end up with is your main profit target.
Identifying Prior Support Levels
The second method involves just looking left on your chart. I scan for previous significant support levels—old battlegrounds where the price has bounced higher in the past. These zones are like magnets for price and are logical places for a downtrend to hit the brakes. If a major support level happens to line up near your measured move target, that's a huge confidence booster.
Ultimately, the breakout is confirmed when you see the price close firmly below the flag’s lower boundary on a spike in volume—often around 50% above average. This tells you the sellers are serious. A textbook example played out with Tesla (TSLA) in 2023, where disciplined traders used stops placed just 1–2% above the flag's high to keep risk tight. This kind of careful analysis allows traders to target the decline projected by the flagpole's length, setting themselves up for a healthy reward-to-risk ratio.
Real-World Examples of Winning and Losing Trades
Theory is great, but seeing a bear flag play out in the wild is where the real learning happens. It’s one thing to see a perfect diagram in a textbook; it's another to watch a pattern form in real-time on your trading screen, with real money on the line.
By studying both successful and failed patterns, you start to build a much sharper eye for what separates a high-probability setup from a costly trap. Let's dig into a couple of real-world scenarios to see why one worked beautifully while another fizzled out.
A Picture-Perfect Breakdown
Think about a volatile tech stock right after a disastrous earnings report. The stock absolutely craters, plunging 15% in a single session on massive, undeniable volume. This creates a powerful, obvious flagpole—the kind you can't miss.
Over the next week, the stock weakly drifts higher inside a tight, orderly channel. But here's the crucial part: the volume completely evaporates. It's a ghost town. This is the classic signature of buyer exhaustion, telling you there’s no real conviction behind the bounce.
Then, the floor gives out. The stock slices cleanly through the flag’s lower trendline as sellers rush back in, confirmed by a huge spike in volume.
- The Entry: We hit the short button right as the breakdown candle closes near its low, confirming the sellers are in complete control.
- The Stop-Loss: Our stop goes just above the highest wick of the flag consolidation. Risk is clearly defined and contained.
- The Result: The stock continues its downward spiral, hitting the measured move target. A clean, profitable trade.
This trade was a textbook win because every single element aligned perfectly: a violent flagpole, a low-volume flag, and a high-volume breakdown, all happening while the broader market was already weak.
Dissecting a Failed Bear Flag
Now for the more painful, but equally important, lesson: the failed pattern. Let’s look at an energy stock that drops sharply, forming what looks like a flagpole. It then chops sideways for a few days, tricking traders into seeing a bear flag.
But if you looked closer, a few subtle warning signs were flashing.
That initial drop? It was sharp, but the volume was just average—not the massive, panicky spike you really want to see. Even more telling, the "flag" itself was a messy, choppy range, not a gentle upward drift. And the volume during this consolidation phase never really dried up. It was inconsistent.
Key Lesson: The most dangerous mistake a trader can make is forcing a pattern that isn't truly there. If the volume signature is wrong or the price action is sloppy, it's far better to sit on your hands and wait for a cleaner setup to come to you.
When the price eventually broke below the messy consolidation, it did so on weak, unconvincing volume. The short-sellers who jumped the gun were quickly squeezed and stopped out as the stock reversed and rallied hard. This failure is a perfect example of why you must have confirmation for every piece of the pattern.
Bear Flag Statistical Performance
Don't just take my word for it. The numbers back up the pattern's reliability when you stick to the high-quality setups. Statistical backtesting provides some fascinating insights into what we can expect.
| Metric | Average Performance | Key Takeaway |
|---|---|---|
| Flagpole Decline | 18% | The initial drop needs to be significant to signal true selling pressure. |
| Continuation Move | 17% | When it works, the follow-through is often nearly as large as the initial drop. |
| Success Rate | 61% | In bearish conditions, over half of valid flags meet or exceed their price targets. |
These statistics show that while no pattern is foolproof, a correctly identified bear flag offers a solid edge. The key is strict qualification. If you're interested in the nitty-gritty, you can explore the full findings of this stock bear flag research on QuantifiedStrategies.com.
Common Mistakes Traders Make with Bear Flags
Even a textbook pattern can bleed your account dry if you trade it with sloppy discipline. I’ve been doing this for years, and I’ve seen countless traders get burned by the exact same handful of mistakes when they try to short a bear flag.
Knowing what these traps are is the first, most critical step to avoiding them.
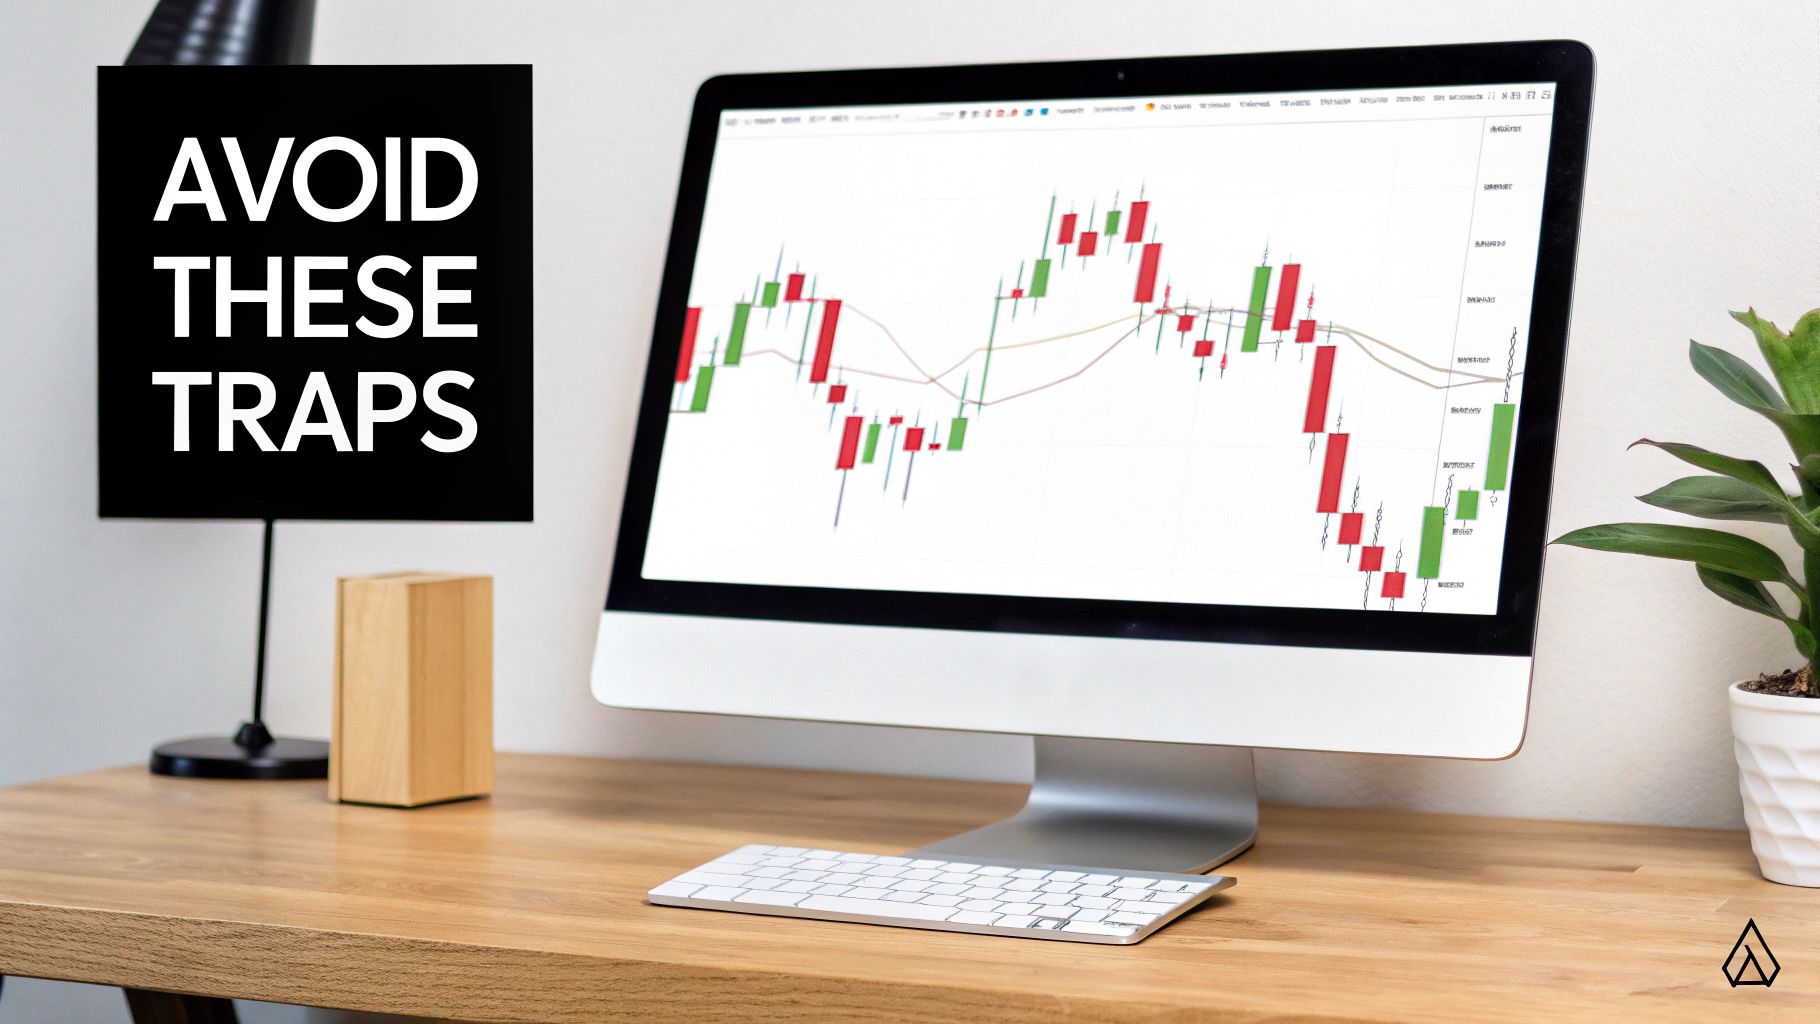
Honestly, most of these errors come down to impatience and not trusting your trading plan. The good news? They are completely avoidable once you know what to look for. Let's dig into the most frequent—and costly—blunders I see.
Jumping the Gun Before Confirmation
This is, without a doubt, the most common mistake. You spot the flag taking shape, and that fear of missing out (FOMO) kicks in. So you jump in and short the stock before the price has actually broken and closed below the flag's lower support line.
It's a classic rookie move. A stock can easily dip below that support line during the day only to get yanked back up, stopping you out for a frustrating loss. You have to wait for a candle to close below the support level, ideally on higher volume. That close is your confirmation that the sellers are in control.
Impatience also shows up when traders misread the consolidation. A real bear flag needs a clear, upward-drifting channel on light volume. If you see messy, choppy, sideways action, that isn't a flag—it's a warning sign of a battle with no clear winner.
My Takeaway: Patience pays dividends. If you feel that anxious urge to get in before the "real" move, you're trading on emotion. A confirmed breakdown still leaves plenty of meat on the bone, but without the high risk of getting faked out.
Chasing the Price After the Move
This is the polar opposite of jumping the gun. You see the breakdown, you see the volume spike, and the stock is already tanking. Panicked that you've missed the whole thing, you chase it down and short it way below the original breakdown point.
This one mistake completely obliterates your risk-to-reward ratio. Your stop-loss still needs to go above the high of the flag, but since your entry is so much lower, you're now risking a ton of capital for a much smaller potential profit. It's a losing proposition from the start.
A few other critical mistakes trip up even experienced traders:
- Ignoring Volume: A breakdown on weak, anemic volume is a massive red flag. It tells you the sellers lack conviction, and the odds of a reversal are high.
- Forcing the Pattern: Trying to see a bear flag where one doesn't really exist is a fast way to give back your profits. If the flagpole isn't a sharp, decisive move down or the flag itself is sloppy, just move on. There will always be another trade.
- Forgetting Market Context: Shorting a perfect bear flag pattern when the S&P 500 is ripping higher is like trying to swim against a powerful current. You might be right about the stock, but the market can drag it up anyway. Always trade with the broader market trend on your side.
How Bear Flags Fit Into the Broader Market Trend
A single chart pattern, no matter how clean the setup, is just one piece of a much larger puzzle. To really elevate your trading, you have to learn to zoom out and see how a stock bear flag fits into the broader story the market is telling.
These patterns don't just appear out of nowhere; they are small, predictable pauses inside a major downtrend.
When you see a bear flag form, you're watching market psychology play out in real-time. The violent flagpole is pure fear and panic selling. The weak, low-volume flag that follows is a brief moment of false hope—just a flicker of optimism from buyers before the dominant sellers inevitably take back control. This little story perfectly mirrors the sentiment of a prolonged bear market.
Understanding this context is everything. It helps you align your trades with the most powerful force in the market: the primary trend. Fighting the trend is a losing game, but finding patterns that confirm it stacks the odds firmly in your favor.
The Bear Flag as a Microcosm of a Bear Market
A bear market is defined by more than just falling prices. It’s a period of sustained negative sentiment where every rally is met with skepticism and is quickly sold off.
It’s within these brief, unconvincing bounces that bear flags are born. The pattern is a crystal-clear visual of seller dominance, showing that any attempt by buyers to regain ground is quickly snuffed out.
This dynamic is backed up by decades of data. Since 1942, the average bear market—a drop of at least 20% from recent highs—lasts about 11.1 months and chops off an average of 31.7% from the market's value. Within these extended downturns, the short-term rallies that form bear flags are common pit stops before the next leg down.
The typical 60–70% continuation rate of a well-formed stock bear flag lines up perfectly with the overarching dynamics of these broader market declines, as you can see in this analysis of bear market trends.
Expert Insight: Viewing a bear flag as a "rest stop" on a larger bearish journey is a powerful mental model. It stops you from getting suckered into the brief rally and keeps your focus on the primary downtrend, which is where the real money is made.
Aligning Your Trades with the Dominant Force
At the end of the day, the most successful traders are the ones who swim with the current, not against it. By understanding that a bear flag is a confirmation signal within a larger downtrend, you can trade with much greater confidence.
Here’s how this perspective completely changes your approach:
- Higher Probability: You’ll naturally start looking for short setups on bear flags when the overall market (like the S&P 500) is also trending down. This simple filter alone will boost your win rate.
- Better Conviction: When you know you have the market's full momentum behind you, it's a lot easier to hold the trade to your profit target instead of getting shaken out by the first small bounce.
- Improved Filtering: You'll learn to be more skeptical of bear flags that pop up during a strong bull market, recognizing them for what they often are—potential traps or, at best, low-probability setups.
Seeing the big picture isn't just a neat analytical trick; it's a core part of a durable trading strategy. When you learn to see the bear flag not just as a pattern but as a symptom of a larger market condition, you move from just reading charts to truly understanding them.
At Colibri Trader, we teach you to master these price action dynamics without relying on confusing indicators. Our programs are designed to give you a clear, repeatable process for profiting in any market condition. To see if our approach is right for you, start by taking our free trading potential quiz. Discover your trading potential with us today!