


Master a Simple Trading Strategy That Works
A simple trading strategy isn't about slapping a few indicators on a chart and hoping for the best. It's a rules-based system, grounded in clear and repeatable price action signals. The whole point is to identify high-probability setups at key market levels, which allows for disciplined execution and, most importantly, effective risk management.
Why Simple Trading Strategies Often Win
So many traders I've seen over the years fall into the same trap: they think a complex system must be a profitable one. They load up their charts with dozens of indicators, creating a tangled mess of conflicting signals. This inevitably leads to confusion and hesitation—a condition many of us know as "analysis paralysis."
The truth? Some of the most consistently successful traders I know rely on pure simplicity.
A straightforward, rules-based approach is your best defense against emotional trading. When you have a crystal-clear plan for your entry, your exit, and your risk, you're far less likely to make those impulsive decisions driven by fear or greed. This disciplined mindset is one of the biggest advantages separating profitable traders from everyone else.
The Edge in Clarity and Consistency
The core benefit of a simple strategy is its focus on market principles that have stood the test of time, like good old support and resistance. Instead of chasing some mythical "holy grail" system, the goal is to master a robust plan that you can execute flawlessly, especially when the pressure is on.
This approach gives you several real-world advantages:
- Reduced Emotional Stress: With fewer variables to juggle, decision-making becomes faster and less draining. It's a game-changer for your mental capital.
- Easier to Backtest and Verify: You can easily test simple rules on historical data. This isn't just an academic exercise; it's how you build real confidence in your statistical edge.
- Promotes Discipline: A clear plan is simply easier to follow. And as any seasoned trader will tell you, discipline is the absolute cornerstone of long-term success.
The objective isn't to predict every single market move. It's to find a small, recurring edge and exploit it with unwavering discipline, over and over again. This is where simplicity truly shines.
Performance Backed by Data
The power of keeping it simple isn't just a theory I like to talk about; the performance data backs it up.
For instance, one study found that a diversified portfolio of just three simple trading strategies, applied to major indices since 2005, generated a compound annual growth rate (CAGR) of 13.1%. It did this with an impressive win rate of 70%.
Now, compare that to the standard "buy-and-hold" approach. Over the same period, it only yielded 9.7% annually and, more painfully, suffered a massive 55% drawdown during the 2008 financial crisis. Ouch. If you're curious, you can find more on long-term strategy performance and see how these systems smooth out returns by being in the market less than 25% of the time.
To really see the difference, let's put the numbers side-by-side.
Simple Strategy vs Buy-and-Hold Performance Snapshot
This table gives a clear, at-a-glance comparison between a rules-based trading approach and a passive buy-and-hold strategy. The numbers highlight the critical difference in risk-adjusted returns.
| Metric | Simple Trading Strategy Portfolio | Buy-and-Hold (S&P 500) |
|---|---|---|
| CAGR | 13.1% | 9.7% |
| Max Drawdown | -15% | -55% |
| Win Rate | 70% | N/A |
| Time in Market | <25% | 100% |
The takeaway here is pretty stark. While the simple strategy generated higher annual returns, the most crucial difference is the dramatically smaller drawdown. Avoiding those catastrophic losses is what keeps you in the game long enough to compound your wins. It’s not just about how much you make, but how much you don't lose.
Reading The Market With Clean Price Action
If you're staring at charts plastered with dozens of lagging indicators, you're probably making trading much harder than it needs to be. I’ve found that the most effective strategies often start with stripping everything away and focusing on one thing: the price itself. This is the heart of price action trading—learning to read the story the market is telling you, free from all the noise.
The entire foundation rests on identifying key support and resistance levels. These aren't just lines I draw at random; they are significant zones where the market's entire mood has shifted in the past. I think of them as battlegrounds where buyers and sellers have had major clashes.
- Support: A price floor where buying pressure repeatedly steps in and overwhelms sellers, causing the price to bounce.
- Resistance: A price ceiling where sellers have historically taken control, pushing the price back down.
To find these critical zones, I stick to the daily and 4-hour charts. Why? Because higher timeframes cut through the chaotic noise of the lower charts, revealing much clearer and more reliable levels. I simply mark the obvious areas on my chart where the price has clearly reversed, more than once if possible.
Identifying Powerful Candlestick Signals
Now, once I have these key levels mapped out, I don't just blindly place an order. That's a recipe for disaster. Instead, the game becomes one of patience. I wait for the price to actually reach one of my zones, and then I watch for a very specific candlestick pattern to form. This pattern is my trigger, my confirmation that the bounce or rejection I anticipated is likely getting underway.
Two of the most dependable and easy-to-spot patterns I rely on are the engulfing bar and the pin bar.
- Bullish Engulfing Bar: This pattern typically forms at a support level. It's a large bullish candle that completely "engulfs" the body of the previous, smaller bearish candle. To me, this signals a sudden and powerful shift in momentum to the buyers.
- Bearish Pin Bar (Shooting Star): This one appears at resistance. It has a small body and a long upper wick, showing that buyers tried to rally but were smacked down hard by sellers.
These signals give me tangible proof that the institutional-level buying or selling I was hoping for is actually taking place. You can dive deeper into these ideas in my detailed guide on how to trade price action.
The absolute key here is patience. You must wait for the signal candle to fully close on your chosen timeframe. Jumping in early out of fear of missing out is a classic rookie mistake.
The Statistical Edge of Price Action
This approach isn't just about spotting pretty patterns; it's about playing the probabilities. I've found that specific patterns at these key levels carry a real statistical edge. For example, some backtests on a simple strategy—buying the SPY ETF after a bullish reversal signal and holding for just one day—have shown a consistent win rate over 62% since 2017. There’s a reason these setups are popular; they offer a repeatable edge. If you're interested, you can discover more about the statistical analysis of trading patterns and see how this kind of data can build a trader's confidence.
By layering high-probability zones with high-probability signals, you've just built a robust framework for a truly simple trading strategy. You’re no longer just guessing where the market might go. You're executing a well-defined plan based on the market's own behavior.
Executing Your Trades with Clear Rules
Spotting a great setup is one thing, but that's only half the battle. I’ve seen countless traders find a perfect signal only to let it slip away through sloppy or emotional execution. A perfect setup is worthless if you can't act on it correctly.
This is exactly why we need a crystal-clear, rules-based framework for getting in and out of trades. This simple trading strategy isn't about gut feelings or guesswork; it’s all about mechanical precision.
The entire process is built to kill hesitation and second-guessing. You've already done the tough part by mapping out your key price levels. Now, your only job is to sit on your hands and wait for the market to come to you and give you a specific trigger. This is what separates the consistently profitable traders from the ones who are always frustrated.
Defining Your Exact Entry Trigger
Your entry trigger has to be non-negotiable. It's the one thing you can't compromise on. For this strategy, you are waiting for one of your chosen candlestick patterns—like a pin bar or an engulfing bar—to form directly at your pre-identified support or resistance zone.
Here's the most critical part of this rule: you must wait for the candle to fully close. If you're trading on the 4-hour chart, you have to wait for that entire 4-hour period to finish. It’s incredibly tempting to jump the gun when you see a perfect-looking pattern forming, but trust me, that's a classic rookie mistake. A promising signal can completely fall apart in the last few minutes, turning a great setup into a nasty trap.
Think of it like this: a forming candle is just market noise. A closed candle is a confirmed statement of intent from buyers or sellers.
Setting Your Exit Plan Before You Enter
You must have your exit plan locked in before you even think about clicking the buy or sell button. Trading without a predefined exit is like flying a plane with no destination—you’re just burning fuel until you eventually crash. This is a core part of any simple trading strategy that actually works in the real world.
Your exit plan is made up of two crucial price points:
- Profit Target: Your take-profit order should be placed at the next logical, opposing price barrier. If you buy at a support level, your target is the next clear resistance level above it. This keeps your expectations grounded in the market's actual structure.
- Stop-Loss: Your stop-loss is your non-negotiable safety net. Place it just beyond the signal candle that got you into the trade. For a bullish pin bar, that means a few pips below its low. For a bearish engulfing bar, it would be just above its high.
Having this plan in place completely removes emotion from your exit decisions. You aren't closing a trade because you feel greedy, and you aren't widening your stop-loss because you're scared. The rules make the decision for you.
A trader's real job isn't to predict the future. It's to find a statistical edge and then execute a plan with flawless discipline. The market will handle the rest.
From my own experience, I can tell you that the hardest part of trading is often doing nothing. It’s the waiting. It’s having the patience for that perfect alignment of your price level and your signal. But this patience is exactly what shields your capital from low-quality, high-risk trades. You're not a gambler trying to catch every little wiggle; you're a methodical operator waiting for the odds to be stacked heavily in your favor. That shift in mindset changes everything.
How to Manage Risk and Protect Your Capital
It's easy to get carried away when you spot what looks like a perfect entry signal. But that excitement means absolutely nothing if one bad trade can blow a hole in your account.
Let me be clear: effective risk management is the true cornerstone of survival in this business. It's what separates the pros from the gamblers. A genuinely profitable trading strategy is just as much about cutting your losses as it is about letting your winners run.
The single most important rule you can adopt, starting right now, is the 1% Rule. This isn't a suggestion; it's a non-negotiable principle for capital preservation. You should never risk more than 1% of your total trading capital on any single trade.
With a $5,000 account, your maximum loss on one trade is $50. If you’re trading with $20,000, it’s $200. Simple. This discipline ensures that a string of losses—which every single trader will face—is just a minor drawdown, not a catastrophic event that takes you out of the game for good.
Calculating Your Position Size
Following the 1% Rule isn't about guesswork; it requires a quick calculation before you ever click the buy or sell button. Your position size must be based on your account balance and your stop-loss distance, not on how "confident" you feel about a particular setup.
Let's walk through a real-world scenario:
- Account Balance: $10,000
- Max Risk Per Trade (1%): $100
- Trade Setup: You see a bullish pin bar forming right at a key support level on the EUR/USD chart. Your planned entry is at 1.0750, and you decide to place your stop-loss just below the support at 1.0700.
- Stop-Loss Distance: The distance from your entry to your stop is 50 pips (1.0750 – 1.0700).
Now, you use this information to calculate the exact position size that ensures if your stop-loss gets hit, you only lose your predetermined $100. This mechanical process strips emotion out of the equation and builds the discipline you need for consistency.
While there are plenty of online calculators to do the math, it’s crucial you understand the concept behind it. For a deeper dive, our guide on managing trading risk offers more practical insights.
Using Risk-to-Reward Ratios for a Mathematical Edge
Protecting your downside is just one half of the puzzle. The other half is making sure your winning trades are significantly larger than your losing ones. We measure this with the risk-to-reward ratio (R:R).
A simple, robust trading strategy gets its edge by focusing only on trades where the potential reward is at least twice the potential risk. This is what we call a 2:1 risk-to-reward ratio.
If you risk $100 on a trade, your profit target should be at a level that would net you at least $200. This structure means you can be wrong more often than you are right and still be profitable over the long run.
Think about the raw math for a second. With a 2:1 R:R, you only need to win one out of every three trades just to break even (before commissions). If your win rate is just 40%, you're already comfortably profitable. This statistical buffer is what gives a simple trading strategy its longevity.
Common Pitfalls and How to Sidestep Them
Let's be honest. Even the best, most straightforward trading strategy will hit a rough patch. There will be times when it feels completely broken. The market is a living, breathing thing—its character is always shifting, and no single system can be a perfect fit for every single condition.
Knowing the common challenges you'll face before they happen is the single best way to protect your capital and, just as importantly, your confidence.
One of the most maddening things you'll experience as a trader is getting caught in a "whipsaw." This is what happens in those choppy, sideways markets where the price just can't seem to make up its mind. A great-looking price action signal might pop up, you jump into a long position, and bam—the market immediately reverses and stops you out. A moment later, a bearish signal appears, you go short, and the exact same thing happens. Vicious cycle.
Even if you’re sticking to your risk rules like glue, these small, back-to-back losses are brutal on your psychology.
The Trap of Overcomplicating Your Strategy
So, you’ve just taken a string of losses. The first thought that creeps into your mind is, "This strategy is too simple. It's missing something." The temptation to "fix" it by bolting on another indicator—maybe an RSI for extra confirmation, or a stochastic oscillator—is massive.
This is a classic, critical mistake.
Adding more variables doesn't solve the problem; it just muddies the water. It dilutes the very edge your original, simple strategy was built on. Before you know it, you're staring at conflicting signals, which leads to hesitation and analysis paralysis. Then, when the good, trending market conditions finally return, you're too gun-shy to pull the trigger.
A professional trader doesn't try to "fix" the strategy. They recognize the market environment simply isn't right for their system and have the discipline to step aside.
Think about the popular moving average crossover strategy. Backtests show it gets absolutely shredded in directionless, ranging markets. It often underperforms a simple buy-and-hold approach during these periods. The win rates for these simple systems can hover around 50-60%, which really drives home how vital solid risk management and market awareness are. You can read more on how backtesting trading strategies reveals these vulnerabilities.
The goal isn't to find a strategy that never loses. It's to find a strategy you can execute with unwavering discipline, knowing full well that losing streaks are just part of the game.
Staying Disciplined and Keeping It Real
A simple trading strategy is not a magical ATM that spits out cash. It’s a tool. A tool designed to exploit a statistical edge over a large series of trades. That’s it. The real key is avoiding the common trading blunders that will absolutely torpedo your progress.
Sidestepping these pitfalls really boils down to two things:
- Market Awareness: Learn to recognize when the market is choppy and directionless. This isn't the time to be a hero and force your strategy. It’s often smarter to protect your capital and wait for the clear trends to re-emerge.
- Unyielding Discipline: When you inevitably hit a losing streak, do not change your rules on the fly. Review your trades. Did you follow your plan perfectly? If the answer is yes, then you have to accept those losses as the cost of doing business in the markets.
By having a realistic view of your strategy's limits and mentally preparing for these challenges, you can navigate the inevitable rough patches without wrecking your long-term goals. For a deeper dive, we have a great guide on the biggest trading mistakes to avoid that will help hammer these principles home.
Putting It All Together: A Practical Checklist
Theory is one thing, but what really separates profitable traders from everyone else is disciplined execution. To make this simple strategy something you can repeat trade after trade, you need a pre-flight checklist.
Think of it as a set of non-negotiable questions you must answer before risking a single cent. This isn't just about reviewing the rules; it's about building a barrier against your own bad habits, especially when the market gets chaotic and your emotions are running high.
Your Pre-Trade Confirmation
Before you even think about hitting the "buy" or "sell" button, you have to be able to give a hard "YES" to every single one of these questions. If even one answer is "no," you walk away. No exceptions. No "what ifs."
- Is price at a major support or resistance level I identified beforehand? This is your first filter. It confirms you’re trading from a position of strength, not chasing price in the middle of nowhere.
- Has a clean, qualifying candlestick signal actually formed? And by that, I mean a fully closed pin bar or engulfing bar that clearly signals a potential reversal. No jumping the gun on a candle that's still forming.
- Is my stop-loss placed in a logical spot? It absolutely must be just beyond the high or low of your signal candle. This is your shield; it protects you if the signal fails flat on its face.
- Does this trade offer at least a 2:1 risk-to-reward ratio? Your potential profit target needs to be at least twice the distance of your stop-loss. If it's not, the trade simply isn't worth the risk. Period.
- Have I calculated my position size correctly? This is crucial. Your trade size must be calculated so that if your stop-loss gets hit, you lose no more than 1% of your total account balance.
This process is what professional risk management looks like in the real world.
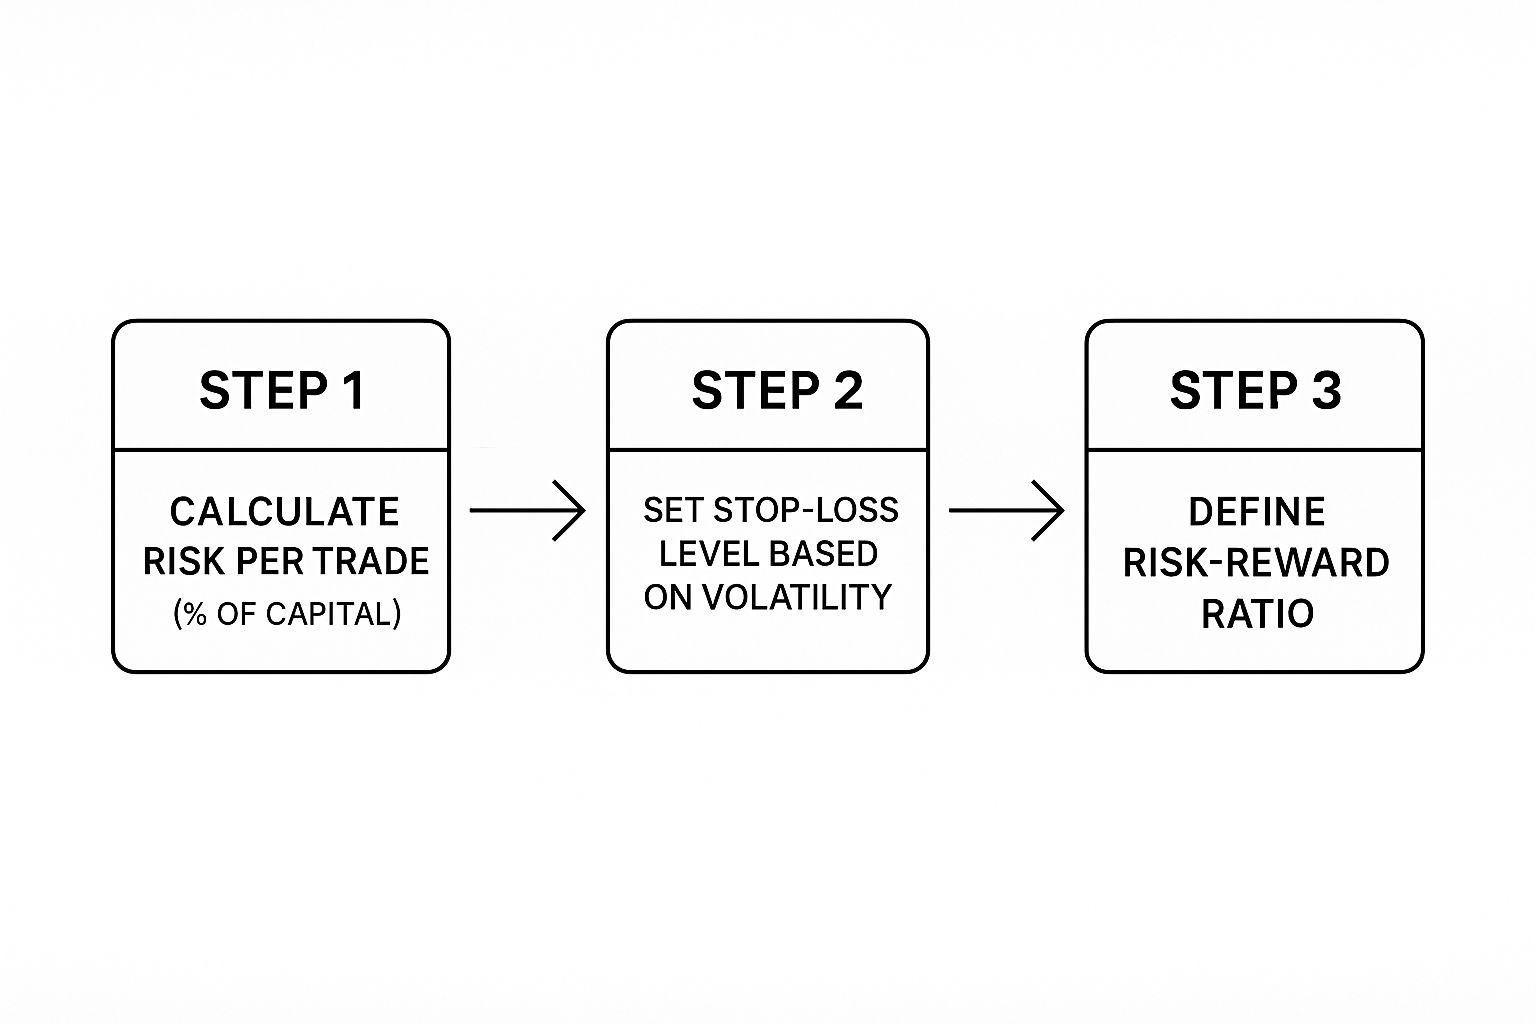
The image above breaks it down perfectly. You start with your fixed risk percentage, define your exit based on the chart, and then make damn sure the potential reward justifies the risk you're taking.
From Checklist To Habit
Using this checklist consistently does more than just keep you out of bad trades; it forges the very habits that define professional traders. I've worked with countless experienced traders, and they all have a similar routine to stay grounded and objective, especially after a tough losing streak or during wild market swings.
A checklist turns the emotional act of trading into a disciplined, logical process. It's not about being a perfect trader; it's about having a perfect process.
This simple tool is the final piece of the puzzle, turning what you've learned here into a routine you can execute without thinking. It bridges that huge gap between knowing what to do and actually doing it consistently. By making this checklist a mandatory part of your workflow, you build a powerful defense against your own worst enemy: your emotions.
You Asked, We Answered
Even the most straightforward trading approach can leave you with questions. It's only natural. You want to iron out the details before you put your hard-earned capital on the line. I get it.
Here are some of the most common questions traders have when they first start using this price action strategy.
What Is the Best Timeframe for This Strategy?
This strategy is flexible, but I've found it works best—and with a lot less stress—on the higher timeframes. I'm talking about the 4-hour and daily charts.
These charts are great because they naturally filter out the chaotic "noise" of the lower timeframes. You'll see cleaner, more reliable support and resistance zones, which leads to higher-quality trading signals.
Trying to use this on the 5-minute or 15-minute charts is a completely different ballgame. It demands split-second decisions and throws a ton of false signals your way. That's exactly the kind of emotional, frantic trading we're trying to avoid here.
How Many Trades Should I Expect to Take?
This is a quality-over-quantity game. The entire philosophy is built on patience—waiting for the market to come to you and offer a truly A+ setup.
Don't be surprised if you only find a few good trades a week, especially if you're just watching a handful of pairs. The goal is not to trade often, but to trade exceptionally well.
Honestly, it's far better to end the week with zero trades than to force a mediocre one out of boredom. That’s a one-way ticket to giving back your profits. The market will always be there tomorrow with fresh opportunities.
A huge part of mastering any simple trading strategy is learning to sit on your hands. Your job isn't to hunt for action. It's to wait for the perfect moment when your rules all line up.
Can This Strategy Be Used for Any Market?
Yes, absolutely. The principles of support, resistance, and price action are universal. They're based on raw market psychology—the tug-of-war between buyers and sellers—which is present in every freely traded market.
You can apply this approach to:
- Forex currency pairs
- Stocks and indices
- Commodities like gold and oil
- Even something as wild as cryptocurrencies
The key, however, is to respect the unique personality of each market. Crypto, for instance, is famously volatile. That just means you need to be even more disciplined with your risk management, maybe using smaller position sizes to account for the massive price swings.
My advice? Always paper trade a new asset first to get a feel for its rhythm before you put real money to work.
What if I Experience a Long Losing Streak?
First, understand that losing streaks are a non-negotiable part of trading. They happen to everyone, no matter how good their strategy is. It’s just a statistical reality of the markets.
This is exactly why the 1% risk rule is the most critical piece of this entire puzzle. If you stick to it religiously, a string of five or even ten losses in a row is just a manageable drawdown. It’s not an account-killer.
When you do hit a rough patch, the best thing you can do is take a break. Seriously. Step away from the charts for a day or two. Let your mind reset.
Then, open your trading journal and ask yourself the tough question: "Am I following my rules to the letter?" More often than not, a losing streak is either just bad luck or a sign that the market is in a choppy, unfavorable state for your system. It almost never means the strategy itself is broken.
Ready to stop guessing and start trading with a clear, repeatable plan? Colibri Trader provides the no-nonsense, price-action education you need to build confidence and consistency. Ditch the confusing indicators and learn a strategy that works.