


A Trader’s Guide to the Rising Wedge Pattern
The rising wedge pattern is a classic bearish signal that every trader should have in their arsenal. Think of it as a warning sign in technical analysis that an uptrend is running out of steam and might be ready to reverse.
Imagine a mountain climber still heading up, but the path is getting narrower and steeper. Each step is a struggle. While they're still gaining altitude, you can see the exhaustion setting in before a potential fall. That's the rising wedge in a nutshell.
Decoding the Rising Wedge Pattern
At its heart, the rising wedge tells a story of a struggle between buyers and sellers where the buyers are clearly losing their mojo. The price is still technically making higher highs and higher lows, but the upward pushes are becoming less and less impressive.
This price action creates a very distinct shape on your chart: two trendlines, both sloping up, but squeezing closer and closer together.
The lower trendline (support) is usually steeper than the upper one (resistance). This is the key detail. It shows that even though buyers are pushing the price up from the lows, they just can't manage to hit proportionally higher peaks. This loss of momentum is a massive red flag.

Key Characteristics to Remember
To really get a feel for this pattern, you need to know its core components. These are the non-negotiables that separate a true rising wedge from any other look-alike formation on your chart.
- Established Uptrend: This pattern has the most punch when it shows up after a solid run-up in price.
- Converging Trendlines: Both support and resistance lines have to be pointing up, but they also have to be narrowing toward each other.
- Declining Volume: This is a huge confirmation signal. As the wedge forms, you'll often see trading volume start to dry up, which tells you the conviction behind the uptrend is fading fast.
- Bearish Breakout: The pattern is only confirmed when the price breaks down below the lower support trendline with authority.
The Psychology Behind the Price Action
The rising wedge is a powerful chart pattern because it visually represents weakening bullish momentum and growing confidence among the sellers. As the pattern typically forms over 10 to 50 trading periods, the shrinking price range signals that a big move is just around the corner.
The pattern is a potent bearish reversal signal. It hints that the upward momentum is fading and a downward move is likely, representing a subtle battle where weakening buyers are slowly losing ground to strengthening sellers.
How to Identify a Rising Wedge on Any Chart
Spotting a rising wedge on a chart is less about textbook definitions and more about training your eye to see a specific story unfold. Think of it like a detective—you're looking for a series of clues that, when put together, point to a potential bearish reversal.
The whole pattern is built on two trendlines. Price is climbing, but it starts getting squeezed between two upward-sloping lines that are moving closer together. Getting these lines right is the first and most critical step. If you need a refresher, our guide on how to draw trend lines is the perfect place to start.
The Non-Negotiable Criteria
Not every narrowing shape you see on a chart is a true rising wedge. For the pattern to have any real predictive power, it needs to tick a few very specific boxes. These rules are your filter, helping you weed out the weak signals from the high-probability setups.
- An Existing Uptrend: First things first, the market has to be in an uptrend. The rising wedge is a reversal pattern, so it needs something to reverse.
- Two Converging Trendlines: Both your support line (connecting the lows) and your resistance line (connecting the highs) must be pointing up. The key detail is that they are converging, squeezing the price into a tighter and tighter range.
- Multiple Touches: A good rule of thumb is to look for at least three distinct touches on both the support and resistance lines. Some traders might act on two, but three touches give the pattern much more validity. It proves both buyers and sellers are respecting those boundaries.
Here's the real giveaway, the subtle detail many traders miss: the lower support line will almost always be steeper than the upper resistance line. This tells you that even though buyers are pushing up to create higher lows, they're losing steam. Their buying pressure isn't strong enough to create proportionally higher highs.
The Critical Role of Volume
Price is only half the story. To get the full picture, you have to look at volume. Ideally, for a textbook rising wedge, you want to see volume declining as the pattern forms.
This is a classic divergence, and it's a huge red flag. Price is creeping higher, but fewer and fewer market participants are involved. The enthusiasm is just drying up. It's like a party where the music is still playing but people are slowly heading for the door. This weak foundation makes the price structure incredibly fragile and ripe for a breakdown.
Putting It All Together: A Step-by-Step Checklist
So, when you're scanning your charts—whether it's stocks, forex, or crypto—run through this simple mental checklist to confirm what you're seeing.
- Confirm the Trend: Is the asset clearly in an established uptrend?
- Draw the Trendlines: Connect the swing highs to form the resistance line and the swing lows for the support line.
- Check for Convergence: Are both lines angled up and squeezing together into a wedge shape?
- Count the Touches: Do you have at least three solid touches on each line?
- Analyze the Volume: Is volume generally tapering off as the wedge tightens?
If you can confidently answer "yes" to these questions, you’ve found a high-probability rising wedge. You're not just seeing shapes; you're reading the market's behavior and making an informed decision.
The Market Psychology Driving the Pattern
Every single pattern on a chart tells a story. It's a visual record of the never-ending fight between the buyers (the bulls) and the sellers (the bears). The rising wedge is a particularly juicy story—one of fading optimism and an approaching power shift. It reveals the subtle change in market mood long before the final, dramatic breakdown.
The story starts with a clear, established uptrend. The buyers are in charge, confidently pushing prices higher. This first phase is all about strong rallies and a general feeling of greed. Everyone wants in, and the momentum feels like it could go on forever.
The Slow Grind of Waning Confidence
As the rising wedge starts taking shape, the first cracks appear in the bullish armor. Buyers are still showing up, defending prices and creating higher lows. But something's different. Their strength is fizzling out.
They can no longer shove the price to proportionally higher highs. Each new peak is just barely above the last one, which is a classic sign of exhaustion and a serious loss of momentum.
This slow, grinding ascent is the key part of the narrative. It shows the market shifting from conviction to uncertainty. That tightening price range tells you the powerful force that drove the uptrend is now on its last legs. This is where smart traders really start to pay attention, sensing a change in the wind. To get a better handle on this emotional tug-of-war, digging into the broader psychology of trading can be incredibly insightful.
The core conflict in a rising wedge is pretty simple: buyers are still trying to push the price up, but sellers are starting to step in at progressively lower levels. This quiet increase in selling pressure is what squeezes the price into that tell-tale wedge shape.
The Climax and the Breakdown
Volume often plays the role of the narrator in this story, confirming what we suspect about the shifting sentiment. Statistically, the predictive power of a rising wedge really depends on this detail. As the pattern matures, volume usually dries up, dropping anywhere from 20% to 50%. This shows that fewer and fewer traders are willing to chase the asset at these high prices.
When the breakdown finally happens, volume often surges by more than 30%, confirming that the sellers have officially taken over.
The break below the lower support trendline is the climax of our story. It’s the moment the exhausted bulls can no longer hold the line, and all that pent-up selling pressure is unleashed. The sellers, who were patiently waiting for their moment, finally overwhelm the buyers, triggering a sharp and often decisive crash. This final chapter confirms the bearish reversal the pattern was telegraphing all along.
A Complete Rising Wedge Trading Strategy
Spotting a rising wedge is one thing—turning it into a winning trade is another. You need a simple, rule-driven plan built around three pillars: your entry trigger, stop-loss placement, and profit target. Without each step mapped out, you’re flying blind.
This playbook walks you through a short-trade setup once a valid rising wedge has formed. Think of it as a checklist to clear confusion when prices start to crack.
Pinpointing Your Entry Signal
The hardest part is waiting. You don’t want to short while price still dances inside the wedge—that’s a ticket to frustration.
Look for these two confirmations:
-
A Confirmed Breakdown
Wait for a full candle to close below the lower trendline. That close shows sellers are genuinely in charge. -
A Spike in Volume
A low-volume drop can lead to a quick snapback. A clear surge in selling volume adds weight to the break.
Setting Your Stop-Loss For Protection
Every trade deserves its own safety net. In a rising wedge, your stop-loss sits just above either the breakdown candle’s high or the most recent swing high inside the wedge. If bulls fight back and push price above that level, you exit small and neat.
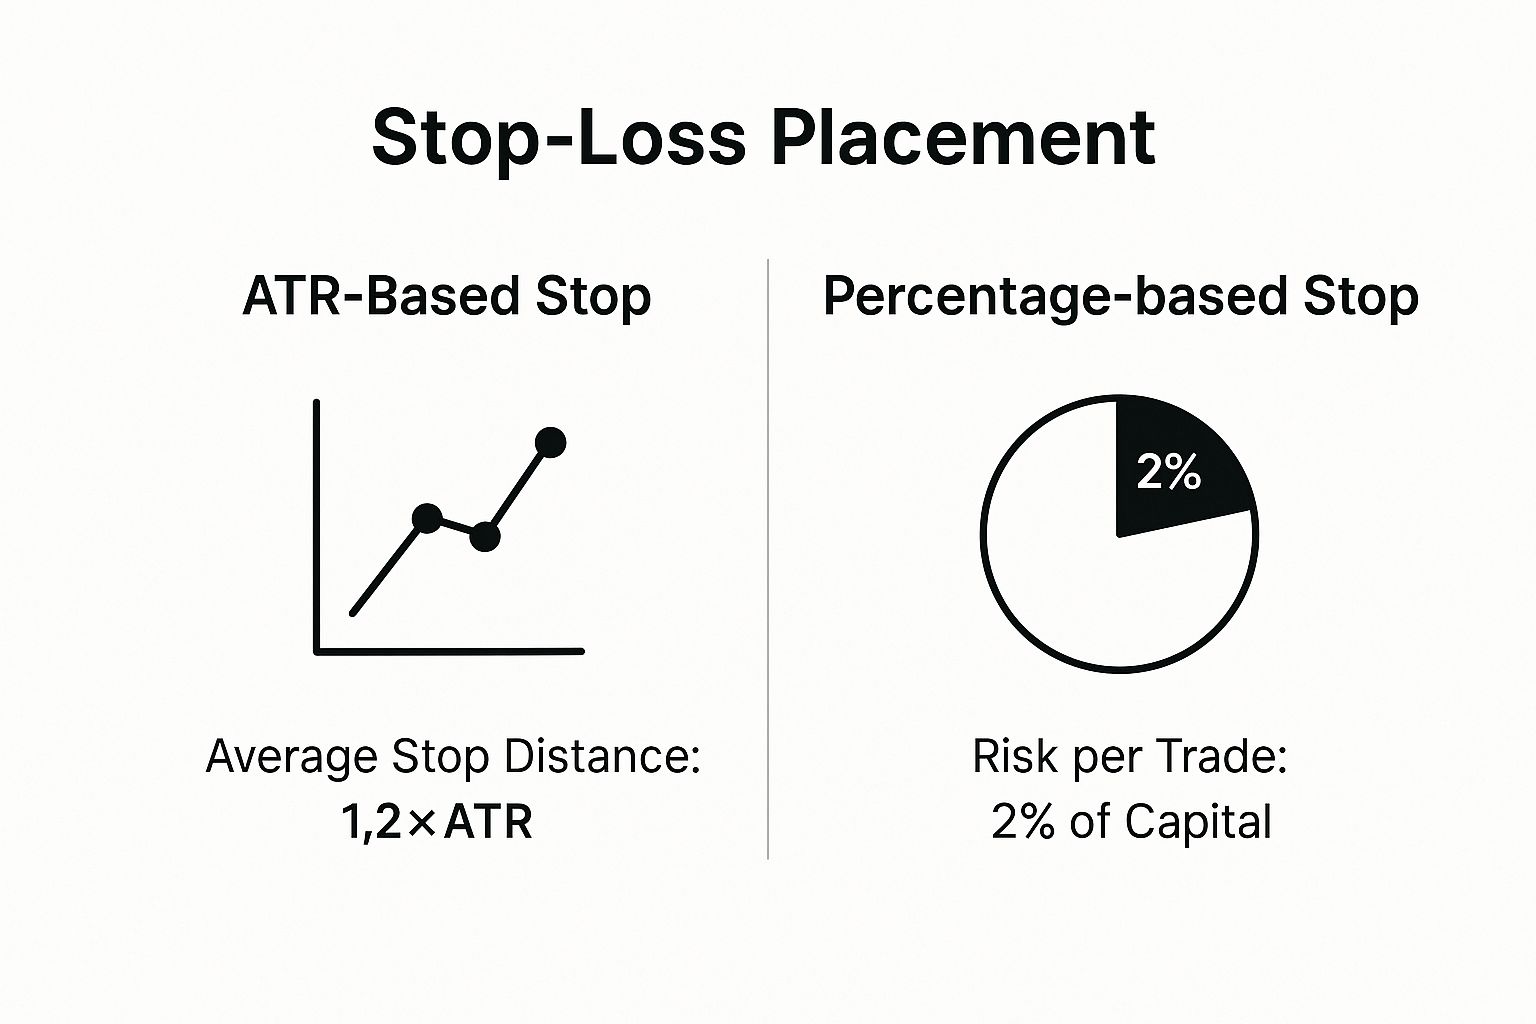
This visual shows how you can choose a volatility-based cushion like ATR or a straight fixed percentage of capital to define your risk.
Calculating Your Profit Target
With entry and risk sorted, it’s time to aim your profits. The go-to approach is the measurement technique:
Measure the vertical height at the wedge’s widest point (from the first high down to the first low). Then project that same distance downward from the breakdown point. Bingo—you’ve got a logical profit zone.
As price nears this level, you can close out fully or book partial gains and move your stop to break even. For more ways to guide your entries, see an overview of spread betting for traders.
Here’s how the same rules adapt to different market flows:
Rising Wedge Pattern Trading Scenarios
| Trading Scenario | Market Context | Entry Signal | Stop-Loss Placement | Profit Target |
|---|---|---|---|---|
| Bearish Reversal | After A Prolonged Uptrend | Candle Close Below Support | Above The Last Swing High | Height Of Wedge Projected Downwards |
| Bearish Continuation | During A Larger Downtrend | Candle Close Below Support | Above The Last Swing High | Height Of Wedge Projected Downwards |
By matching your entry, exit, and target to market flow, you remove guesswork and trade with confidence. Stick to this framework, and you’ll navigate the rising wedge pattern with clear rules instead of hope.
Real-World Examples of Rising Wedge Patterns
Theory is great, but seeing a rising wedge play out on a live chart is where the real learning happens. It’s one thing to look at a clean textbook diagram, but it's another to see the pattern unfold in the messy, chaotic reality of the markets.
Let's bridge that gap by dissecting some historical examples. We'll look at what a "perfect" trade looks like and, just as importantly, what happens when the pattern blows up in your face.
A classic, successful rising wedge tells a clear story. First, you see the uptrend. Then, the price starts to grind higher between those two converging trendlines, almost like it's running out of steam. Volume often dries up, which is a massive clue. The climax? A big, decisive breakdown candle that smashes through support, followed by a swift drop as sellers rush in and take control.

A Case Study in a Major Stock
The rising wedge isn't some obscure pattern; it shows up on major stocks all the time. For instance, analysts have pointed out multiple rising wedges forming in large-cap stocks like Abbott Laboratories (ABT), especially during bear markets.
In these cases, the wedge often acted as a continuation signal. The stock was already in a downtrend, would bounce a little (forming the wedge), and then the breakdown would signal the next leg down. In one documented period with ABT, four separate wedges appeared over a few months. The result? Three of these hit their downside price targets after breaking down, showing just how reliable the setup can be. You can find more details on these examples over at Liberated Stock Trader.
This is a critical lesson: a rising wedge doesn't just signal a major top. It can pop up during corrective rallies inside a larger downtrend, telling you the brief bounce is over and the bears are about to take over again.
When the Pattern Fails
Now for the dose of reality. It's equally important to study what a failed rising wedge looks like. Sometimes, a chart will show all the classic signs—the converging lines, the weak volume—but instead of breaking down, the price rips to the upside.
Why? It could be anything. A surprise positive news event, a blowout earnings report, or just a sudden shift in overall market sentiment that completely invalidates the bearish setup.
A failed pattern isn't a flaw in the strategy; it’s a raw reminder that the market does whatever it wants. You might see a breakdown on weak volume, luring you into a short position, only to watch the price violently snap back into the wedge. This is a classic bear trap, and it underscores why risk management is absolutely non-negotiable.
A failed rising wedge serves as the ultimate lesson in humility and risk control. It proves that no pattern is foolproof and reinforces the critical need for a pre-defined stop-loss to protect your capital when the market proves you wrong.
By looking at both the winners and the losers, you start to build a more robust, realistic trading mindset. You learn to trust the high-probability nature of the rising wedge but to always respect its potential to fail. That balanced view is what keeps you in the game for the long haul.
Questions I Get Asked All The Time
Even when you feel like you've got a handle on the rising wedge, there are always a few lingering questions. That's perfectly normal. Getting these details straight is what separates traders who act with confidence from those who hesitate and make costly mistakes.
Let's tackle some of the most common questions I hear from other traders. My goal here is to give you direct, no-fluff answers that you can actually use in your trading.
How Reliable Is the Rising Wedge?
Look, no pattern is a crystal ball, but the rising wedge is one of the more reliable signals out there. When I look at the data, it points to a bearish breakout happening roughly 81% of the time. It’s particularly potent when it shows up after a long, strong bull run, acting as a major reversal signal.
But here’s the catch: success isn't just about spotting two converging lines. You have to see the whole picture. Is the volume drying up on the way up? Does the broader market look tired? These are the clues that add conviction. Failed patterns are part of the game, which is exactly why your risk management has to be locked in tight on every single trade.
Isn't This Just a Symmetrical Triangle?
I can see why people get these two mixed up. Both patterns involve converging trendlines and show a market pausing for a breath. But that's where the similarities end. Their implications are worlds apart.
Think of it this way:
- Rising Wedge: Both the support and resistance lines are pointing up. Crucially, the lower support line is steeper. This structure is a dead giveaway that buyers are running out of steam. It's an inherently bearish pattern screaming "exhaustion."
- Symmetrical Triangle: Here you have one descending trendline and one ascending trendline. The pattern is completely neutral—it's like a coin flip. It tells you the market is undecided, and the real move will be revealed by whichever way it breaks.
The key difference is the built-in bias. A rising wedge is a warning sign. A symmetrical triangle is just a waiting game.
Can a Rising Wedge Ever Signal a Continuation?
Yes, absolutely. While it’s famous for killing uptrends, the rising wedge can also pop up in the middle of a larger downtrend. It’s less common, but you need to be aware of it.
In this scenario, the wedge acts as a weak little counter-trend rally. It’s a feeble bounce where the bulls try to take control but can't sustain any real momentum. When the price inevitably breaks down and falls out of the wedge, it’s a powerful sign that the bounce is over and the primary downtrend is back in charge.
This is a perfect example of why you always have to zoom out and check the bigger picture. The context of the primary trend is everything.
Ready to master price action and trade patterns like the rising wedge with confidence? At Colibri Trader, we provide straightforward, action-based programs to help you profit in any market without relying on confusing indicators. Transform your trading performance with proven techniques and personalized mentorship. Start your journey and unlock your trading potential today.