


Master resistance and support in stocks: A Trader’s Guide
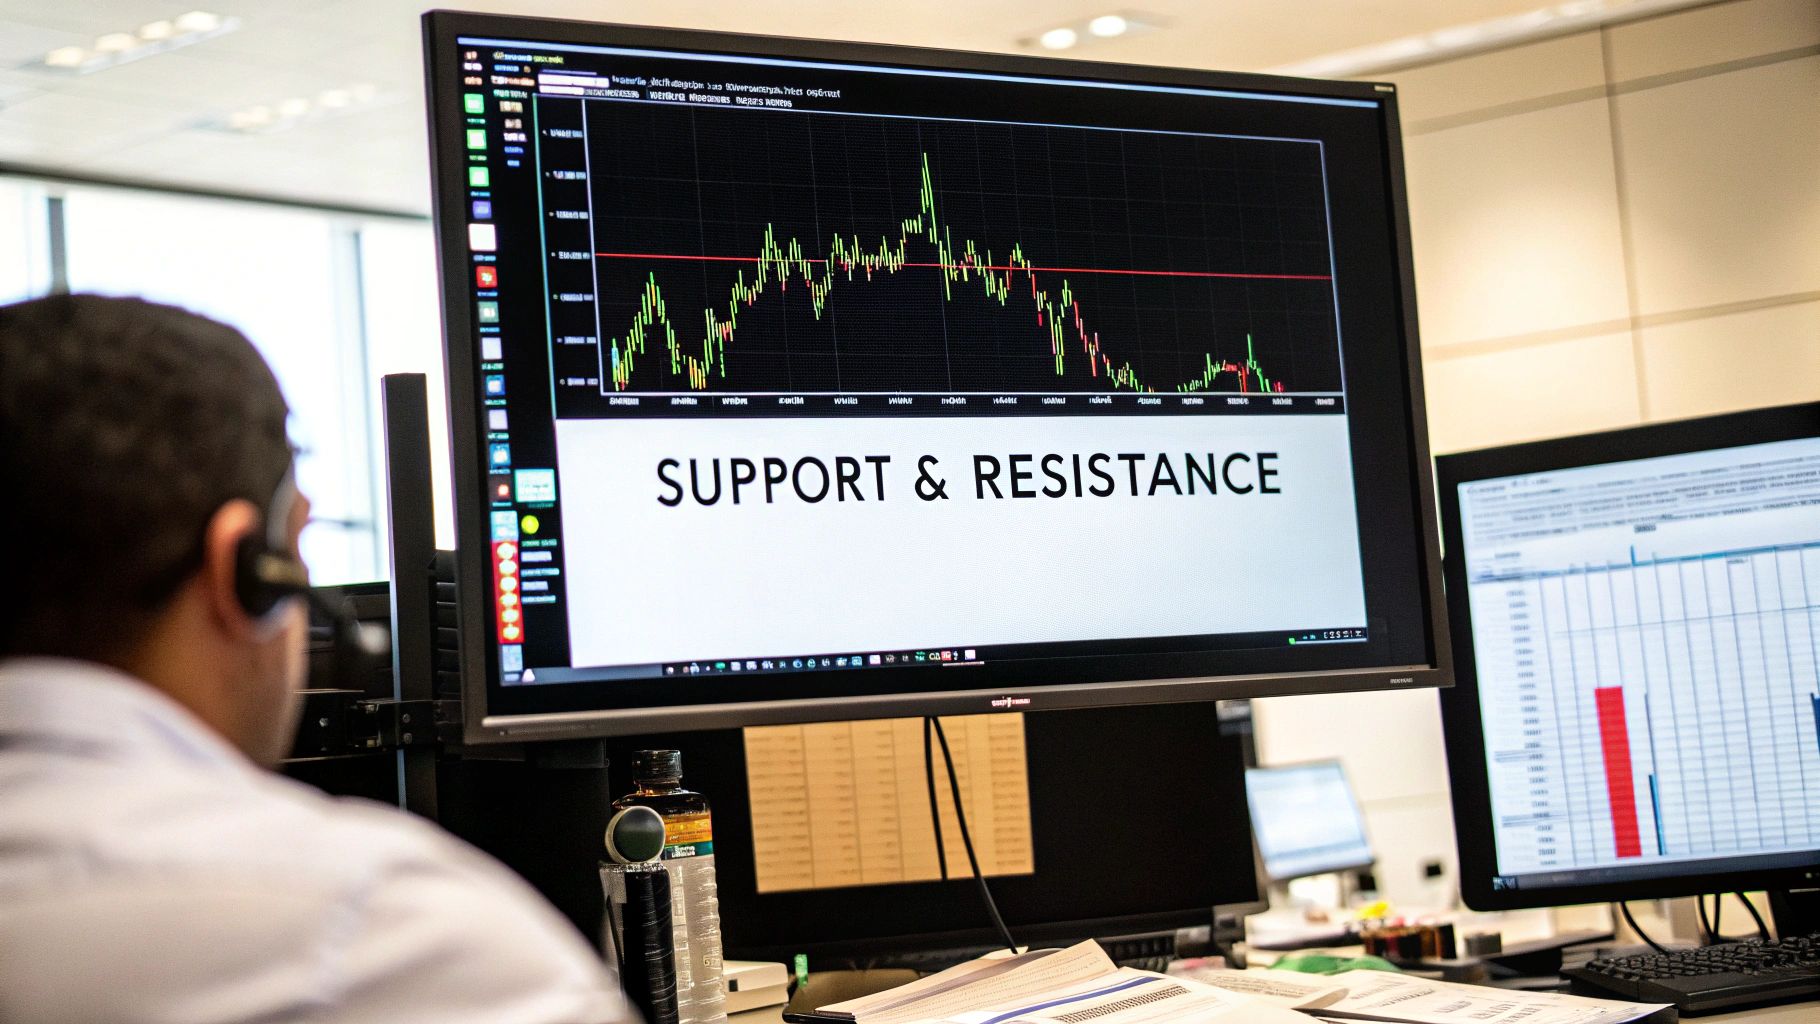
Let's get this out of the way first: you can't learn price-action trading without mastering support and resistance. These aren't just random lines we draw on a chart; they're the battlegrounds where the war between buyers and sellers plays out in real-time.
Think of it like a tennis match. The price is the ball. Support is the floor, the level the price bounces off repeatedly. Resistance is the ceiling, where the price seems to hit an invisible barrier and struggles to push higher. These zones are critical because they show us where market psychology is at a tipping point.
What Are Support and Resistance in Trading
At their core, support and resistance levels are simply areas of concentrated supply and demand. They give us a visual map of the market's collective memory and intentions, revealing where traders are most likely to step in and make a move.
Support is where demand kicks in. When a price drops to a certain level, buyers start seeing it as a bargain. They jump in, creating enough buying pressure to halt the decline and often push the price back up. It’s the market collectively saying, "Nope, it's not going any lower than this."
On the flip side, resistance is where supply takes over. As the price climbs, traders who bought lower begin to cash out and take profits. At the same time, others see the price as too high and start selling. This flood of selling pressure creates a ceiling that the price struggles to break through.
Before we dig deeper, let's quickly summarize these two foundational concepts. Understanding the difference is crucial for everything that follows.
Key Concepts at a Glance
| Concept | What It Represents | Typical Market Action |
|---|---|---|
| Support | An area of high demand or buying interest. | Price tends to bounce up from this level. |
| Resistance | An area of high supply or selling interest. | Price tends to turn down from this level. |
This table boils it down, but the real skill comes from seeing these zones as dynamic areas, not just static lines.
The Foundation of Market Analysis
So, why does any of this matter? Because these levels give you a framework for making smart, calculated trading decisions instead of just guessing. Once you get good at spotting these zones, you can start anticipating the market's next move.
Knowing where support and resistance are helps you:
- Find better entry points: Buying near a solid support level gives your trade a much higher probability of working out.
- Set smarter stop-losses: Placing a stop-loss just below a key support level (for a buy trade) is a logical way to manage your risk if the level breaks.
- Identify logical profit targets: Selling or taking profit as the price approaches a major resistance level is a great way to lock in your gains.
In essence, support and resistance levels are the footprints left by the market. They show us where the big players have made their stand before, and where they're likely to do it again. If you're serious about trading, learning to read these footprints is non-negotiable.
How To Find Support And Resistance On A Stock Chart
Spotting support and resistance isn’t about hitting a single price. Think of these as zones where trader sentiment tends to flip. Your goal is to visually connect areas on the chart where price has bounced or stalled.
Begin by sketching horizontal lines at key swing points. Identify at least two swing lows near the same price to mark a potential support zone. Likewise, link two swing highs to outline a resistance area. The more times price tests and reverses at these levels, the stronger they become.
Identifying Static And Dynamic Levels
Static zones (horizontal lines) are straightforward to draw. But in trending markets, these levels tilt and shift. Here’s how to spot both:
- Uptrend Support: Draw an upward-sloping line through successive higher lows. This trendline acts like a moving floor where buyers step in.
- Downtrend Resistance: Connect lower highs with a downward-sloping line. It becomes a moving ceiling, showing where sellers regain control.
| Type Of Level | How To Draw | What It Indicates |
|---|---|---|
| Static Support | Horizontal line across swing lows | Buyers defended the zone |
| Static Resistance | Horizontal line across swing highs | Sellers pushed price lower |
| Dynamic Support | Upward trendline connecting higher lows | Ongoing bullish pressure |
| Dynamic Resistance | Downward trendline connecting lower highs | Ongoing bearish pressure |
For a step-by-step guide on trendlines, check out our guide on how to draw trend lines.
“Think of these levels as battlefronts. A price repeatedly testing support without breaking it shows buyers defending their ground. Each defense makes the zone tougher to crack.”
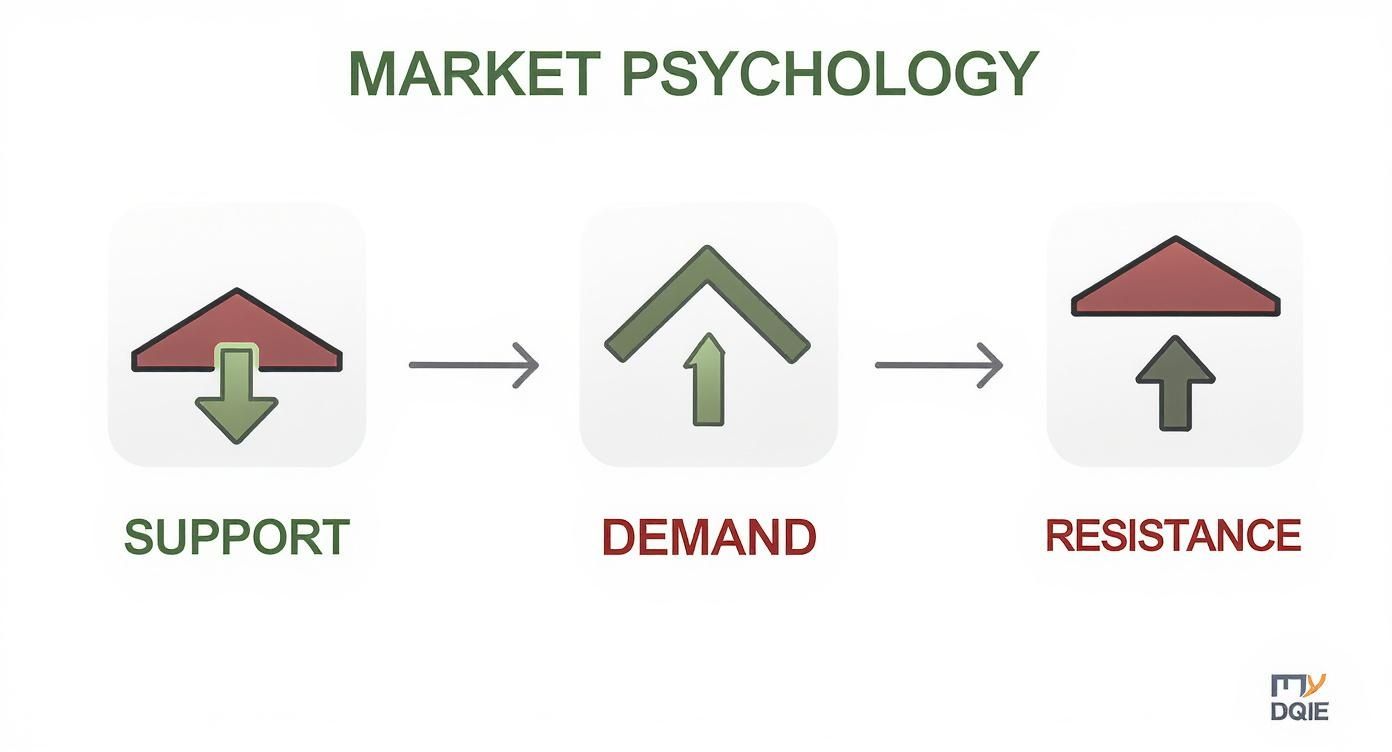
This infographic lays out how demand creates a floor and supply creates a ceiling, framing the trading range.
Validating The Strength Of A Zone
Not every zone holds equal weight. Here are two powerful ways to measure a level’s credibility:
- Bounce Count: Levels tested 3–6 times tend to be rock-solid. More tests mean more market participants recognize that zone.
- Moving Averages: The 50-day and 200-day moving averages often act as dynamic support or resistance. In an uptrend, price will dip to a moving average and bounce. In a downtrend, those same averages form a ceiling.
| Moving Average | Role In Uptrend | Role In Downtrend |
|---|---|---|
| 50-Day | Short-term dynamic floor | Short-term ceiling |
| 200-Day | Long-term dynamic floor | Long-term ceiling |
By blending horizontal lines, trendlines, and key moving averages, you’ll map out the market’s decision points with confidence.
The Psychology Driving Price Levels

Support and resistance levels are far more than just lines on a chart. Think of them as the visible footprints of human emotion—a battleground of fear, greed, and regret playing out in real-time. To really get a handle on resistance and support in stocks, you have to look past the lines and see the people behind them.
Picture a stock that's been on a nice run, hits a peak, and then starts to fall. That high point is now burned into the memory of everyone watching. Traders who bought near the top are now kicking themselves. It's a classic case of buyer's remorse. All they want is to get their money back, so they put their sell orders right where they bought in, creating a wall of supply. That’s your resistance.
Now, let's flip it. A support level is born from a different kind of regret. It’s for the traders who watched the price go up without them and thought, "I should have bought." When the price drops back to a previous low, they see their second chance. That fear of missing out (FOMO) mixed with a bit of bargain-hunting creates a wave of buying pressure, stopping the price from falling any further.
The Emotional Tug Of War
At these critical price zones, it all boils down to a tug-of-war between two powerful emotions. This very conflict is what creates the bounces and rejections that traders learn to anticipate.
- Greed: This is the fuel that pushes prices up to resistance. Buyers are chasing the momentum, hoping for a bigger payday.
- Fear: This is what slams the brakes on at resistance, as sellers rush to lock in profits before a potential drop. Fear also shows up at support, but this time it’s the fear of missing out on a great entry point.
These price levels hold because traders remember them. The market's collective memory of past turning points creates a self-fulfilling prophecy, as participants expect the same behavior to repeat.
This memory is the secret sauce. It’s what makes these zones feel so predictable. When a price nears a known support level, buyers get ready to pounce. When it approaches resistance, sellers get their orders ready. This shared expectation is what gives the level its strength.
How A Ceiling Becomes A Floor
One of the most powerful concepts in all of price action trading is role reversal. This is what happens when price finally, decisively smashes through a strong resistance level. The whole psychology of the market shifts in an instant.
What was once a ceiling now becomes a new floor.
Here’s a breakdown of the emotional shift that takes place:
- Regretful Sellers: Traders who sold at the old resistance level are now watching the price climb without them. They're regretting their decision and just hoping for a small dip to get back in. Where do they place their buy orders? Right at that old resistance level.
- Breakout Buyers: New traders who were waiting on the sidelines see the breakout as confirmation. For them, that old resistance level is now the most logical place to enter. They add their buy orders to the pile, reinforcing the new support.
This transformation of resistance into support (and vice versa) is a huge deal. It’s a clear signal that the balance of power has shifted from sellers to buyers, often kicking off a powerful new trend. Understanding this psychological flip is absolutely essential for spotting high-probability trades.
Advanced Tools to Confirm Your Analysis
While drawing a few lines on a chart is a fantastic starting point, seasoned traders rarely stop there. They pull out some extra tools from their toolkit to double-check their work. Think of it as getting a second opinion before making a big decision.
These advanced methods help you figure out if a potential support or resistance zone is the real deal or just random market noise. Two of the most powerful tools for this job are Fibonacci retracement and the Volume Profile. They take you beyond just looking at simple price action and give you a much deeper view of the market's underlying structure.
Using Fibonacci Retracement Levels
You might have heard about the Fibonacci sequence in nature or mathematics, but it shows up constantly in the financial markets, too. The Fibonacci retracement tool uses key ratios from this sequence to predict where a price might pull back or hit a wall during a trend.
Markets almost never move in a straight line. After a big surge up or down, the price will often "retrace" part of that move before carrying on. This tool is brilliant for anticipating where those bounces or drops are most likely to happen. The levels I always keep a close eye on are:
- 38.2%: This is often the first stop in a shallow pullback.
- 50.0%: It's not an official Fibonacci ratio, but it’s a huge psychological level where trades often cluster.
- 61.8%: This is the famous "golden ratio," and it frequently acts as a major turning point.
The real magic happens when these Fibonacci levels line up perfectly with a support or resistance zone you've already identified. This "confluence" of signals dramatically boosts the odds that the price will react at that level. To really get the hang of this, you should check out our detailed guide on how to draw Fibonacci retracements.
And this isn’t just theory. Research combining Fibonacci with neural networks found that around 85-90% of price reversals happen at or very close to these key levels. This confirms there’s a real statistical edge for traders who know how to use them. You can dig into these findings over on thescipub.com.
Analyzing Trading Volume With Volume Profile
Another fantastic confirmation tool is the Volume Profile. Don't confuse this with the standard volume indicator you see at the bottom of your chart. This one plots trading volume horizontally, right on the price scale. It shows you exactly which price levels attracted the most trading activity.
The single price level with the most volume is called the Point of Control (POC). It acts like a magnet for price and often serves as an incredibly strong area of support or resistance.
- High-Volume Nodes (HVNs): These are price zones with a ton of trading activity. They show where the market found "fair value," and these areas often become powerful support or resistance later on.
- Low-Volume Nodes (LVNs): These are the opposite—price zones with very little trading history. Price tends to slice through these areas quickly, almost like it's trying to get to the next HVN.
When you add Volume Profile to your analysis of resistance and support in stocks, you start to see the why behind the levels. A support zone you've drawn becomes a whole lot more convincing when you can see it's backed by a massive wall of historical trading volume. It's proof that the big players have drawn their line in the sand right there.
Practical Trading Strategies for Every Scenario
Spotting resistance and support in stocks is one thing, but actually knowing how to trade off these levels is where the rubber meets the road. Once you get good at mapping out these zones, you can build some very clear, rules-based strategies that work in different market conditions.
Let’s dive into two of the most popular ways traders play these critical price levels.
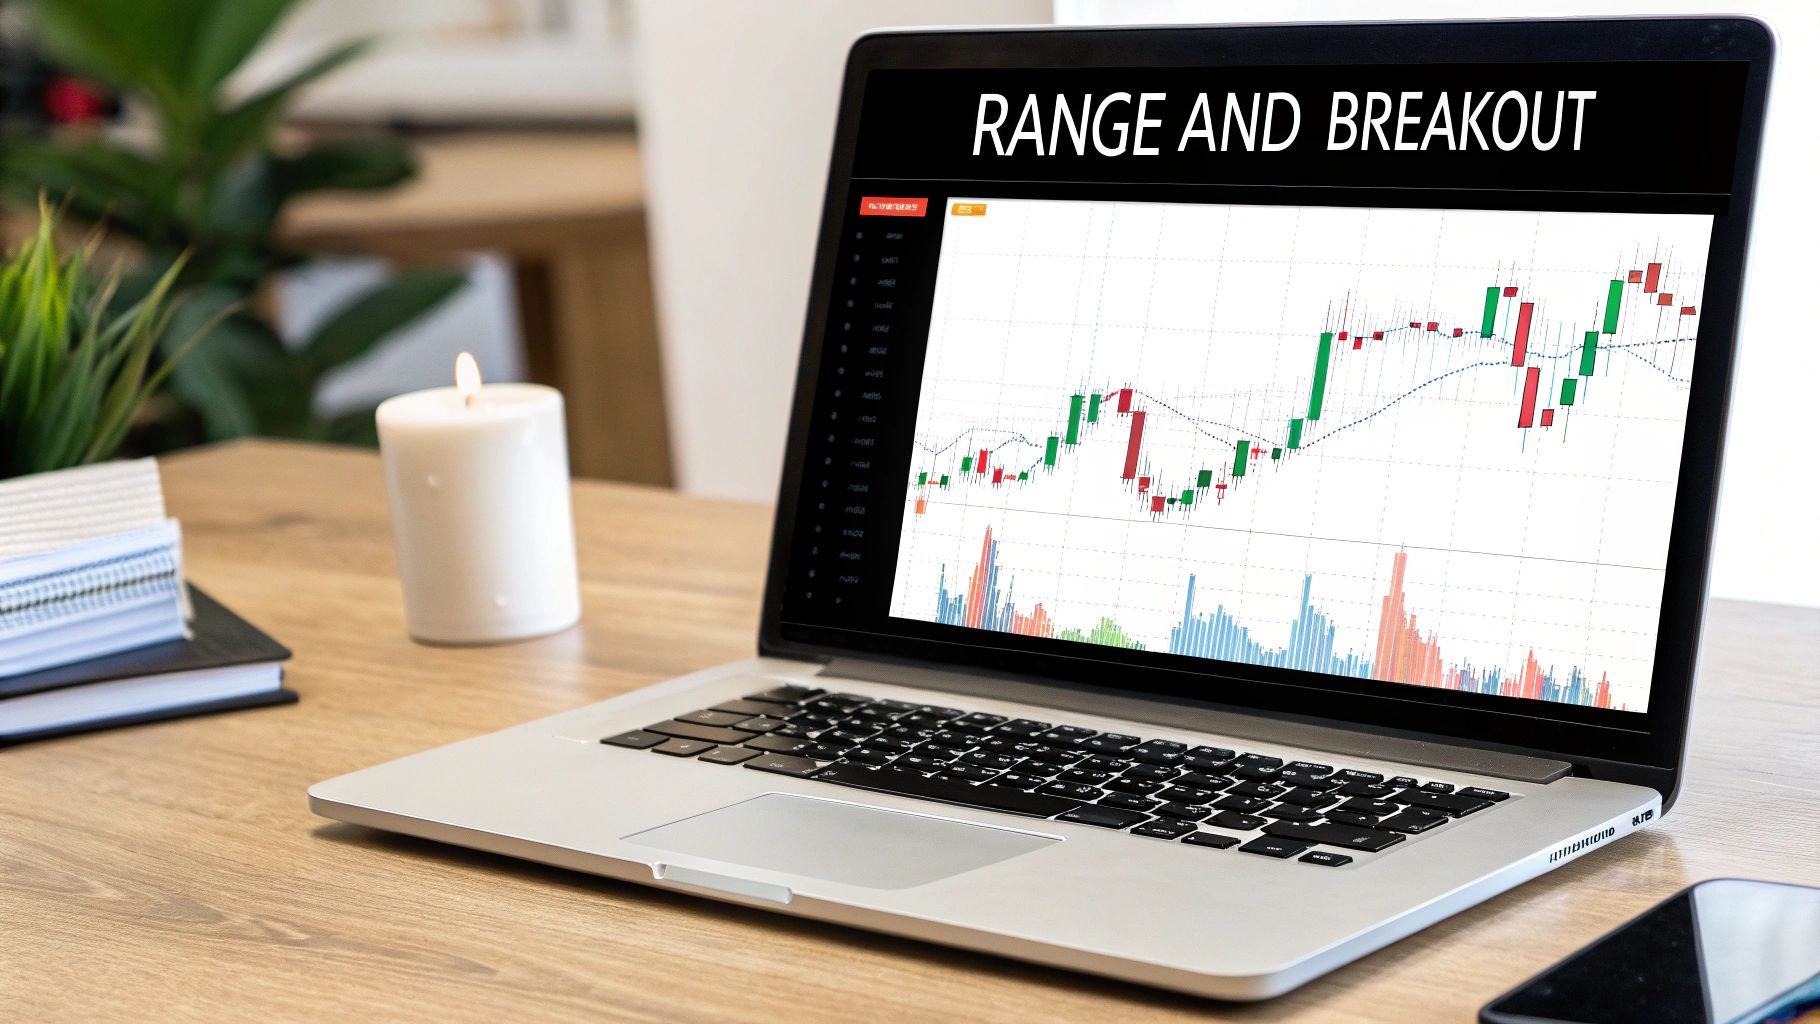
The first, and probably the most common, is range trading. This is your go-to strategy when a stock is just chopping sideways, bouncing predictably between a solid support floor and a resistance ceiling.
Think of it like a game of ping-pong. You know exactly where the ball is likely to reverse. Your job is to buy near the bottom and sell near the top of that channel. Simple, right? This approach loves stability and hates surprises.
Executing The Range Trading Strategy
To pull off a range trade, you need patience. You absolutely have to wait for the price to come to you. Acting in the middle of the channel is a recipe for getting chopped up.
Here’s a basic framework for how it works:
- Entry Signal: Wait for the price to hit the support zone. You want to see some sign that buyers are stepping in, maybe a bullish candlestick pattern. This is your confirmation.
- Stop-Loss Placement: Your stop-loss goes just below that support level. If the price breaks that floor, the trade idea is dead, and you get out with a small, manageable loss.
- Profit Target: The obvious place to take profits is just below the resistance level at the top of the range. You want to be out of the trade before the sellers show up again.
This strategy is incredibly effective in markets that aren't trending, but it demands the discipline to sit on your hands and wait for the perfect setup.
Mastering The Breakout Trading Strategy
While range trading is all about predictability, breakout trading is about capturing the explosion that happens when that predictability ends. This is the strategy you use when the price finally smashes through a long-held support or resistance level.
A breakout above resistance signals that buyers are in complete control and a new uptrend could be starting. A break below support means the sellers have won the battle.
The absolute key to breakout trading is confirmation. A price just poking its head above resistance isn’t good enough. You need proof that the move has real power, and your best friend here is trading volume. A real breakout should always, always be on a big spike in volume.
A price move without volume is like a car engine revving without moving the wheels—it's just noise. But a breakout on high volume? That shows conviction. It shows the big players are involved, giving the move a much better chance of actually going somewhere.
The biggest nightmare for a breakout trader is the "fake-out"—where the price breaks a level, sucks you in, and then immediately reverses. This is precisely why waiting for confirmation is non-negotiable. For a much deeper look at this, you might find our guide on how to trade breakouts really helpful.
Here are the must-follow rules for a breakout trade:
- Entry Signal: Only enter after the price has closed decisively above resistance (or below support) and on high volume. Some traders even wait for a "retest," where price pulls back to the level it just broke and confirms it as new support.
- Stop-Loss Placement: For a bullish breakout, your stop-loss should be placed just below the old resistance level, which should now act as a new floor.
- Profit Target: A common way to set a target is to measure the height of the previous trading range and project that distance up from the breakout point.
Common Mistakes Traders Make (And How to Avoid Them)
Nailing down your support and resistance levels is a massive step forward. But here’s the frustrating part: a ton of traders still lose money by falling into a few predictable traps.
Knowing what these traps are is just as important as knowing the strategies themselves. Steering clear of them can be the difference between spinning your wheels and finding real consistency.
Mistake 1: Treating Levels Like Laser Beams
One of the biggest blunders I see is treating support and resistance as razor-thin, exact price lines. They're not.
Think of them as zones or areas of interest, not a brick wall at a precise number.
The market is a messy battlefield of human emotions, not some perfect mathematical formula. A price will often dip slightly below a support level or poke a bit above resistance before reversing. This doesn't mean the zone is broken.
If you insist on an exact price, you’ll get burned. You'll either set your stop-loss too tight and get knocked out by meaningless noise, or you'll miss a fantastic entry because the price turned around just a few cents from your "perfect" line. Give your zones some breathing room.
Mistake 2: Acting Without Confirmation
Another costly habit is jumping into a trade the second the price touches a level. Patience, my friend, is a trader's superpower.
A price hitting a support zone isn't a buy signal. It's a signal to pay attention. You have to wait for confirmation that the level is actually going to hold.
So, what does confirmation look like?
- At support: Look for bullish candlestick patterns like a hammer or a bullish engulfing candle. These show that buyers are stepping in and fighting back.
- At resistance: A shooting star or a bearish engulfing pattern is your cue that sellers are taking control and pushing back.
Entering a trade without this proof is pure gambling. It's like jumping off a cliff and hoping someone will catch you. Wait for the market to show you its hand before you put your capital on the line.
Mistake 3: Ignoring Trading Volume
You can have the most beautiful chart setup in the world, but if there's no volume behind it, it’s often just noise. Too many traders get so fixated on price they completely ignore the volume bars at the bottom of their screen.
This is a critical mistake, especially with breakouts.
A price breaking through a key resistance level on weak or dying volume is a massive red flag. It screams that there's very little conviction behind the move. This is how you get caught in a "fake-out"—a nasty reversal that traps all the eager traders.
On the flip side, a breakout that happens on a huge spike in volume tells you the big players are involved. That signals strong participation and a much higher chance that the move will continue.
Mistake 4: Overcomplicating The Chart
Finally, we have the trap of "analysis paralysis." This happens when traders plaster their charts with dozens of indicators—multiple moving averages, RSI, MACD, Bollinger Bands, you name it.
While each tool might have its place, piling them all on at once creates a confusing mess of conflicting signals.
Good analysis of resistance and support in stocks comes from clarity. Start with a clean chart. Mark your key price zones. Then, maybe—maybe—add one or two complementary indicators if you need extra confirmation. A simple, clean approach almost always wins against a cluttered, complicated one.
Your goal is to make confident decisions, not to drown in a sea of data.
At Colibri Trader, we teach a price-action based approach that keeps your charts clean and your decisions clear. If you're tired of indicator overload and want to learn a proven method for profiting in any market, explore our trading programs and unlock your true potential at https://www.colibritrader.com.