


A Trader’s Guide to Resistance and Support
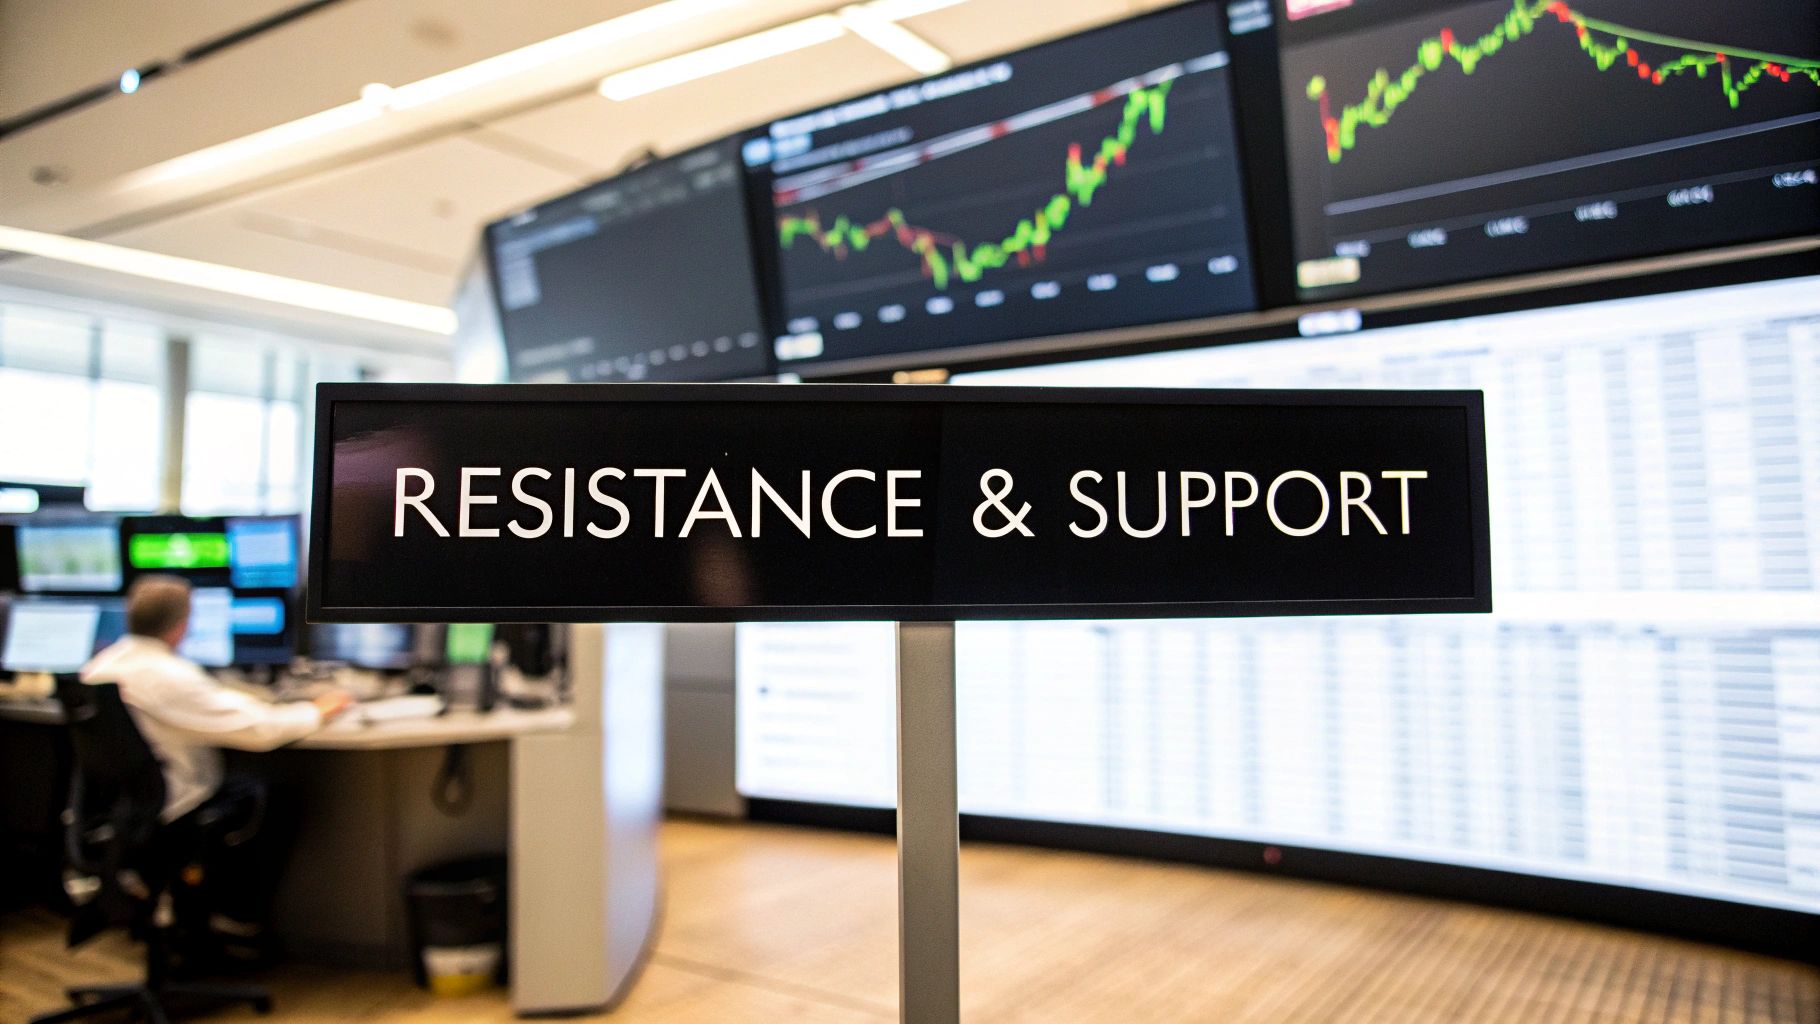
When you hear traders talk about support and resistance, they're pointing out key price levels on a chart where the balance of power between buyers and sellers is so strong it can actually pause or even reverse a trend.
Think of support as a price floor that an asset just can't seem to break below. On the flip side, resistance acts like a price ceiling that it struggles to punch through. Getting a handle on these concepts is the first real step to understanding market psychology just by looking at a price chart.
Understanding Resistance and Support Without Indicators
If you tossed a tennis ball in a room, the floor it keeps bouncing off of is your support. The ceiling it hits before falling back down? That's resistance. In trading, these aren't physical walls, but psychological barriers built from the collective actions and emotions of millions of traders.
These levels aren't magic. They are the visible footprints left by raw market psychology—specifically, fear and greed.
When price pushes up towards a previous high (resistance), two things happen. Traders who bought low start cashing in their profits, which creates selling pressure. At the same time, traders who missed the boat see a second chance to sell high, adding even more weight. This combined selling can grind an uptrend to a halt.
The opposite happens when price drops to a previous low (support). Traders now see a bargain. Buyers who sat on the sidelines jump in, while short-sellers take profits by buying back their positions. This flood of demand can stop a downtrend in its tracks, forming a solid floor under the price.
Why Zones Matter More Than Lines
One of the first things you learn trading live markets is that support and resistance are almost never a single, precise price. It's much more useful to think of them as zones or broad areas on the chart. A stock might find support around $50, but in reality, it could bounce anywhere from $49.80 to $50.25. Trying to force a perfect, single line on your chart is a classic rookie mistake that only leads to frustration.
Think of it like the tide hitting a beach. The waterline is never a perfectly straight, clean line. It ebbs and flows, creating a whole zone where the water meets the sand. Support and resistance zones are just like that—they reflect the messy, human, and imperfect nature of the markets.
The Foundation of Clean Chart Trading
Really grasping this idea is non-negotiable if you want to trade with pure price action. It frees you up to read what the market is actually doing without plastering your screen with a bunch of lagging indicators.
When you learn to see the chart as a story of supply and demand battles fought at key levels, you're building a powerful skill that can adapt to any market condition. This approach is the bedrock of many powerful strategies, something we explore further in our guide on trading without indicators. Understanding the 'why' behind these price barriers is what sets you up to read the market with clarity and confidence.
How to Identify Key Price Action Zones
Moving from theory to practice is where a trader's real education begins. Finding powerful resistance and support zones isn’t about cluttering your charts with complex tools; it’s about training your eye to see the market's memory.
We're going to walk through three battle-tested methods that rely on nothing but a clean price chart. These techniques help you spot the exact historical levels where market sentiment flipped, giving you a roadmap of potential future turning points. Each one reveals a different layer of market psychology, from sharp, violent reversals to long, drawn-out periods of indecision.
The flow chart below perfectly illustrates the psychological battle that forms these levels—the constant tug-of-war between buying greed and selling fear at key resistance points.

This simple model shows how bullish enthusiasm (greed) eventually smacks into a price ceiling (resistance), which then triggers a reversal driven by profit-taking and a sudden wave of fear.
Pinpoint Historical Swing Highs and Lows
The most direct way to find resistance and support is to simply look left on your chart. Find the significant peaks (swing highs) and troughs (swing lows) where the price reversed direction with real force. These are the spots where a clear winner emerged in the battle between buyers and sellers.
A swing high marks a point where selling pressure completely overwhelmed buying pressure, creating a natural ceiling. On the flip side, a swing low shows where buyers stepped in with enough conviction to stop a downtrend cold, establishing a solid floor. The more dramatic the reversal at these points, the stronger that level is likely to be when the price comes back to test it.
Think of these swing points as historical battlegrounds. When the price returns to these areas, traders remember what happened last time, and many will be ready to defend those same levels, reinforcing their strength.
For example, historical data often shows institutional memory at play. One analysis found that in a third-year bull market, 73% of S&P rallies paused at prior all-time highs acting as resistance, while key moving averages provided support on 62% of dips. This just goes to show how past price action creates future probabilities that we, as traders, can act on.
Look for Areas of Consolidation
Price doesn't always move in clean, sharp V-shapes. More often than not, it will go sideways for a while, trapped between an upper and lower boundary. This period of market indecision is called consolidation, or a trading range.
The top of this range acts as heavy resistance, and the bottom acts as strong support. Why? Because a massive volume of shares or contracts was traded within that tight zone. This high-volume activity creates a powerful "price memory" that makes these levels incredibly difficult to break.
- Upper Boundary (Resistance): This is where sellers have consistently shown up to kill any rally, absorbing every last bit of buying interest.
- Lower Boundary (Support): This is where buyers have repeatedly defended the price, soaking up all the selling pressure and preventing further declines.
When the price finally breaks out of a consolidation zone, the move is often explosive. It signals a clear resolution to that long, frustrating period of indecision.
Identify Psychological Round Numbers
Markets are driven by people, and people are psychologically drawn to nice, round numbers. Prices like $50, $100, or 1.2000 in Forex often act as informal, unwritten levels of resistance and support.
This happens for a few reasons. A lot of retail traders place their profit targets or stop-loss orders right on these neat figures. On top of that, large institutional orders are often parked at or around these key psychological levels, which adds to their significance.
While they aren't as precise as swing points or consolidation zones, you should always be aware of how the price behaves when it approaches a major round number. These levels can offer powerful confirmation when they line up with other technical signals, like those you'd get from Fibonacci retracements. If you want to learn more about that, check out our guide on how to draw Fibonacci retracements. These numbers act like magnets for both price and attention, making them critical levels to watch.
The Power of Role Reversal
In trading, support and resistance levels aren't concrete walls. Think of them more like dynamic zones where the market's entire psychology can flip on a dime. When a solid price floor (support) finally gives way, it doesn't just vanish—it often transforms into a new ceiling (resistance).
This powerful switch is what traders call role reversal, and it's a game-changing concept for reading the charts. The same thing happens in reverse: when price smashes through a heavy resistance level, that old ceiling can become a surprisingly reliable new floor for future bounces. Grasping this concept gives you a massive edge in adapting as the market story unfolds.
The Psychology Behind the Flip
So, what's really going on here? It all boils down to trapped traders and shifting sentiment.
Imagine a strong support level at $100. A ton of traders piled in, buying at this price and expecting a nice bounce. But then, the unexpected happens: price crashes right through $100 and plummets to $95. All those buyers are now sitting on a losing trade. Their mindset instantly flips from hope to regret.
What do you think they're thinking now? Most are just praying for a chance to get out at breakeven. If the price manages to rally back to $100, this army of trapped buyers suddenly becomes a wave of desperate sellers. They can't wait to dump their positions to avoid a bigger loss. This flood of sell orders at the old support level creates fresh resistance, stopping the rally in its tracks.
A broken support level is filled with the regret of buyers who wish they could get their money back. When given the chance, their collective selling pressure turns that old floor into a new ceiling. This is the essence of market memory in action.
Identifying Role Reversal Setups
Spotting these flips on your chart is how you find high-probability entries that most people completely miss. The secret is to look for a clean, decisive break followed by a retest of that same level.
Here’s the typical sequence for a classic support-turned-resistance setup:
- Established Support: Price clearly bounces off a support zone multiple times.
- The Break: Price closes decisively below the support zone. Sellers have won the battle.
- The Retest: Price rallies back up to touch the underside of the now-broken support zone.
- Confirmation: Sellers jump back in, pushing the price down from this new resistance and confirming the role reversal.
That retest is your prime entry point for a short trade. You can place your stop-loss just above the new resistance zone, giving you a well-defined, low-risk setup.
Looking back at historical charts confirms just how powerful these flipped levels are. During the choppy markets of 2018-2019, a staggering 67% of major forex pairs respected horizontal resistance that formed from key prior support levels. Around the same time, oil repeatedly found support at $70/barrel—a former resistance area—holding firm in 80% of tests as market dynamics changed. If you want to dig deeper into how these levels form, you can explore the inflection points defining the market.
Building Trading Setups Around Key Levels

Spotting key levels is just the first half of the battle. The real test of a trader's discipline is turning that knowledge into a structured, repeatable plan for what to do when price actually gets there.
Every single trade you take needs three non-negotiable parts: a clear entry trigger, a pre-defined stop-loss, and a logical profit target. Without these, you aren't trading a plan—you're just gambling on where the price might go next.
When it comes to trading around these levels, there are really only two games you can play: you can trade the rejection (the bounce) or you can trade the violation (the break). Each approach has its own rhythm and requires a totally different mindset to execute properly.
Trading the Bounce from a Level
The "bounce" strategy is all about betting that an established support or resistance level is going to do its job and send the price back the other way. This is a classic counter-trend or range-trading play that demands patience and a sharp eye for confirmation.
The idea couldn't be simpler: you wait for price to hit a major zone and then show you it's running out of steam. Just blindly placing an order the second price touches your line is a recipe for getting run over. Pros wait for the market to prove the level is holding before they put any capital at risk.
A key level of support or resistance is like a line in the sand. Don't assume the market will respect it. Wait for it to build a defensive wall, then join the side that's winning the battle.
So what does that confirmation actually look like on a chart? It's any price action that shows buyers (at support) or sellers (at resistance) are stepping in with some serious muscle.
- Candlestick Patterns: Look for classic reversal patterns. Think pin bars with long wicks stabbing through the level and getting rejected, big engulfing candles that erase the previous move, or dojis showing indecision before a strong push away from the zone.
- Failed Attempts: On a lower timeframe, watch for price to poke at the level two or three times and fail each time. This is a classic sign of exhaustion.
- Volume Clues: A sudden spike in trading volume right as price hits the level and reverses can be a massive tell. It often means the big institutional players are stepping in to defend their positions.
Example Setup for a Support Bounce:
- Entry Trigger: Price drops into a key support zone. A bullish pin bar forms on the 4-hour chart, with the candle closing back above the zone. You go long on the open of the very next candle.
- Stop-Loss: Tuck your stop-loss just a few pips below the lowest point of that pin bar's wick. This clearly defines your risk if the level crumbles.
- Profit Target: Your first take-profit should be the next significant resistance level you can find. This ensures you're aiming for a realistic move with a solid risk-to-reward ratio.
Trading the Breakout and Retest
The "break" strategy is a momentum game. You're betting that once a major support or resistance level gives way, the price is going to keep running in that direction. But trading breakouts is notoriously tricky because of one thing: false breakouts, or "fakeouts."
A fakeout is when price pushes just past a level, sucking in all the eager breakout traders, only to snap back violently into the old range. It's a classic trap. This is exactly why the sharpest traders rarely jump on the initial break. They wait for a much safer, higher-probability signal: the retest.
After a powerful breakout, price often pulls back to "retest" the very level it just smashed through. That's the old support-becomes-resistance principle in action, and it gives you a much more reliable place to get in.
Step-by-Step Breakout and Retest Plan:
- Wait for a Decisive Close: The initial break needs to be convincing. You want to see a full candle body close firmly beyond the zone, not just a little wick poking through.
- Patiently Await the Retest: This is key. Don't chase the move. Let the market come back to you. Price should drift back to the broken level, which should now act as a floor (new support) or ceiling (new resistance).
- Enter on Confirmation: As price touches that newly flipped level, look for signs of a bounce. A small bullish candle forming right on top of old resistance (now new support) is a textbook entry signal to go long.
- Set Your Parameters: Place your stop-loss on the other side of the broken level. Your profit target can be the next major price structure or a measured move based on the size of the previous range.
By waiting for that retest, you're getting confirmation that the market has accepted the new price. You're entering with the new momentum on your side, which filters out most of those nasty fakeouts and protects your capital from getting chewed up.
Advanced Strategies With Supply, Demand, and Confluence

Drawing simple lines for support and resistance is a fundamental skill, but to really elevate your trading, you need to think like the pros. This means seeing the market through the lens of supply and demand zones.
These aren't just single price points where the market has turned before. They are broader areas on the chart where huge institutional orders have piled up, creating major price imbalances.
Think of a supply zone as a ceiling packed with unfilled sell orders from the big players. When the price drifts back up to that area, those orders get triggered, unleashing a wave of selling pressure that shoves the price back down. On the flip side, a demand zone is a floor stacked with unfilled buy orders, creating a powerful bounce pad for the price. If you want to really sharpen your edge, you need to start mastering supply and demand zones for trading.
This simple shift from lines to zones gives your analysis a crucial third dimension. It helps you understand why a level holds or breaks.
The Trader's Secret Weapon: Confluence
Now, let's talk about a concept that can seriously boost the probability of your trades: confluence. It’s the trading equivalent of having three or four different experts all look at a problem and come to the exact same conclusion.
In trading, confluence happens when multiple, independent technical signals all point to the same outcome in a specific price area.
Imagine a horizontal resistance level that has capped the price for weeks. That's one reason to be cautious. But what if a major downward trendline, a key Fibonacci retracement level, and the 200-day moving average all converge at that exact same spot? That’s a confluence event, and it’s a game-changer.
A single reason to take a trade is just an idea. Three or four independent reasons lining up at the same spot create a high-probability setup. Confluence is how traders stack the odds in their favor by finding these powerful intersections.
This layering of evidence transforms a simple support or resistance level into a supercharged, high-conviction trading zone.
Breaking Down a High-Probability Confluence Setup
Let's walk through a real-world example to see this in action. Say a stock is in a solid uptrend and starts to pull back. You're hunting for a strong support area to jump in on a long trade.
As you scan the chart, you notice a cluster of signals forming around the $150 price level:
- Signal 1: Horizontal Support: The price has bounced hard off the $150 area twice in the last three months.
- Signal 2: Trendline Support: A rising trendline that has defined the uptrend is also intersecting right at $150.
- Signal 3: Fibonacci Retracement: The pullback from the recent high is a perfect 50% Fibonacci retracement, which also lands right at $150.
- Signal 4: Psychological Number: $150 is a big round number, adding another psychological layer of potential support where traders might place orders.
This powerful stack of signals makes the $150 zone a far more reliable place to look for an entry than any single one of those signals would be on its own. Each element confirms the others, building a rock-solid case for a trade.
Data often backs this up. In strong bull markets, 70% of major psychological levels (like round numbers) have historically caused at least a 5% correction before a potential breakout. This shows how a single factor can carry serious weight—weight that only gets amplified when combined with other signals through confluence.
Beyond just finding key levels, many traders layer in different approaches entirely. Exploring proven momentum trading strategies can give you more frameworks for building setups and understanding market dynamics. Ultimately, by combining supply, demand, and confluence, you move beyond simple line-drawing and start trading like a professional analyst, pinpointing the zones where market forces are most likely to collide.
Common Mistakes to Avoid When Trading These Levels
Knowing how to draw support and resistance is one thing. Actually trading them for profit is a whole different ball game. So many traders nail the theory but then make the same unforced errors over and over again, bleeding their accounts dry.
Usually, it comes down to impatience, a lack of discipline, or just misreading what the chart is telling you. Let's walk through the most costly mistakes I see traders make, because avoiding these traps is what separates the consistently profitable from the consistently frustrated.
Treating Levels as Exact Lines
This one is probably the most common mistake out there. A trader sees resistance, draws a razor-thin line, and places their stop-loss just a single tick above it. What happens next is painfully predictable: price wicks just past their line, takes out their stop, and then reverses perfectly without them. Sound familiar?
That’s because price action isn't that precise. Big institutional orders and market volatility create broad zones, not surgical lines.
The fix? Stop thinking in lines and start thinking in zones. When you spot a key level, draw a box or a shaded area around it. This gives your trade the breathing room it needs to absorb a little volatility without kicking you out of a perfectly good setup.
Ignoring the Broader Market Context
You find a picture-perfect short setup at a key resistance level. Looks great, right? Well, not if the broader market is in a screaming, face-ripping uptrend. Fighting a dominant trend is one of the fastest ways to get run over. A minor resistance level isn’t going to stop a freight train.
To avoid this, you always have to zoom out first.
- Check the main trend: What's the daily or weekly chart telling you? Is it clearly bullish or bearish?
- Fish in the right pond: If the market is in a powerful uptrend, your focus should be on buying dips to support, not trying to short every little pop into resistance.
- Filter out the junk: Just by ignoring the setups that fight the primary trend, you will dramatically tilt the odds in your favor.
A rising tide lifts all boats, and a falling tide sinks them. Fighting the market's primary current is a low-probability bet, no matter how good your individual setup looks. Always trade with the flow, not against it.
When you have the market’s underlying momentum on your side, everything becomes easier. You’re no longer swimming against the current; you’re riding the wave.
Frequently Asked Questions
Even after you get the hang of the core ideas, a few questions always pop up when traders start using support and resistance in the live market. Let's tackle the most common ones head-on to clear things up and help you trade with more confidence.
How Can I Tell If a Support or Resistance Level Is Strong?
A strong level is one the market has a history with. Think of it like a wall that's taken a few hits but refuses to crumble. Every time price fails to break through, that wall gets a little bit stronger in the eyes of other traders.
Look for these tell-tale signs of a powerful zone:
- Multiple Touches: The more times price has bounced off a level, the more significant it is. A zone with five solid rejections is a completely different beast than one with just two.
- Sharp Reversals: How did price react the last time it was here? If it shot away with explosive momentum and heavy volume, that's a huge clue. It signals a major imbalance between buyers and sellers, making that level a formidable barrier.
- Timeframe Significance: A support or resistance zone on a weekly or daily chart carries far more weight than one you spot on a 5-minute chart. Higher timeframes show you where the "big money" is making its stand.
The strength of a support or resistance zone is written in its history. The more violent the rejections and the more times it has held firm, the more you need to pay attention when price comes back for another visit.
What Is the Best Timeframe for Finding These Levels?
There's no single "best" timeframe—it really boils down to your personal trading style. That said, the most reliable and important levels are almost always found on the higher timeframes, like the daily, weekly, and monthly charts. These are the market's major structural pillars.
Even if you're a day trader, you should always start your analysis here. Pinpoint the big-picture zones on the daily chart first. Then, you can drill down to a 4-hour or 1-hour chart to fine-tune your entries within that larger context. Trading in harmony with the higher-timeframe levels gives your setups a much higher probability of playing out.
Can This Strategy Work for Day Trading and Swing Trading?
Absolutely. The principles of support and resistance are universal. They apply to all trading styles and timeframes because they're rooted in market psychology, which never really changes.
- For Swing Traders: You'll be focusing on the key zones you find on the daily and weekly charts. Your goal is to hold positions for several days or even weeks to capture those big swings between major levels.
- For Day Traders: You'll use the major daily levels as your roadmap for the day. But you'll execute your trades on much shorter timeframes (like the 5-minute or 15-minute), looking to scalp bounces or breaks at smaller, intraday support and resistance areas.
The core concepts are identical. The only thing that changes is the scale of your trades and how long you hold them.
Ready to stop relying on confusing indicators and start reading the market with clarity? At Colibri Trader, we provide action-based programs that teach you how to master price action. Take our free Trading Potential Quiz today!