


Mastering Price Action Trading A Practical Guide
Price action trading is all about watching the market’s heartbeat on a bare‐bones price chart. You’re not hiding behind lagging signals—you're making sense of raw price swings and deciding when to jump in or sit out. In essence, you’re eavesdropping on the tug-of-war between buyers and sellers as it happens.
What Is Price Action Trading
Think of every candlestick as a flashpoint in a battlefield. Bulls charge forward with green candles, while bears push back with red ones. A long green candle signals a bull rally; a long red one shows bears taking ground. Price action trading is the craft of reading those daily skirmishes to predict which side will claim victory in the bigger conflict.
Rather than stacking your chart with indicators like RSI or MACD, you strip everything away and focus purely on how price behaves. After all, every piece of market intelligence—from economic reports to trader psychology—is already baked into each tick. You’re simply tuning in at the source.
This approach dates back centuries. In 17th-century Japan, rice merchants began sketching candlestick charts to make sense of price swings. By the 1700s, Munehisa Homma had traced how collective trader psychology left distinct footprints in those candle formations. You can discover more about these trading strategies on chartswatcher.com.
The Philosophy Behind The Method
Indicators calculate past price data—so they always trail the market. Price action traders prefer to see each candle as it prints and react on the fly. That way, you’re never looking at yesterday’s story when today’s drama is unfolding.
Focus on pure price movement to gain an unfiltered view of supply and demand. This clarity supports faster, more confident decisions and a truer read on market sentiment.
By cutting out the noise, you center on three vital questions:
- Where is the price moving right now?
- How strongly is it pushing?
- At what levels has it hit resistance or support before?
Answering these lays the groundwork for a solid trading plan. Next, let’s line up price action and indicator-based styles side by side.
Price Action vs Indicator-Based Trading
Below is a concise comparison of these two dominant trading philosophies:
| Aspect | Price Action Trading | Indicator-Based Trading |
|---|---|---|
| Primary Focus | Raw price movement and candlestick patterns | Mathematical formulas and oscillators |
| Decision Speed | Immediate—reacts to live chart events | Delayed—waits for indicator confirmation |
| Chart Clarity | Minimalist, showing only price | Often crowded with multiple overlays |
| Analysis Type | Discretionary, based on chart context | Systematic, follows preset indicator rules |
In practice, price action gives you speed and simplicity, while indicators offer structure and signals—albeit with a built-in lag. Understanding both will help you decide which approach suits your temperament and trading goals.
Reading the Market's Core Structure

If you want to trade with a clean chart, you first have to understand its architecture. The market has a memory, and that memory is etched into its very structure. As a price action trader, your job is to learn how to read this structure to find high-probability zones where the balance of power between buyers and sellers is about to shift.
Think of it like reading a map before a hike. You don't just start walking; you identify the major landmarks—the mountains and rivers that define the terrain. In trading, our landmarks are support and resistance. These aren't just lines you draw on a chart; they are dynamic zones where significant battles between bulls and bears were fought and won.
Understanding Support and Resistance Zones
Support and resistance are the absolute bedrock of price action trading. They are the horizontal price levels that have historically stopped a move in its tracks or sent it flying in the opposite direction.
- Support Zone: This is a price area where buying pressure has previously overwhelmed selling pressure, causing the price to bounce. It acts as a floor, preventing the price from dropping further.
- Resistance Zone: This is an area where sellers have historically stepped in with force, pushing the price back down. It's a ceiling that caps any upward movement.
The most important thing to remember is to see them as zones, not as razor-thin lines. Price rarely turns on a dime at an exact number. Instead, it interacts with a broader area where traders made crucial decisions in the past. A support level that held firm at $50.00 might see buyers reappear anywhere between $49.80 and $50.20 on a retest.
These zones are the market’s memory of past turning points. When price returns to these areas, it’s like testing an old battleground. We watch to see if history will repeat itself.
Identifying these zones is your first step toward building a coherent map of the market. You absolutely need a solid grasp of the overall market structure, as it provides the essential context for every single trade you take.
Finding the Footprints of Big Money
While support and resistance mark historical turning points, supply and demand zones tell us something much deeper—they reveal the footprints left behind by institutional money. These are areas of intense price consolidation that come right before a massive, explosive move up or down.
Imagine a huge financial institution needs to buy millions of shares but doesn't want to send the price soaring before they're done. They'll accumulate their position quietly within a tight price range. Once their orders are filled, the lack of sellers allows the price to launch upwards. That tight range they left behind? That becomes a demand zone—a pocket of unfilled buy orders just waiting for price to return.
A supply zone, on the other hand, is an area where institutions distributed huge sell orders, leading to a sharp drop in price. These zones act like magnets, often pulling price back to them in the future.
How to Identify Supply and Demand Zones
Spotting these zones takes a trained eye, but the basic idea is pretty simple. You're looking for specific price patterns that signal a massive imbalance was just created.
- Find a Strong Move: First, look for a big, explosive price move—you'll see it as a series of long-bodied candles. This is your clue that a major imbalance between buyers and sellers just happened.
- Identify the Origin: Now, trace that powerful move back to where it started. The origin is usually a small area of sideways consolidation or a tight cluster of smaller candles right before the explosion.
- Draw the Zone: Draw a box around this origin point. This box is your supply or demand zone, an area where unfilled institutional orders are likely still waiting.
By mapping out these critical structural areas, you stop just reacting to what price is doing now. You start anticipating where the most significant moves are likely to begin, giving your price action trading a strategic, proactive edge.
Decoding High-Probability Candlestick Patterns
Once you can read the market’s core structure, it’s time to learn the specific signals that tell you when to pull the trigger. Candlestick patterns are the language of price action. They’re the footprints of the battle between buyers and sellers, and some formations give you a massive clue about what’s likely to happen next.
But let me be clear: simply memorizing patterns is a rookie mistake. The real skill is in understanding the story each pattern tells about market psychology. A candlestick signal is powerful, but its power is magnified tenfold when it shows up at a critical level on your chart, like a major support or resistance zone.
The Pin Bar: A Story of Rejection
One of the most powerful and easiest-to-spot signals is the Pin Bar. You might also hear it called a Pinocchio Bar. It’s defined by a long wick (or tail) and a tiny body, making it look like a pin. That long wick tells a very clear story: price was rejected, hard.
Imagine price is climbing towards a major resistance zone you’ve been watching. A pin bar forms when buyers try to force the market above that level, but sellers come crashing in and slam the price right back down before the candle closes. The long upper wick is the battlefield evidence of that failed breakout.
- Bullish Pin Bar: Has a long lower wick. This shows that sellers tried to push prices down, but buyers fought back, regained control, and drove the price up by the close. It’s a signal that the next move could be higher.
- Bearish Pin Bar: Has a long upper wick. This tells you buyers failed to hold their ground, and sellers are now in charge. It’s a signal that the next move could be lower.
Context is what separates a good signal from a great one. A bearish pin bar at a major resistance level is the market shouting, "Not today!" A random one floating in the middle of a choppy range? It’s just noise.
The Engulfing Pattern: A Shift in Momentum
While the Pin Bar shows rejection, the Engulfing Pattern signals a decisive and forceful shift in who’s in control of the market. This is a two-candle pattern, and it happens when the second candle completely "engulfs" the entire body of the candle that came before it.
Think of it as a changing of the guard. A small candle might show some indecision or weak momentum. But when it's followed by a massive candle in the opposite direction, it shows a new force has entered the market with overwhelming conviction.
An engulfing pattern is a clear visual statement of intent. It tells you that the dominant market sentiment has just been forcefully reversed.
A Bullish Engulfing Pattern happens when a big green candle completely swallows the previous red candle. This tells you buyers have wrestled control away from sellers. On the flip side, a Bearish Engulfing Pattern is when a huge red candle engulfs the prior green one, signaling a powerful shift to selling pressure. For a deeper dive into these and other formations, check out my detailed guide on Japanese Candlestick Patterns.
Why Context Is Everything in Price Action Trading
Spotting these patterns is only half the battle. Their real predictive power comes from where they appear on the chart. A perfect-looking pin bar in the middle of nowhere means very little. But a pin bar that rejects a key daily resistance level? That’s a high-probability setup I’d bet on.
Historical data backs this up. One study analyzing over two decades of data found that price action strategies, using signals like pin bars and engulfing patterns, produced a win rate between 55% and 65% when traded at key support and resistance levels. Digging deeper, pin bar setups at major horizontal levels showed a 62% win rate over a 10-year period, with an average risk-reward ratio of 1.8:1.
This drives home the most important rule of price action trading: patterns provide the trigger, but structure provides the context. You have to wait for a powerful signal to form at a zone of interest you’ve already identified. This discipline is what separates the traders who make consistent money from those who chase random signals all day. It's about combining the "what" (the pattern) with the "where" (the level) to create a trading edge you can count on.
Executing a Trade From Start to Finish
Knowing how to spot patterns and draw zones is one thing, but theory alone won't grow your account. The real magic in price action trading happens during execution—that moment you combine analysis, patience, and decisive action into a repeatable process. This is where you cross the bridge from just reading a chart to putting real capital on the line.
Let's walk through a complete trade, from the spark of an idea to the final exit. Thinking through a hypothetical example makes the whole process tangible and shows you how to build a solid case for a trade before you ever click "buy" or "sell." We'll start with the big picture and drill down to a precise entry and exit plan.
Step 1: Identify Your Area of Interest
The first move isn't to go hunting for a specific pattern. It’s to find a high-probability location on the chart—a place where you expect a real battle between buyers and sellers. To do this, we need to zoom out and look at a higher timeframe, like the daily chart, to see what's really going on.
Let's say we're looking at the EUR/USD daily chart. We see the price has been grinding higher for two straight weeks and is now closing in on a major resistance level at 1.0850. This is a price point where sellers have slammed the door shut twice in the last three months.
That historical level is our "area of interest." It’s the battleground we want to watch. We're not trading yet; we're just setting an alert and patiently waiting for the price to show up.
This simple workflow is the core of a professional price action approach.
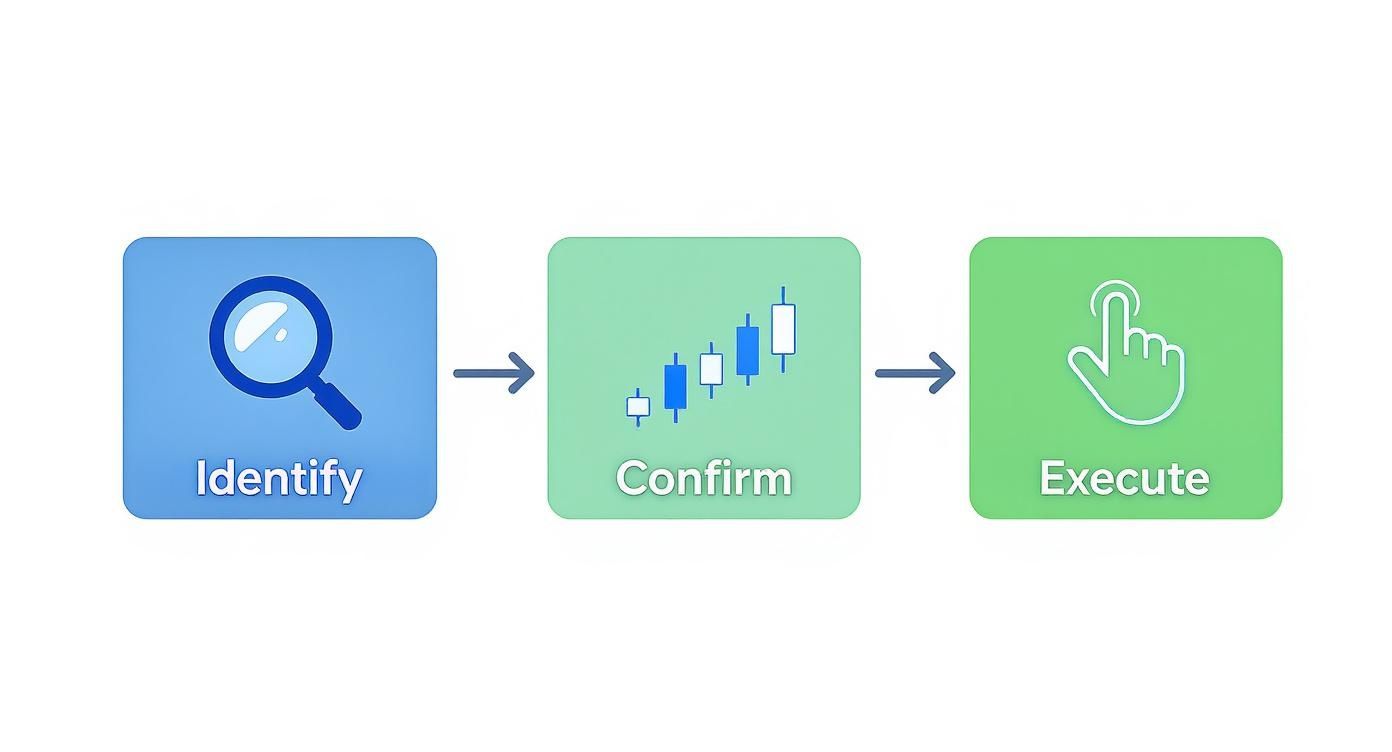
Notice how execution is the final step. It only comes after careful identification and confirmation, which is how you avoid trading on impulse.
Step 2: Wait for Price Action Confirmation
Once the price pushes into our 1.0850 resistance zone, we switch from being an observer to a detective. We can now zoom into a lower timeframe, like the 4-hour chart, to hunt for a specific candlestick signal that confirms our bearish idea. We need hard evidence that sellers are actually defending this level just like they did before.
So, we wait. One 4-hour candle closes, then another. The market is poking and prodding the zone, but there's no clear signal. And then, it happens: a perfect bearish pin bar forms.
The candle's long upper wick shoots well above the 1.0850 level but gets violently rejected, with the price closing way back down near its open. This is the confirmation signal we were looking for.
The pin bar tells a story. It says: "Buyers tried to break through resistance, failed spectacularly, and now sellers are taking over." This is our trigger.
This signal gives us the confidence to act because it lines up perfectly with our high-level analysis. It’s not just a random pattern; it's the right pattern in the right place at the right time.
Step 3: Plan and Execute the Trade
With confirmation in hand, it’s time to define the exact mechanics of the trade. Rushing this part is a rookie mistake that costs traders dearly. We need to calculate our entry, stop-loss, and take-profit levels before we risk a single dollar.
Here’s how we'd structure the trade based on that bearish pin bar:
- Entry Point: We'll place a sell-stop order just a few pips below the low of the pin bar. This is key—it ensures we only get into the trade if the price starts moving in our direction, confirming the bearish momentum.
- Stop-Loss Placement: Our protective stop-loss goes just a few pips above the high of the pin bar's wick. This is our line in the sand. If the price breaks above this level, our trade idea is wrong, and we need to get out immediately.
- Take-Profit Target: We scan the chart to the left to find the next significant support level below our entry. We spot a minor support zone around 1.0750, which gives us a fantastic risk-to-reward ratio. We place our take-profit order right there.
By following this three-step process—Identify, Confirm, Execute—you turn price action trading from a guessing game into a structured, disciplined methodology. You wait for the market to come to your levels and give you a clear signal before acting. That’s how you start putting the odds in your favour.
Building a Bulletproof Risk Management Plan
Spotting a great pattern is exciting, but that’s only half the battle. If there's one thing that truly separates traders who make it from those who don't, it's an ironclad commitment to risk management.
Without it, even the most brilliant analysis will eventually lead to a blown account. Think of your capital as your lifeblood in this business; your number one job is to protect it.
This isn't just about fluffy advice like "trade safely." It's about setting hard, non-negotiable rules that shield your account when the market inevitably moves against you. A disciplined approach to risk is the foundation of any successful trading career.
And a lot of traders are trying to build one. A 2023 report from ESMA found that 72% of retail forex traders in the EU use price action as their main tool. The NFA in the US noted a similar trend, with over 65% of its registered forex traders using these techniques.
The Unbreakable 1 Percent Rule
The first and most important rule you need to live by is the 1% rule. It’s simple: never, ever risk more than 1% of your total trading capital on a single trade.
Got a $10,000 account? Your maximum loss on any one idea is capped at $100. That's it.
This rule is your best defense against making emotional decisions during a losing streak. Even if you hit ten consecutive losses—which can and will happen to every trader—you've only lost 10% of your capital. You survive to trade another day.
Setting a Structural Stop Loss
A stop-loss is your escape hatch—your pre-planned exit if a trade goes sour. But too many traders place their stops based on an arbitrary dollar amount they're willing to lose. That's a huge mistake. As a price action trader, you need to set a structural stop-loss.
This means you let the chart—the market's own structure—tell you where your stop should go.
- For a bearish pin bar setup, the stop goes just a few pips above the high of the pin bar's wick.
- For a bullish engulfing pattern, the stop is placed just below the low of that big engulfing candle.
When you do this, you're letting the market prove your trade idea wrong. If the price breaks past that structural point, it’s no longer your opinion against the market; the market itself has told you the setup is invalid. That’s your logical cue to get out.
To dive deeper, check out our full guide on the best practices for risk management.
Demanding a Positive Risk-to-Reward Ratio
Finally, every single trade you consider must offer a healthy risk-to-reward ratio. Your potential profit needs to be much bigger than your potential loss. A good starting point is a minimum of 1:2, meaning you're aiming to make at least twice what you're risking.
By only taking trades where your potential reward is at least double your risk, you don't need to win every trade to be profitable. In fact, you can be wrong more often than you are right and still grow your account.
Let's go back to that $10,000 account. If you risk $100 (your 1%), your profit target should be at least $200. This mathematical edge is what creates consistency over the long run, ensuring your winning trades more than make up for the inevitable losers.
Your Roadmap to Becoming a Confident Trader
You've now got the core concepts, the patterns, and the risk management rules that separate professional price action traders from the rest. But knowing the theory is just the starting line of a much longer race. Real mastery isn't found in a book or an article; it's forged in the fires of deliberate practice, patience, and countless hours staring at live charts.
The path from novice to confident trader isn't about jumping in with real money and hoping for the best. That’s a recipe for disaster. Instead, your journey should start in a completely risk-free zone where you can build your skills without the pressure of losing a single penny.
Start With a Demo Account
Before you even think about risking real capital, your first stop must be a demo trading account. Think of it as your personal trading dojo. It's the perfect arena to apply everything you've just learned—from spotting support and resistance to nailing pin bars at key levels—with zero financial downside.
The goal here isn't to rack up hypothetical profits. It's to accumulate chart time. This means watching price unfold, candle by candle, learning to see patterns in real time, and developing an almost intuitive feel for the market's rhythm. Use this time to:
- Practice Identifying Structure: Get in the habit of marking up your charts daily with support, resistance, supply, and demand zones.
- Log Your Setups: Keep a detailed journal of every trade you "take." Note the pattern, why you took it, and how it played out.
- Refine Your Execution: Practice setting stop-losses based on market structure and calculating the risk-to-reward on every single setup you find.
This is foundational work. It builds the muscle memory and the rock-solid confidence you'll need when your own money is on the line.
Cultivate Unbreakable Discipline
Beyond the charts, developing the right mindset is everything. Trading is a mental game, and building bulletproof self-discipline is non-negotiable if you want to stick to your plan when things get heated. You can explore some actionable self-discipline techniques to start building the mental toughness you'll need for the long haul. The market will constantly throw fear and greed at you; discipline is your only shield.
Becoming a successful trader is a marathon, not a sprint. It’s a learnable skill built on a foundation of patience, discipline, and a deep, practical understanding of how markets truly move.
As you keep practicing, the path forward becomes much clearer. If you're ready to speed up your learning with a proven framework, Colibri Trader offers resources for every step of your journey. You can start by taking our free Trading Potential Quiz to see where you stand or download the first two chapters of our Amazon bestseller to really lock in your understanding of price action.
For those looking for a more hands-on experience, our action-based programs and mentorship provide a direct path to refining your skills. The journey demands dedication, but with the right map and consistent effort, you absolutely can learn to read the market's story with clarity and confidence.
Common Questions About Price Action Trading
As you start getting your hands dirty with these concepts, you're bound to have some practical questions. Let's be honest, taking on a new trading style always feels a bit like learning a new language. It’s smart to tackle the common sticking points right from the start.
This section is all about clearing up that initial fog and giving you straight answers to the questions I hear most often from traders just starting with price action.
Can I Use Price Action Trading on Any Timeframe?
Absolutely. This is one of the biggest strengths of price action—it's universal. The principles of market structure, candlestick patterns, and support and resistance are fractal. That’s a fancy way of saying the patterns of human behavior—the fear, greed, and indecision that show up on a daily chart—are the exact same ones you'll see on a 5-minute chart.
A pin bar getting rejected at a key resistance level tells the same story on a weekly chart as it does on a 15-minute chart. The only difference is how long the resulting move lasts and how big it is.
- Long-Term Traders: You can use daily and weekly charts to spot major trends and structural turning points for swing trades that might play out over weeks or even months.
- Day Traders: You can apply the very same ideas to 1-minute, 5-minute, or 15-minute charts to hunt for opportunities within a single trading session.
The trick is to pick your timeframe and stick to it. Don't let conflicting signals from other charts throw you off your game.
Do I Need Any Indicators at All with This Method?
While pure price action trading is all about the “naked chart,” some traders find it helpful to use one or two simple indicators as a backup tool, not the main event. The goal is to avoid “analysis paralysis,” where you have so many conflicting signals from different indicators that you can’t make a decision.
For example, a trader might pop a 20-period Exponential Moving Average (EMA) on their chart. They aren't looking for crossover signals, but just using it as a quick visual guide for the short-term dynamic trend. If the price is consistently bouncing off and staying above the EMA, it just confirms the uptrend they already see in the price action itself.
Here's a good rule of thumb: If an indicator helps you read the price action more clearly, it might be a useful addition. If it clutters your chart or tells you something different than what the price is telling you, it’s just noise. Get rid of it.
How Long Does It Realistically Take to Become Profitable?
This is the million-dollar question, isn't it? And the only honest answer is: it’s different for everyone. There's no magic timeline. Profitability in trading isn't about counting the days; it's about hitting key milestones.
- Mastering the Core Concepts: This means truly getting market structure and the handful of patterns that matter.
- Developing Discipline: This is the hard one. It's about following your risk management rules every single time, without cheating.
- Gaining Screen Time: You have to put in the hours. Spending hundreds of hours on a demo account is where you build the gut feeling and pattern recognition skills that you can't learn from a book.
For someone who is truly dedicated, it can take anywhere from six months to a couple of years of focused work to find consistent profitability. It's a marathon, not a sprint, and it all comes down to your commitment to learning and, most importantly, your ability to manage your own head.
At Colibri Trader, we've built a clear roadmap to help shorten that learning curve. Whether you're just starting out or looking to sharpen your edge, our action-based programs and mentorship are designed to build your confidence and competence. Discover your trading potential and learn more at https://www.colibritrader.com.