


Trading with a Price Action Pattern
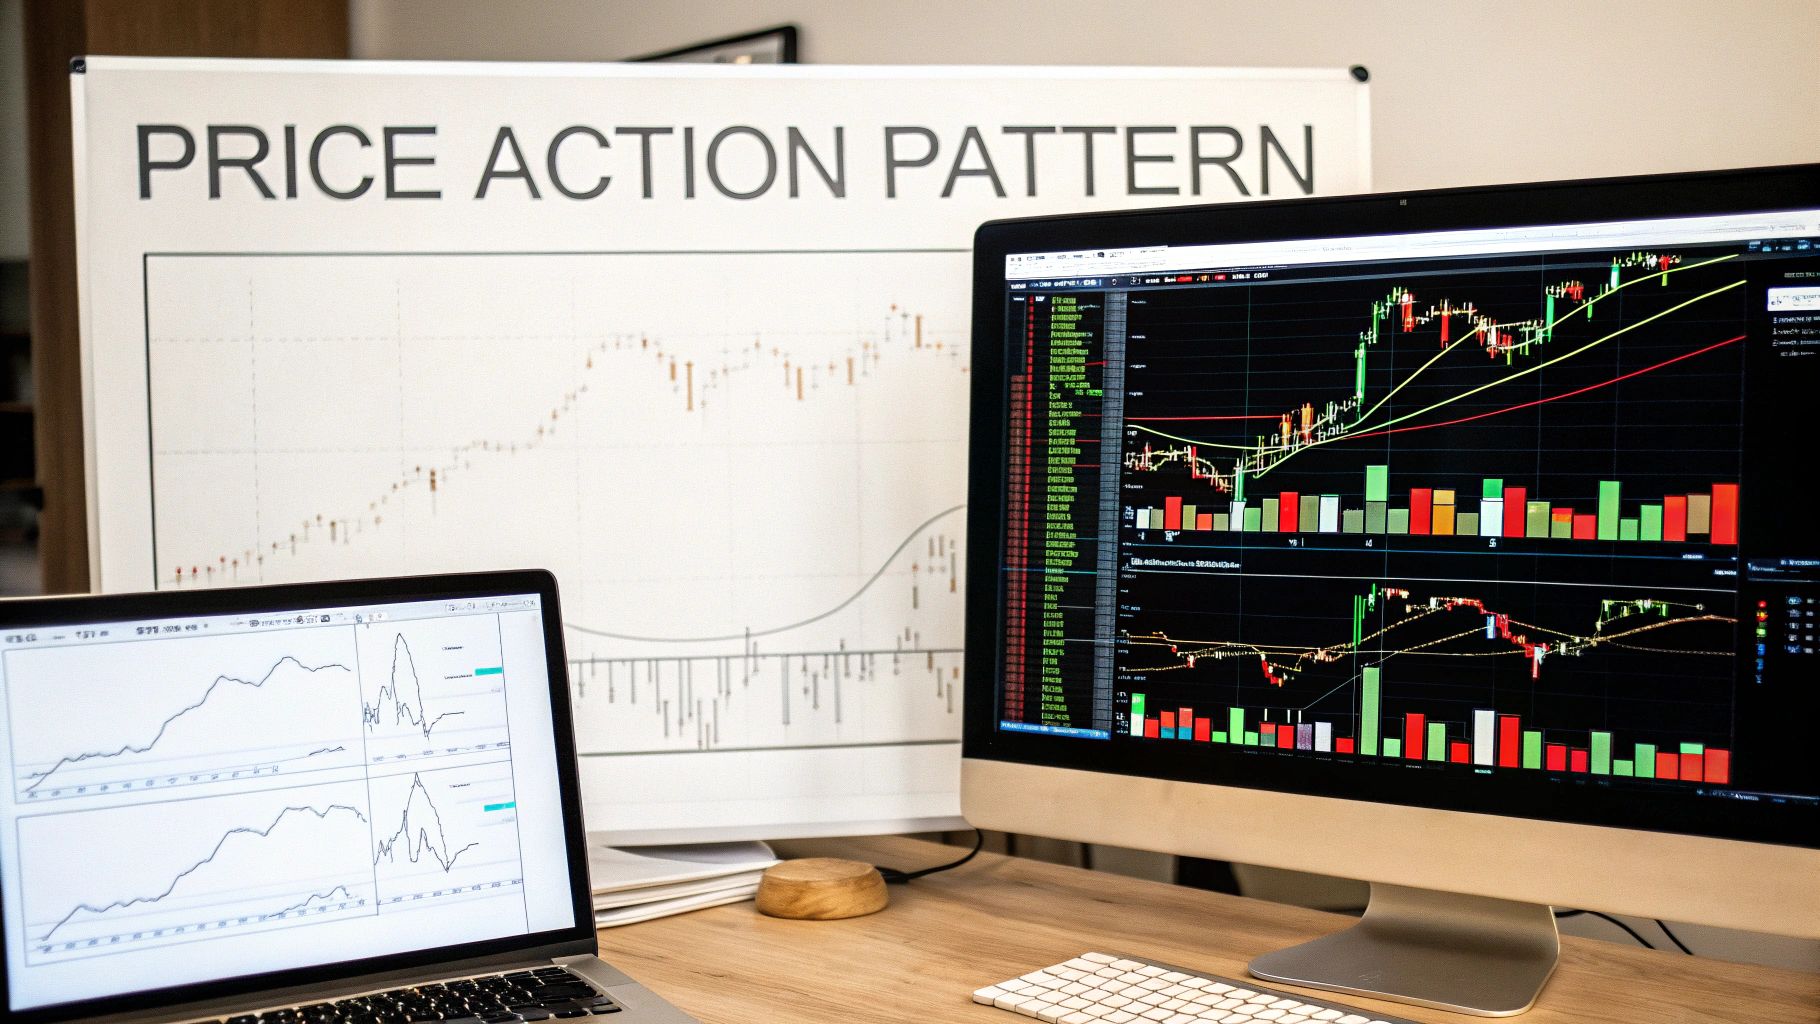
So, what exactly is a price action pattern?
Think of it as the market's own special kind of sign language. It's a specific shape or a series of price moves on a chart that you can learn to recognize—one that often hints at where the market might be headed next. These patterns aren't random; they're created by the combined actions of every single buyer and seller in the market. They tell a story about the constant tug-of-war between supply and demand.
By learning to read these visual cues, you can start making trading decisions based on what the market is actually doing, without getting bogged down by a dozen complicated indicators.
Learning to Read the Market's Story

Imagine trying to follow a conversation happening in a foreign language. You can hear the sounds, but the meaning is lost. That’s a lot like looking at a trading chart without understanding price action. The charts are always telling you a story, but if you don't speak the language, it just looks like a bunch of random noise.
A price action pattern isn't just a squiggle. It's the visual record of the fight between the bulls (buyers) and the bears (sellers). When you focus on the raw, unfiltered price movement, you start to see the plot develop. You can move from just guessing to actually anticipating the market's next move based on its past behavior and the underlying psychology driving it.
If you're looking for a deeper dive into the basics, our guide on understanding price action trading is a great place to start.
The Core Idea Behind Price Action
To really grasp price action, it helps to understand the key principles that underpin this entire approach to trading. They're simple but incredibly powerful concepts.
The table below breaks down the fundamental ideas that form the foundation of price action trading.
Core Concepts of Price Action Trading
| Concept | Brief Explanation | Why It Matters |
|---|---|---|
| Price Is Paramount | Price movement on the chart is the most important piece of information. Everything else is secondary. | It cuts through the noise of news and opinions, focusing on the ultimate result: the price. |
| History Tends to Repeat | Markets are driven by human psychology (fear and greed), which doesn't change. Therefore, patterns often recur. | By recognizing past patterns, you can anticipate potential future moves with higher probability. |
| Market Structure | The framework of swing highs and lows that defines trends and ranges. | It provides context. A pattern's meaning can change dramatically depending on where it appears. |
These concepts aren't new—they're the time-tested pillars that successful traders have relied on for generations to interpret market behavior and make informed decisions.
Where Did This All Come From?
This whole philosophy has some serious history behind it. The idea of analyzing price charts isn't some new fad; it dates all the way back to the early 20th century.
Pioneers like Charles Dow and Richard D. Wyckoff laid the groundwork for what we now call technical analysis. They were the ones who first proposed that by simply studying price movements and market cycles, you could forecast what was likely to happen next.
The market's price movements are the footprints of money. By learning to read these footprints, you follow the path of institutional capital rather than getting lost in the noise of lagging indicators and endless news cycles.
Their core principle—that the chart tells you everything you need to know—is just as relevant today as it was a hundred years ago. This guide is built on those same proven ideas, adapted into a practical framework you can use in today's fast-moving markets.
The Building Blocks of Every Chart Pattern
Before you can read a complex story, you have to learn the alphabet. It’s the same exact logic in trading. Every powerful price action pattern you see painted across a chart is built from just a few simple, foundational elements.
Think of these as the basic letters and punctuation of the market’s language. Getting a firm grip on them is the first real step toward reading charts with confidence. The three most essential building blocks are candlesticks, support and resistance levels, and trend lines.
The Story of a Single Candlestick
A single candlestick is like a miniature drama playing out over a specific time period. It’s not just a colored bar on a screen; it’s a visual summary of the tug-of-war between buyers (the bulls) and sellers (the bears).
The thick part, known as the body, shows you the opening and closing price for that session. Those thin lines sticking out, called wicks or shadows, reveal the highest and lowest points the price hit. A long upper wick, for instance, tells a clear story: buyers tried to rally and push the price way up, but sellers wrestled back control and slammed it back down.
By looking at the size and shape of the body and wicks, you can get an instant read on market sentiment. A long green candle screams strong buying pressure. A tiny candle with long wicks on both ends? That signals pure indecision. Each one tells a complete story of a session's conflict.
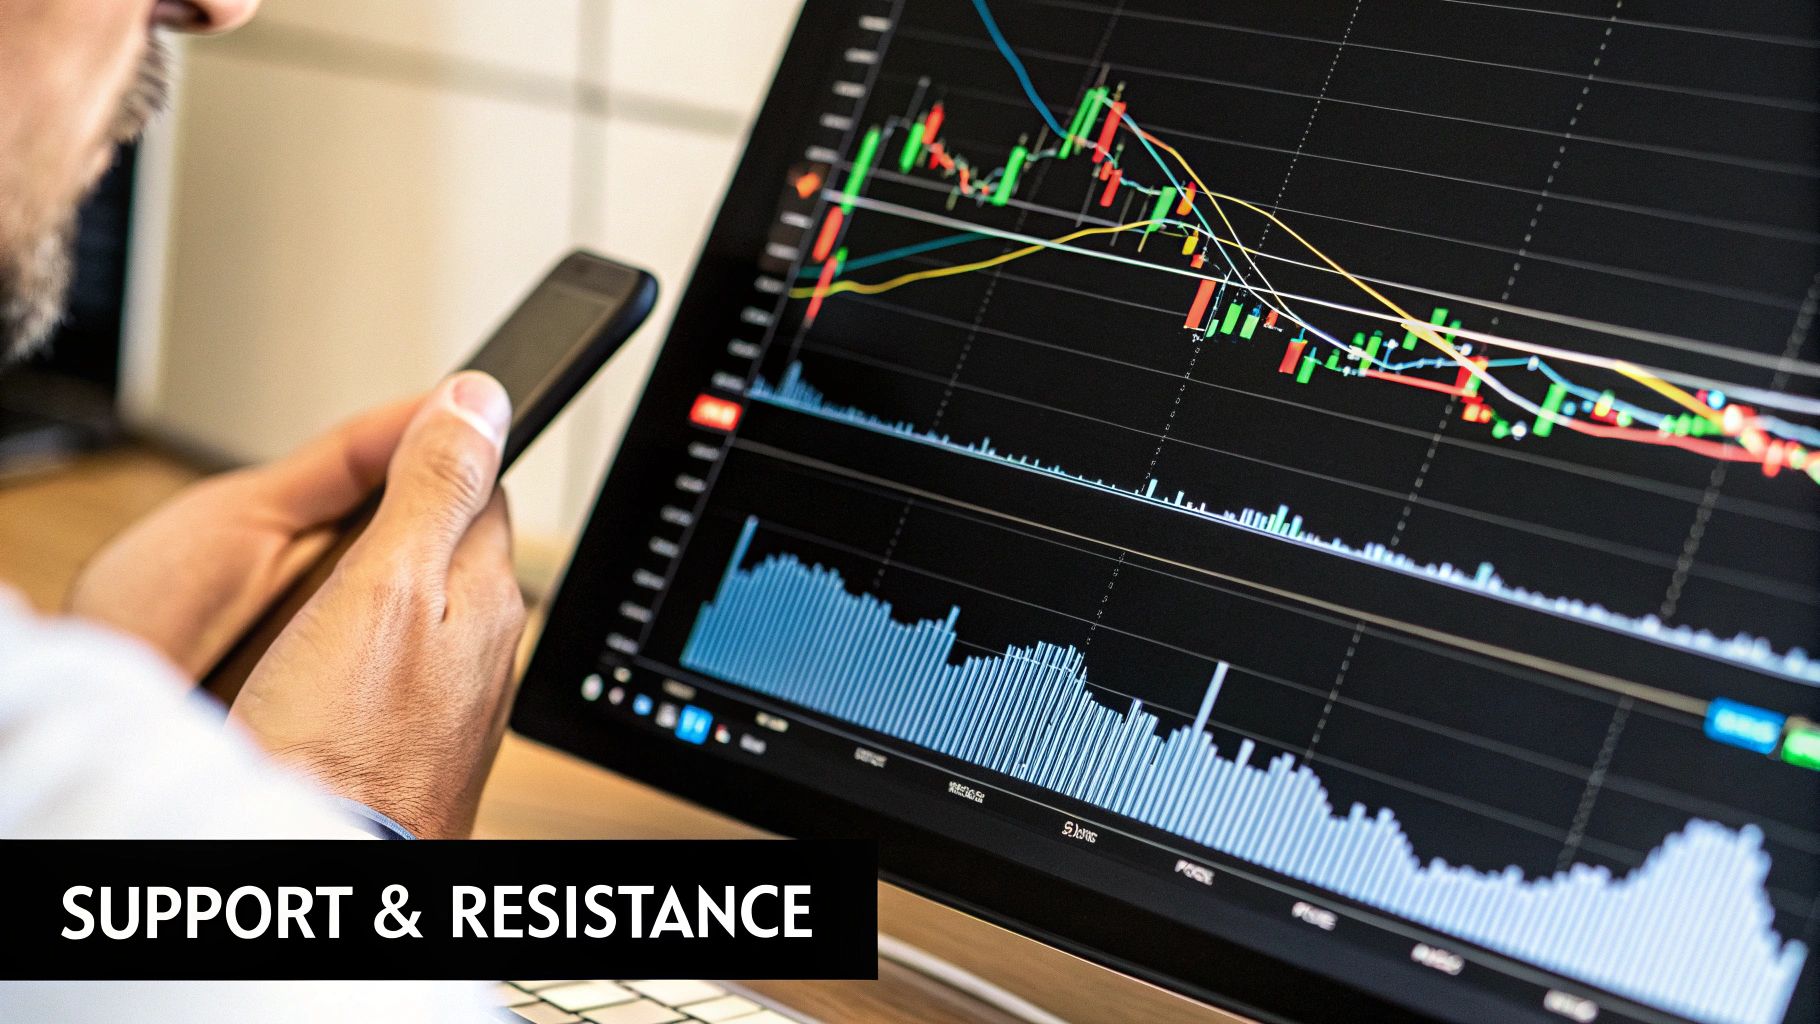
Support and Resistance: The Market's Memory
Support and resistance levels are the horizontal floors and ceilings of the market. They represent price zones where the buying or selling pressure was so strong in the past that it stopped a price move dead in its tracks. These levels are critical because they highlight areas of "market memory."
- Support: Think of this as a floor. It’s a price level where demand is strong enough to keep the price from dropping any further. Buyers see value here and jump in, propping the price back up.
- Resistance: This acts like a ceiling. It’s a price point where sellers overwhelm buyers, preventing the price from climbing higher.
When the price approaches a major support or resistance level, it’s a decision point. Will the level hold and cause a bounce, or will it break and kick off a whole new trend? Spotting these key zones is how you start anticipating market reactions before they happen.
A price action pattern gains immense credibility when it forms at a pre-existing support or resistance level. This convergence of signals—a pattern at a key level—is what traders call confluence, and it can significantly increase the probability of a successful trade.
Trend Lines: Drawing the Market's Direction
While support and resistance are flat, trend lines are diagonal lines that help you see the market’s overall direction at a glance. They connect a series of higher lows in an uptrend or lower highs in a downtrend.
Drawing a trend line is a simple but incredibly effective exercise. For an uptrend, you just connect at least two significant swing lows. As long as the price respects that line and stays above it, the uptrend is considered intact. In a downtrend, you do the opposite, connecting two or more swing highs.
Trend lines have two main jobs: they define the current trend and act as dynamic support or resistance. A clean break of a well-established trend line is often one of the first red flags that the market’s momentum is shifting, giving you a vital clue about what might be coming next.
How to Spot Market Reversal Patterns
Some of the best trading opportunities pop up right when a market trend is losing steam and getting ready to turn around. Learning to spot these critical turning points is a core skill in price action trading. Think of it as seeing the signs of an exhausted trend before the rest of the market catches on.
These turning points are often telegraphed by a specific type of price action pattern called a reversal pattern. By getting inside the market psychology that creates these shapes on the chart, you can learn to position yourself for the next big move.
The Classic Head and Shoulders Pattern
The Head and Shoulders is one of the most reliable and well-known reversal patterns out there. It’s a strong signal that an uptrend might be ending, paving the way for a new downtrend. It gets its name because, well, it looks like a person's head with a shoulder on each side.
Here’s how it unfolds and what each part tells you:
- Left Shoulder: The market is in an uptrend and makes a new high before pulling back. This creates the first peak.
- Head: Buyers come back with a final burst of enthusiasm, pushing the price to an even higher high. But the pullback that follows is often deep and significant.
- Right Shoulder: The bulls try to rally one last time but run out of gas, failing to reach the previous high (the head). This lower high is a huge red flag—it shows that buying momentum is fading fast.
The most critical part of this pattern is the neckline. This is a trendline drawn to connect the lows of the pullbacks after the left shoulder and the head. A decisive break and close below this neckline is the classic trigger, confirming that sellers have wrestled back control.
The Double Top and Double Bottom
Another powerful reversal formation is the Double Top or Double Bottom. These patterns are often easier to spot and represent a clear, unmistakable test of a key price level.
A Double Top looks like the letter "M" and shows up at the end of an uptrend. It forms when the price hits a resistance level, pulls back, and then rallies to test that same level again but can't break through. This second failure shows buyers just don't have the strength to push prices higher, and a reversal is probably on the cards.
On the flip side, a Double Bottom looks like the letter "W" and signals the potential end of a downtrend. The price falls to a support level, bounces, then falls again to retest that same support. When it fails to break lower the second time, it’s a strong hint that selling pressure is drying up and buyers are starting to step in.
The psychology here is simple: these patterns represent a failed attempt by the market to continue its trend. That second failed attempt is a powerful signal that the underlying momentum has shifted, offering a high-probability entry for savvy traders.
Key Candlestick Reversal Signals
Individual candlesticks can also be potent clues for potential reversals, especially when they form at key support or resistance levels. Two of the most common ones every trader should know are the Hammer and the Shooting Star.
The image below gives you a look at the historical success rates for these two patterns, which highlights just how effective they can be.
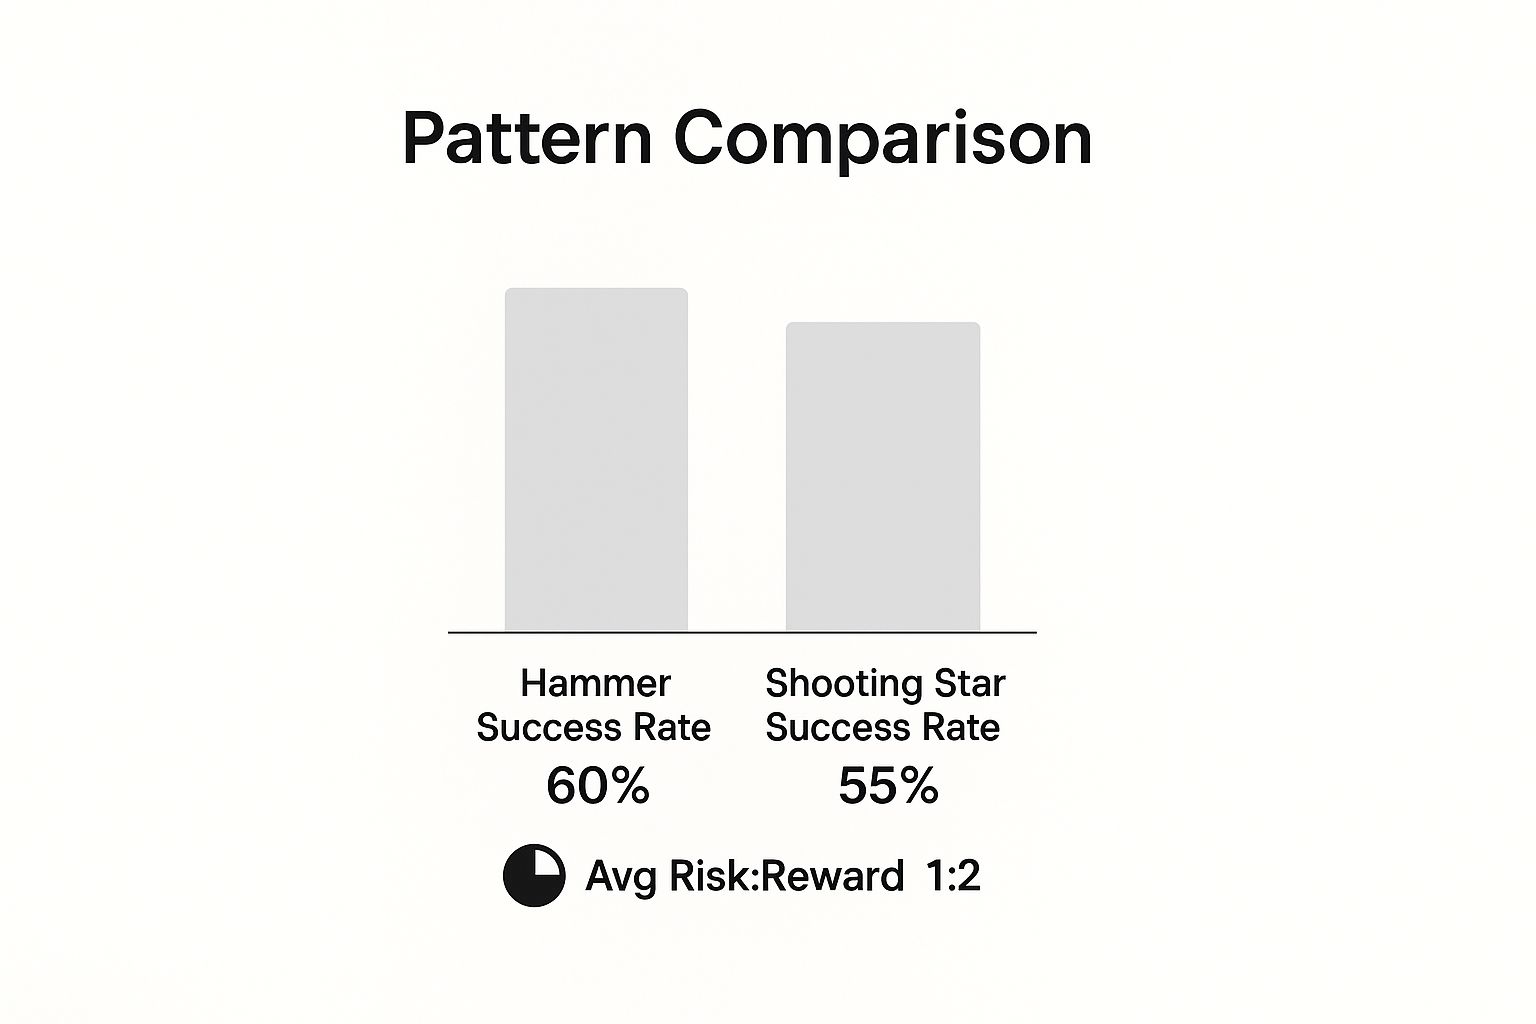
As you can see, both patterns have a historical success rate better than 50%. While that’s not a guarantee, it does offer a statistical edge, especially when you pair it with a solid risk-to-reward setup.
To help you quickly tell these patterns apart on a live chart, here's a quick comparison table breaking down their key features.
Comparison of Major Reversal Patterns
| Pattern Name | Type (Bullish/Bearish) | Key Feature to Identify | What It Signals |
|---|---|---|---|
| Head and Shoulders | Bearish | Three peaks, with the middle peak (Head) being the highest. | The end of an uptrend and a potential shift to a downtrend. |
| Double Top | Bearish | Two consecutive peaks at roughly the same price level ("M" shape). | Buyers' failure to break resistance, signaling a likely reversal down. |
| Double Bottom | Bullish | Two consecutive troughs at roughly the same price level ("W" shape). | Sellers' failure to break support, signaling a likely reversal up. |
| Hammer | Bullish | A small body at the top with a long lower wick (at least 2x the body). | A rejection of lower prices, often found at the bottom of a downtrend. |
| Shooting Star | Bearish | A small body at the bottom with a long upper wick (at least 2x the body). | A rejection of higher prices, often found at the top of an uptrend. |
This table is a great starting point, but the real skill comes from identifying these patterns in real-time and understanding the context in which they appear.
Price action strategies are all about using statistically significant patterns and levels that have proven effective over time. Major markets provide tons of empirical evidence for this, with patterns like the head and shoulders often preceding trend changes by weeks in major indices. To dive deeper, you can explore a comprehensive guide on these strategies and find more insights about price action trading on chartswatcher.com.
Identifying When a Trend Will Continue
Chasing market reversals can be exciting, but some of the most consistent wins come from hopping aboard a trend that’s already rolling. Big moves don’t sprint in a straight line—they surge, pause, then surge again.
Those pause-and-reload moments are known as continuation patterns. They tell you the trend still has gas in the tank. By learning to spot these setups, you can step in at a lower-risk entry rather than chase a breakout after it’s already taken off.
Flags: A Brief Pause Before the Next Move
One of the easiest continuation setups to recognize is the flag. Picture a strong, vertical run—that’s your “flagpole.” Next comes a short, tight rectangle where prices drift sideways or slightly against the trend—this is the “flag.”
• Bull Flag: After a sharp up-leg (pole), price drifts down or sideways within a narrow channel (flag) before breaking higher.
• Bear Flag: After a steep drop (pole), price bounces up or moves sideways in a tight channel (flag) before breaking lower.
The entry trigger is simple: wait for price to break out of the flag in the direction of the original move. For a bull flag, you’d buy once price clears the upper trendline of the consolidation.
“Think of a continuation pattern as a coiled spring. The flagpole builds the energy, then the consolidation coils it tighter—finally releasing in the same direction.”
Triangles: Coiling for a Breakout
Triangles are another classic price action pattern that signal a breather before the next big swing. In these setups, volatility tightens and buyers and sellers reach a temporary stalemate—until one side steps in and drives price out.
Here are the three main types you’ll see:
- Symmetrical Triangle: Two converging trendlines (one sloping up, one down). This is pure indecision, but more often than not it breaks in the direction of the prior trend.
- Ascending Triangle: Flat resistance on top, rising support below. It shows buyers pushing higher lows against a steady ceiling—breakouts usually punch to the upside.
- Descending Triangle: Flat support below, falling resistance above. Sellers are tightening the band on lower highs—breakouts tend to drive price downward.
By stepping in when a flag or triangle resolves, you join just as momentum kicks back in. You get a clear entry, a defined stop, and a front-row seat for the next leg of the trend.
Building a Real Trading Strategy with Patterns
That feeling when you spot a clean price action pattern forming on your chart? It's a great moment, but it's only the first step. The real skill is turning that observation into a disciplined trade with a clear, battle-tested plan.
Just identifying a pattern without a strategy is like knowing where you want to go but not having a map. Sure, you might get lucky, but you're more likely to end up lost and frustrated.
A professional trader never enters the market on a whim. Instead, they build a structured plan around every potential setup they take. This means going way beyond just seeing a pattern and defining the precise rules of engagement before a single dollar is on the line.
This is where the real work of a trader begins. For every single pattern you trade, you need to have a pre-defined plan that covers three essential pillars of execution.
The Three Pillars of Execution
A complete trading plan turns a pattern from a simple signal into a full-blown strategy. To build a robust framework, you absolutely must define your approach for entry, risk management, and taking profits ahead of time. This is how you take emotion and guesswork out of the equation.
Here are the core components you need to define:
- Entry Trigger: What specific event tells you the pattern is "live" and it's time to enter? It could be a candle closing decisively above a key resistance level or breaking the neckline of a Head and Shoulders. Never jump the gun before your trigger is hit.
- Stop-Loss Placement: Where will you get out if the trade immediately goes south? A logical stop-loss is placed at the exact point where the original reason for the trade is proven wrong. Think below a key support level or the low of the entry candle.
- Profit Target: Where will you take your money and run? This could be the next major resistance level up, or maybe a measured move based on the height of the pattern itself. Having a target stops greed from turning a great winner into a frustrating loser.
A price action pattern is a high-probability signal, not a crystal ball. Its power comes from giving you a statistical edge that, when combined with disciplined risk management, creates consistency over the long haul.
Using historical data is crucial here. It helps you see which patterns are actually reproducible and which trends have a real edge. For example, you might notice that certain moving average crossovers have historically led to strong bullish momentum on a specific asset. Looking back at the charts gives you the confidence to act when you see it happen in real-time.
Ultimately, building a comprehensive price action trading strategy is what separates the hobbyists from traders who are profitable year after year. This structured approach ensures you manage your risk like a professional and execute your plan with confidence every single time.
Common Questions About Price Action Trading
As you dive into trading price action, you're going to have questions. It's only natural. This section tackles some of the most common ones I hear from traders, giving you clear, no-fluff answers to build your confidence.
Think of it as your go-to reference for those moments when you need a quick sanity check. Getting these core ideas straight will help you trade more effectively and sidestep the easy mistakes.
Does Price Action Trading Work in All Markets?
Yes, it does, and that’s one of its greatest strengths. Price action is a direct reflection of human psychology—the endless tug-of-war between fear and greed. That behavior doesn't change just because the asset is different.
Whether you're looking at forex, stocks, crypto, or commodities, the patterns created by buyers and sellers are remarkably consistent. An exhaustion candle on a chart for oil looks a lot like one on a chart for the EUR/USD. Learning to read a price action pattern is a truly universal skill that will serve you well, no matter what you decide to trade.
Can I Use Price Action Patterns with Indicators?
Absolutely. While some traders prefer to trade with nothing but price ("naked trading"), many successful pros use indicators for an extra layer of confirmation. When different signals align, we call it confluence, and it can seriously strengthen your conviction in a trade.
For example, maybe you spot a bullish pin bar forming right at a major support level. A quick glance at an oscillator like the RSI showing oversold conditions would add weight to the idea that buyers are about to step in.
Here's the key: price leads, indicators confirm. The price action pattern is your primary signal. The indicator is just the backup. Don't ever let it be the other way around.
This keeps you focused on what the market is actually doing right now, instead of getting lost in a lagging indicator that’s just running a mathematical formula on past data.
What Are the Most Common Mistakes Traders Make?
Even with a great grasp of the patterns, new traders tend to stumble into the same old traps. Just being aware of them is half the battle.
The biggest errors almost always come down to a lack of patience or discipline.
Here are the top three mistakes to watch out for:
- Ignoring the Larger Trend: Trying to trade a small bullish pattern inside a massive, raging downtrend is a low-probability gamble. Always put the dominant market structure on your side.
- Acting Too Early: This one is huge. Traders jump into a trade before the pattern is fully confirmed. Entering a Head and Shoulders pattern before the neckline is clearly broken isn't trading—it's guessing.
- Neglecting Risk Management: This is the most dangerous mistake of all. Failing to use a proper stop-loss or risking way too much on one idea is the quickest way I know to blow up an account.
Discipline is every bit as important as your ability to spot a pattern. To sharpen these crucial skills, you can dig into these seven price action tips that work and start building them into your daily routine.
At Colibri Trader, we provide the no-nonsense guidance you need to master price action and trade with confidence. Our action-based programs are designed to transform your performance and help you achieve consistent results. Discover your trading potential with us today.