


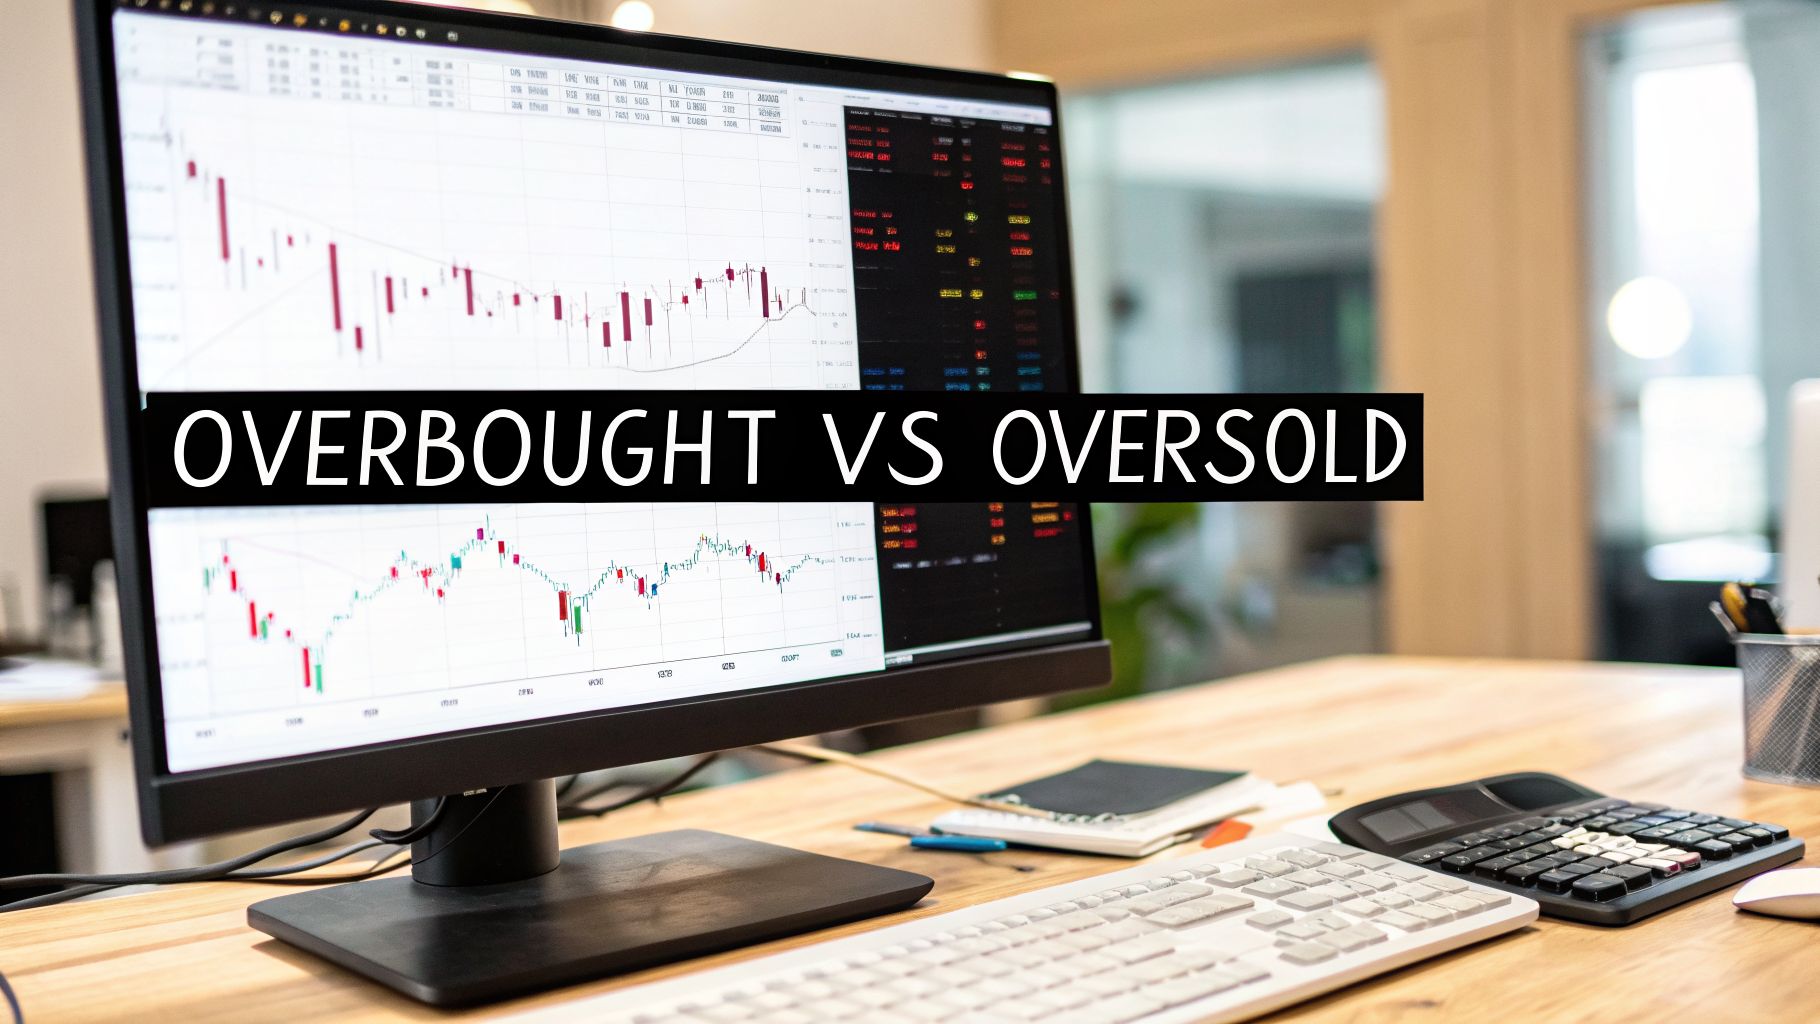
Trading Overbought vs Oversold Markets Without Indicators
The overbought vs oversold debate seems simple on the surface. An overbought market has shot up too high, too fast, and looks ready for a fall. An oversold market has dropped too far, too quickly, and seems poised for a bounce. But treating these as simple buy or sell signals is one of the biggest and most expensive mistakes you can make as a trader.
Defining the Overbought vs Oversold Dilemma

It’s a classic trap. You’re staring at a chart, and your favorite indicator is screaming "overbought." So you short it, only to watch the price climb higher and higher. The same goes for buying a market that looks "oversold." This happens because most traders are chained to lagging indicators that just tell you what has already happened.
There's a much better way to look at it: through the lens of price action. Instead of obsessing over a number spit out by an oscillator, we need to analyze how the price itself is behaving. This moves us beyond lagging tools like the Relative Strength Index (RSI) and asks a more powerful question: where are the real levels of supply and demand?
The Myth of Indicator Signals
Indicators like RSI or Stochastics use arbitrary numbers. An RSI above 70 is "overbought," and below 30 is "oversold." The problem is, a runaway trend couldn't care less about these numbers. A strong bull market can keep the RSI above 70 for weeks or even months while the price just keeps pushing higher.
The market doesn't have to do anything, least of all what you think it should do. An asset can always get more overbought, and it can always get more oversold. Relying solely on an indicator is like driving while looking only in the rearview mirror.
Think back to the 2008 financial crisis. The S&P 500 stayed deep in oversold territory for 22 straight weeks, yet it still cratered another 20% before it finally hit a bottom. On the flip side, traders who bought the extreme oversold conditions during the March 2020 crash were rewarded with massive gains. As you can see when looking at S&P 500 extremes, context is everything, and price action gives you that context.
Price Action as Your True North
A price action approach gives you a solid foundation for reading these market extremes. It teaches you to spot genuine turning points by watching the battle between buyers and sellers unfold on the chart.
Here’s a breakdown of how these concepts truly differ.
| Aspect | Overbought Condition | Oversold Condition |
|---|---|---|
| Market Psychology | Greed and euphoria are in control, pushing prices to irrational highs. | Fear and panic are in the driver's seat, forcing prices to unsustainable lows. |
| Typical Indicator Reading | RSI > 70; Stochastics > 80 | RSI < 30; Stochastics < 20 |
| Price Action Focus | Price is hitting a major supply zone where sellers are likely waiting. | Price is falling into a major demand zone where buyers might step in. |
| Common Trader Mistake | Blindly shorting the market and trying to fight a powerful uptrend. | Blindly buying the market and trying to catch a "falling knife." |
By shifting your focus from a lagging formula to the live dynamics of supply and demand, you stand a much better chance of knowing when a market is truly exhausted versus just taking a breather in a strong trend.
How to Identify Extremes With Price Action vs Indicators

When hunting for a market top or bottom, traders really have two schools of thought. The most common path is to rely on technical indicators, which do the math for you. The other, more nuanced approach, is to read the story from raw price action.
Knowing the difference between these two methods is absolutely critical for understanding what overbought vs oversold conditions are actually telling you.
The Indicator-Based Method
Indicators are purely mathematical tools. They take complex price movements and boil them down into a simple visual cue. Oscillators like the Relative Strength Index (RSI) or Stochastics are the most popular, giving you a number that supposedly signals an extreme.
The RSI, developed back in 1978 by J. Welles Wilder, is probably the most famous. It swings between 0 and 100. A reading above 70 is meant to signal an overbought market, while a drop below 30 suggests it's oversold. The Stochastic Oscillator works in a similar way, but its key levels are typically 80 and 20.
But these signals can be dangerously misleading without context. Looking at historical S&P 500 data since 1990, buying when the RSI dipped below 30 gave a positive one-month return 71% of the time, with an average gain of +4.2%. On the other hand, trying to short the market just because the RSI went above 70 only worked out 48% of the time. You can discover more about how these indicators behave in real market conditions on schwab.com.
The core weakness of indicators is that they are lagging. They are a reaction to what price has already done, not a prediction of what it will do next. A strong trend can hold an indicator in an "extreme" zone for far longer than a trader's account can handle.
The Price Action Approach
Reading price action is completely different. This is the art of reading the market's story directly from the candlestick chart. Instead of trusting a formula, you're analyzing the raw behavior of buyers and sellers to see who is losing control.
Price action traders look for specific clues that scream exhaustion:
- Trend Velocity: Is the chart going parabolic? A move that looks almost vertical is unsustainable and often marks a buying or selling climax.
- Distance from the Mean: Look at how far the price has rocketed away from a key moving average, like the 50-day MA. The further it stretches, the more likely a violent snap-back becomes.
- Climactic Volume: Do you see a massive spike in trading volume as price slams into a key level? This can be the final gasp of panic selling (oversold) or euphoric buying (overbought).
- Supply and Demand Zones: This is the most important piece of the puzzle. An overbought signal is only truly meaningful if it happens at a major historical supply zone—a level where sellers have proven they will step in with force.
Indicator-Based vs Price Action Analysis
These two approaches offer fundamentally different ways of seeing the market. One gives you a simple, calculated signal, while the other demands you interpret the context. Deciding which one to prioritize in the overbought vs oversold debate really comes down to your trading philosophy.
Here's a head-to-head comparison.
| Criterion | Indicator-Based Approach | Price Action Approach |
|---|---|---|
| Signal Source | Mathematical formula (e.g., RSI, Stochastics) | Candlestick patterns, volume, market structure |
| Nature of Signal | Lagging; confirms past momentum | Real-time; reflects current buyer/seller behavior |
| Primary Strength | Objective and easy to identify (RSI > 70) | Contextual and forward-looking (price at supply zone) |
| Key Weakness | Generates many false signals in strong trends | Subjective and requires more screen time to master |
| Best Use Case | As a secondary confirmation tool | As the primary driver for entry and exit decisions |
At the end of the day, an indicator can flash a warning light that a market is stretched, but it can’t tell you when the turning point will actually happen. That’s where price action comes in.
It provides the context needed to judge whether an overbought vs oversold reading is a genuine opportunity or just a trap in a powerful trend.
The Hidden Dangers of Trading Overbought Markets
Shorting a market just because an indicator is screaming 'overbought' is one of the fastest ways I've seen traders blow up their accounts. It’s a classic mistake, and it comes from a basic misunderstanding of how trends really work. The danger is simple: you're underestimating momentum.
A market with strong momentum can stay overbought—let’s say an RSI above 70—for way longer than you think is possible. Every time you try to short it, you take a small, painful loss. Those losses add up, bleeding your account dry while the trend just keeps pushing higher. This is what it looks like to fight the trend, and the trend almost always wins.
Why "Overbought" Does Not Mean "Sell"
An overbought reading isn't a crystal ball predicting a crash. It’s a measurement of what just happened—it tells you that buyers have been in aggressive control. In a powerful bull run, this is exactly what you should expect to see. The market is supposed to be strong.
Just look at history. During the tech bull run of 2021, the Nasdaq spent a staggering 93% of the year in an overbought state, with the daily RSI often stuck above 70. Anyone who kept shorting that signal got crushed as the index soared 43% that year. This isn't a fluke. Historical data shows that when the Nasdaq stays overbought for more than 80% of trading days, the average 12-month return is a positive 18%. To see how this plays out in real-time, you can explore detailed supply-demand analysis on Colibri Trader's YouTube channel.
An overbought indicator in a strong uptrend is not a sell signal; it's a confirmation of the trend's strength. Fighting this is like trying to stop a freight train with a fishing net.
But here's the catch—these conditions can also be the prelude to a disaster if you misread the signs. In March 2000, an extreme RSI reading above 85 on the Nasdaq came right before the historic dot-com crash, which sent the index plummeting 78% over the next two years. The indicator itself didn't tell you when to sell. That’s why price action has to be the final judge. An overbought reading on its own is just noise without context.
Reading Price Action for True Exhaustion
Instead of blindly following an indicator, a much smarter way to trade is to look for genuine signs of exhaustion right on the price chart. This moves your focus away from a lagging number and onto the real-time fight between buyers and sellers. You have to learn the difference between a healthy trend and one that's truly running out of gas.
Here’s what I look for to confirm a potential top:
- Arrival at a Supply Zone: An overbought reading only gets my attention when it happens at a major, historically proven supply zone. This is a price level where sellers have shown up in force before.
- Bearish Confirmation Patterns: Don’t even think about acting until you see a clear bearish reversal pattern form inside that supply zone. This could be a powerful bearish engulfing candle, a pin bar with a long upper wick, or a clean double top.
- A Break in Market Structure: The final confirmation is a clear break in the uptrend's structure. This happens when the price fails to make a new higher high and instead prints a lower low, telling you that sellers have finally wrestled control away from buyers.
By waiting for these price action clues, you stop gambling on an indicator and start trading based on real evidence. The debate over overbought vs oversold gets a lot clearer when you realize the indicator is just one small piece of a much bigger puzzle. The price itself will tell you when the tide is actually turning.
Finding High-Probability Buys in Oversold Markets
Just as many traders get burned shorting an overbought market, even more lose their shirts trying to "catch a falling knife" when things look oversold. Buying an asset just because it seems cheap after a steep nosedive is a recipe for disaster, especially during a market panic.
The price can always go lower. An oversold reading on your favorite indicator offers very little protection on its own.
Strong downtrends can keep pushing an asset deeper and deeper into oversold territory, turning every premature buy into another losing trade. The key isn't to guess where the bottom is. It's to wait for the market itself to show you the selling pressure is finally over. This requires patience and a solid, price-action-first approach.
Avoiding the Falling Knife Trap
The temptation to buy at a perceived discount is strong, but it's a classic psychological trap. When fear is in the driver's seat, rational thinking goes straight out the window. An oversold reading from an indicator like the RSI or Stochastics simply tells you that price has fallen fast—it doesn't mean the fall is finished.
There's an old market saying: "The air comes out of the balloon faster than it goes in." It perfectly captures the violent speed of a sell-off. Trying to buy based on an oversold signal alone is like stepping in front of a freight train—it’s going to be painful, and it rarely works.
Instead of gambling on a bottom, the professional trader waits for hard evidence that the sellers have run out of steam. This simple shift from reacting to patiently observing is what separates the consistently profitable from the crowd. Your job is to figure out where the smart money is likely to start buying and then wait for them to prove it.
The Three-Step Framework for Buying an Oversold Market
To buy with confidence in an oversold market, you need a clear, repeatable framework that’s built on price action, not lagging indicators. This process helps you pinpoint the exact moment the odds shift in your favor, letting you enter with conviction while everyone else is still panicking.
Wait for Price to Reach a Clear Demand Zone: The first step is all about patience. Your entire focus should be on finding a significant, historically proven demand zone on your chart. These are the areas where buyers have shown up in the past with enough force to turn a downtrend around. An oversold reading only becomes meaningful when it happens at one of these critical levels. You can get better at spotting these key areas by mastering supply and demand zones.
Spot Price Stabilization: Once the price hits your demand zone, don't jump the gun. Instead, watch for signs that the selling momentum is fading. This often looks like a series of smaller bearish candles, indecisive doji candles, or just a general sideways grind. This stabilization is your cue that sellers are losing their nerve and buyers are starting to soak up the pressure.
Confirm the Turn with a Bullish Reversal Pattern: This is the final, and most important, step. You need a clear, undeniable price action signal that buyers have officially taken back control. This confirmation might be a powerful bullish engulfing candle, a pin bar with a long lower wick, or a double bottom pattern forming right on your demand level.
This three-step process is the foundation for telling a true market bottom apart from just another breather in a brutal downtrend. When you're trying to decide between an overbought vs oversold condition, this framework makes sure you're trading based on evidence, not emotion. It’s all about letting the market show its hand before you put your money on the table.
A Price Action Playbook for Trading Market Extremes
Theory is one thing, but a solid, repeatable trading plan is where profits are actually made. In this section, I'm going to walk you through a step-by-step playbook for trading reversals in both overbought and oversold markets using pure price action. Let's put the indicators aside for a moment and focus on reading the story the chart is telling us.
I'll lay out the specific rules of engagement for both long and short setups. This covers everything from your entry trigger to where you place your stop-loss and take profits. The goal is to give you a process you can use over and over again to trade market extremes with confidence.
The Playbook for Shorting an Overbought Market
Trying to short a market that's rocketing higher is one of the riskiest plays a trader can make. But with a clear set of rules, you can learn to spot high-probability reversals. The key isn't to guess the absolute top; it's to react when you see confirmed weakness.
Step-by-Step Short Setup:
- Identify a Major Supply Zone: First, you have to find a historically important area of resistance where sellers have shut down rallies in the past. This zone needs to be obvious on a higher timeframe, like the daily or 4-hour chart. An overbought signal means nothing without a strong supply zone to back it up.
- Wait for Price to Enter the Zone: Now, you need patience. Let the market push up into your zone. Don't do anything yet. Aggressive buying often loses steam right at these major levels.
- Confirm with a Bearish Reversal Candle: This is your trigger. You are looking for a powerful bearish candlestick pattern to form inside that supply zone. Classic signals include a bearish engulfing candle, a shooting star, or even a clear double top. This is your signal that sellers are finally taking back control.
A huge mistake I see traders make is shorting the second price touches a supply zone. You have to wait for confirmation. That reversal candle is your proof that the tide is turning in your favor. It turns a wild guess into a calculated trade.
Once that confirmation candle closes, you can execute the trade with a clear plan.
- Entry: Enter your short position as soon as the confirming bearish candle closes.
- Stop-Loss: Place your stop-loss just above the high of the supply zone or the high of the reversal candle—whichever is higher. This locks in your risk from the start.
- Profit Target: Set your first target at the next significant area of demand (support) below your entry. This ensures you have a healthy risk-to-reward ratio before you even enter the trade.
The Playbook for Buying an Oversold Market
Buying a market that's in freefall can feel like trying to catch a falling knife. This playbook is designed to make sure you don't get cut by only entering when you have real evidence that the sellers are exhausted.
This simple, three-step process for finding a high-probability buy in an oversold market is laid out in the infographic below.

It’s all about a patient, evidence-based approach: wait for the right location, look for signs that the selling is slowing down, and only pull the trigger on a clear confirmation signal.
Step-by-Step Long Setup:
- Identify a Major Demand Zone: Just like shorting, the first job is to pinpoint a strong, historical demand zone where buyers have shown up in force before. This is your hunting ground.
- Wait for Price to Test the Zone: Let the market drop into your pre-marked zone. Now, watch how price acts. Is the selling momentum fading? Are the candles getting smaller? This price stabilization is a critical clue.
- Confirm with a Bullish Reversal Candle: This is your green light to act. You must wait for a decisive bullish candlestick pattern to print at the demand zone. Keep an eye out for a bullish engulfing candle, a hammer, or a clean double bottom.
With these rules, you're no longer guessing where the bottom is. Instead, you're trading a confirmed shift in momentum. Learning to trade this way forces you to focus on what the market is actually doing, and you can read our complete guide on trading without indicators to really master this skill.
Once you see your confirmation candle, your plan becomes simple.
- Entry: Go long at the close of the confirming bullish candle.
- Stop-Loss: Set your stop-loss just below the low of the demand zone or the low of the reversal candle.
- Profit Target: Your target should be the next major supply zone above your entry, which should give you a great risk-to-reward setup.
This playbook for trading the overbought vs oversold dynamic takes the emotion and guesswork out of the equation. It replaces them with a structured, repeatable process.
Advanced Confirmation and Risk Management Strategies
Finding your edge when trading overbought vs oversold markets comes down to more than just spotting a potential setup. That's the easy part. The real work is layering on extra confirmation and applying rock-solid risk management.
When you’re trading against the recent momentum, you have to be extra careful. This is where you protect your capital with rules that you simply never break.
One of the most powerful confirmation techniques I use is looking for divergence. This is when you see the price make a new high, but your momentum indicator, like an RSI, makes a lower high.
This disagreement is a huge clue. It tells you the power behind the move is fading, even if the price is still inching up. Think of it as the first warning sign that an uptrend is getting tired. Just remember, divergence is a confirmation tool, not a reason to jump into a trade all by itself.
Building Your Risk Management Fortress
Your success as a trader won't come from finding a handful of perfect entries. It’s built on how well you protect your account when a trade inevitably goes wrong. Fading a strong trend by trading overbought or oversold conditions requires an even higher level of discipline.
Before you even think about hitting the buy or sell button, you must know your risk-to-reward ratio. What does that mean? It means you know exactly where your stop-loss will go and where your first profit target is. As a bare minimum, I look for a 1:2 risk-to-reward ratio. For every dollar I'm willing to risk, I need to see the potential to make at least two.
I've seen it a thousand times: a great strategy falls apart because of poor discipline. Your risk management rules are the only thing standing between your goals and blowing up your account.
Once you have your plan locked in, it's time to manage the trade itself.
Practical Rules for Managing Your Trades
Putting on a trade is just the beginning of the job. How you manage it from there is what helps you lock in gains and cut your risk.
Here are three simple but essential rules I follow for managing trades based on overbought vs oversold signals:
- Precise Position Sizing: I never risk more than 1-2% of my trading account on any single trade. This is non-negotiable. It ensures that a single loss, or even a string of them, can't take me out of the game.
- Move to Break-Even: Once a trade moves in my favor by a decent amount (usually a distance equal to my initial risk), I immediately move my stop-loss to my entry price. Just like that, it becomes a risk-free trade.
- Use Trailing Stops: As the trade continues to go my way, I'll use a trailing stop to protect my open profits. You can do this manually by moving your stop just below recent swing lows in an uptrend or just above swing highs in a downtrend.
Combining these tactics gives you a strong defensive system. If you want to get even sharper with your entries and exits, I highly recommend our detailed guide on how to properly set your stop-loss and take-profit levels. This level of discipline is what turns trading from a pure gamble into a calculated business.
Frequently Asked Questions
I get a lot of questions from traders trying to make sense of overbought and oversold readings. Let's tackle a few of the most common ones I hear, which really get back to the core ideas of price action trading.
How Long Can a Market Stay Overbought or Oversold?
This is the million-dollar question for indicator-based traders. The hard truth? A market can stay "overbought" or "oversold" for days, weeks, or even months. This happens all the time in powerful, trending markets.
It's precisely why trying to pick a top or bottom based only on an indicator reading is a quick way to empty your account. A better question to ask isn't "how long," but "what is the price telling me?" Your job is to wait patiently for the market structure itself to break, signaling a real shift in power.
Is RSI or Stochastics Better for Finding Extremes?
Honestly, neither is "better." It's like asking which of two broken clocks is more accurate. Both RSI and Stochastics are lagging indicators that just repackage old price data. They tell you about past momentum, not what the market intends to do next.
Sure, Stochastics is a bit faster and RSI is smoother, but they both have the same fatal flaw: they operate without any real market context.
The real game-changer isn't picking one flawed indicator over another; it's learning to trade without them. When you focus on supply and demand, you're identifying the actual zones where big money is most likely to step in and move the price. That's a forward-looking approach.
An indicator might give you a nudge, but the price chart tells the entire story.
What Is the Most Important Rule for Trading Reversals?
If you only remember one thing, let it be this: confirmation. I cannot stress this enough. Never, ever jump into a trade just because the price has touched a line on your chart that you've decided is an "extreme" level.
You have to wait for the market to prove you right. Wait for a clear, powerful price action signal to form right in your zone—something like a strong reversal candlestick pattern. Patience is your biggest edge here. Let the market show its hand before you put your capital on the line. Acting without confirmation isn't trading; it's just gambling.
At Colibri Trader, we teach you to trade with your eyes, not with lagging indicators. Our programs are designed to transform your trading by focusing on the proven principles of price action, supply, and demand. Take our free Trading Potential Quiz to start your journey today.