


Mastering the Opening Range Breakout Trading Strategy
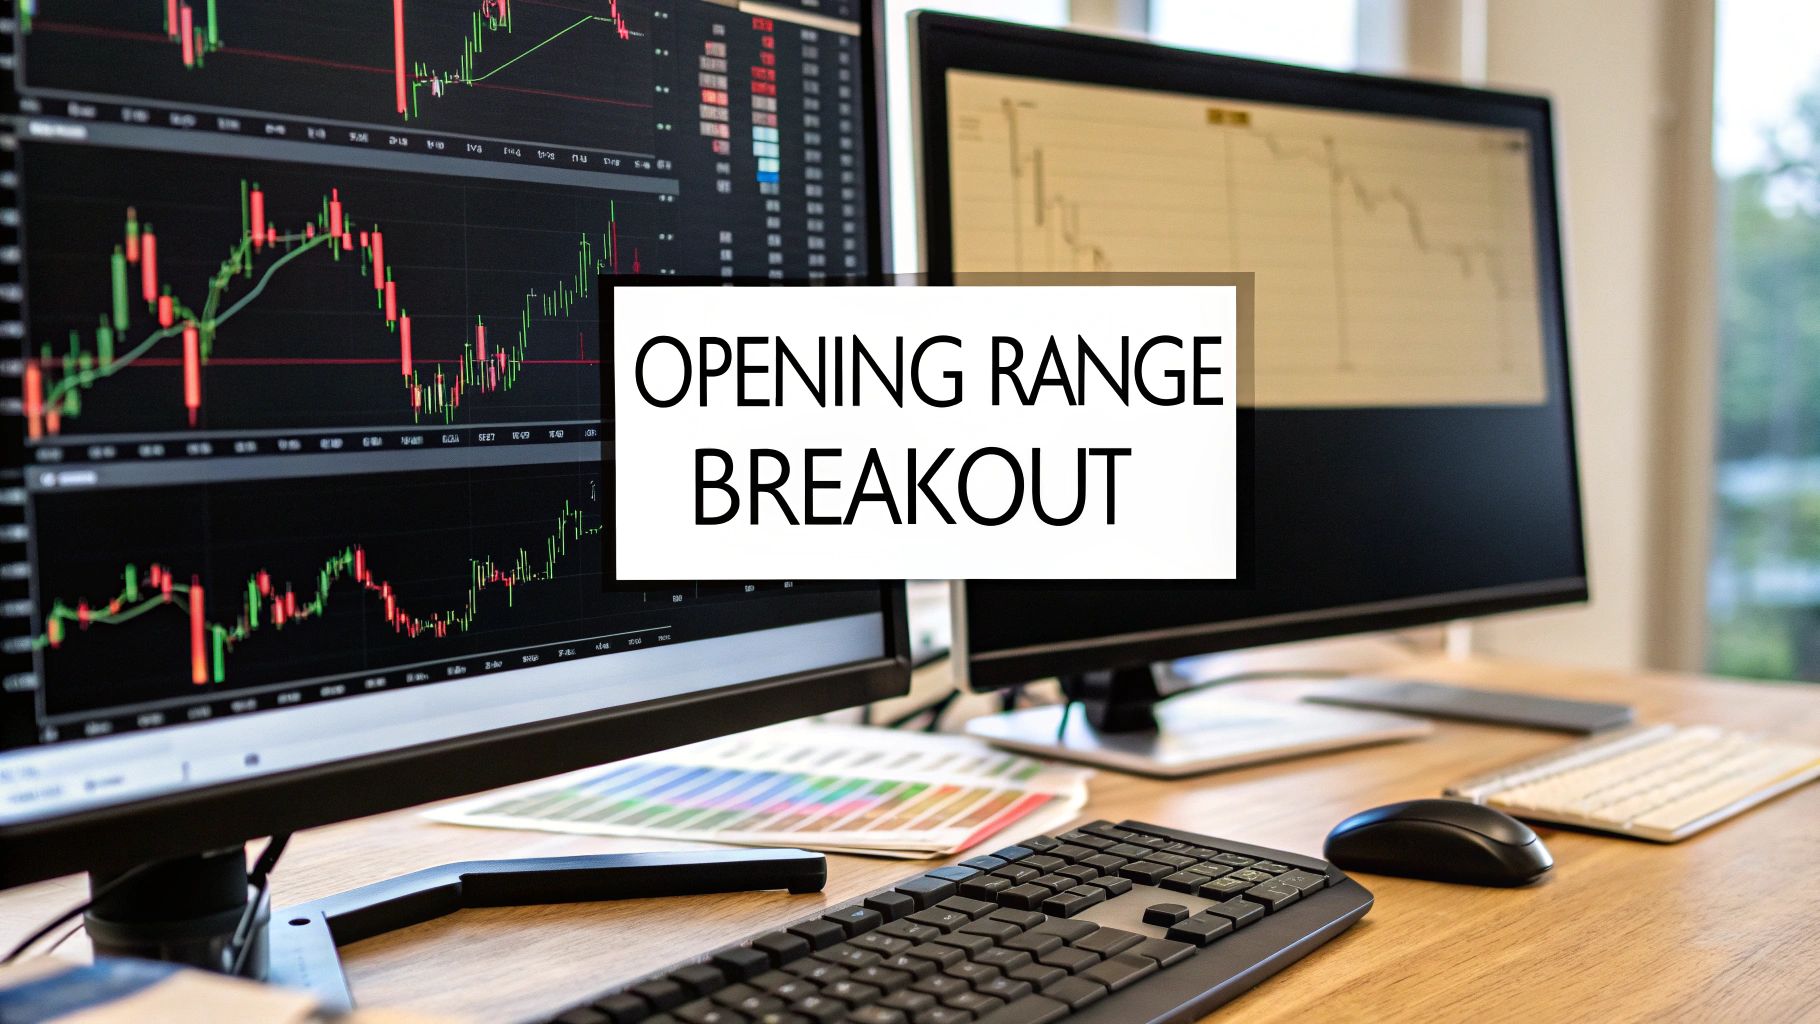
The opening range breakout is a classic day trading strategy that zeroes in on the day's very first directional move. It's a simple but powerful idea: you identify the high and low of a specific initial period—say, the first 30 minutes—and then trade the breakout when the price finally picks a direction and moves beyond that range.
Understanding the Opening Range Breakout
At its heart, the opening range breakout (ORB) is a pure price action and momentum play. The first few minutes after the opening bell are often the most chaotic and volatile of the entire day. This is when a flood of orders hits the market—reactions to overnight news, big institutions adjusting their books, and eager retail traders all jumping in at once.
This initial burst of activity carves out a very clear high and low, creating what we call the "opening range."
Think of this range as the day's first battleground. It's a visual tug-of-war between buyers and sellers. The high of that range establishes the first real level of supply, while the low marks the initial line in the sand for demand.
A decisive break from this zone is a powerful signal. When the price punches through the opening range high, it tells us that buyers have wrestled control from the sellers. On the flip side, a break below the low suggests the sellers have won the first round. This initial victory often sets the bias and potential trend for the rest of the trading session.
The Psychology Behind the Breakout
So, why does this simple pattern work so well? It’s all about market psychology and order flow in real-time. That opening range encapsulates the collective decisions of thousands of market participants all reacting to the same thing: the open. A breakout isn't just a blip on the chart; it represents an early consensus.
Big institutional players, the ones moving serious volume, often use this initial period to build their positions for the day. Their large orders can provide the fuel needed to shove the price past the high or low. Once that breakout happens, it often sets off a chain reaction:
- Stops Get Triggered: Traders who tried to fade the move (like shorting near the range high) have their stop-loss orders sitting just above it. When those are hit, it adds buying pressure and fuels the breakout.
- Momentum Traders Pile On: Breakout traders who were waiting on the sidelines for a clear signal now have one. They jump in, adding to the momentum.
- FOMO Kicks In: Other traders see the strong directional move and, fearing they'll miss out, join the party, pushing the trend even further.
The real beauty of the opening range breakout is its raw simplicity. It cuts through the noise of lagging indicators and forces you to focus on the purest elements of trading: supply and demand. It gives you a clean, objective framework to read the market's initial sentiment.
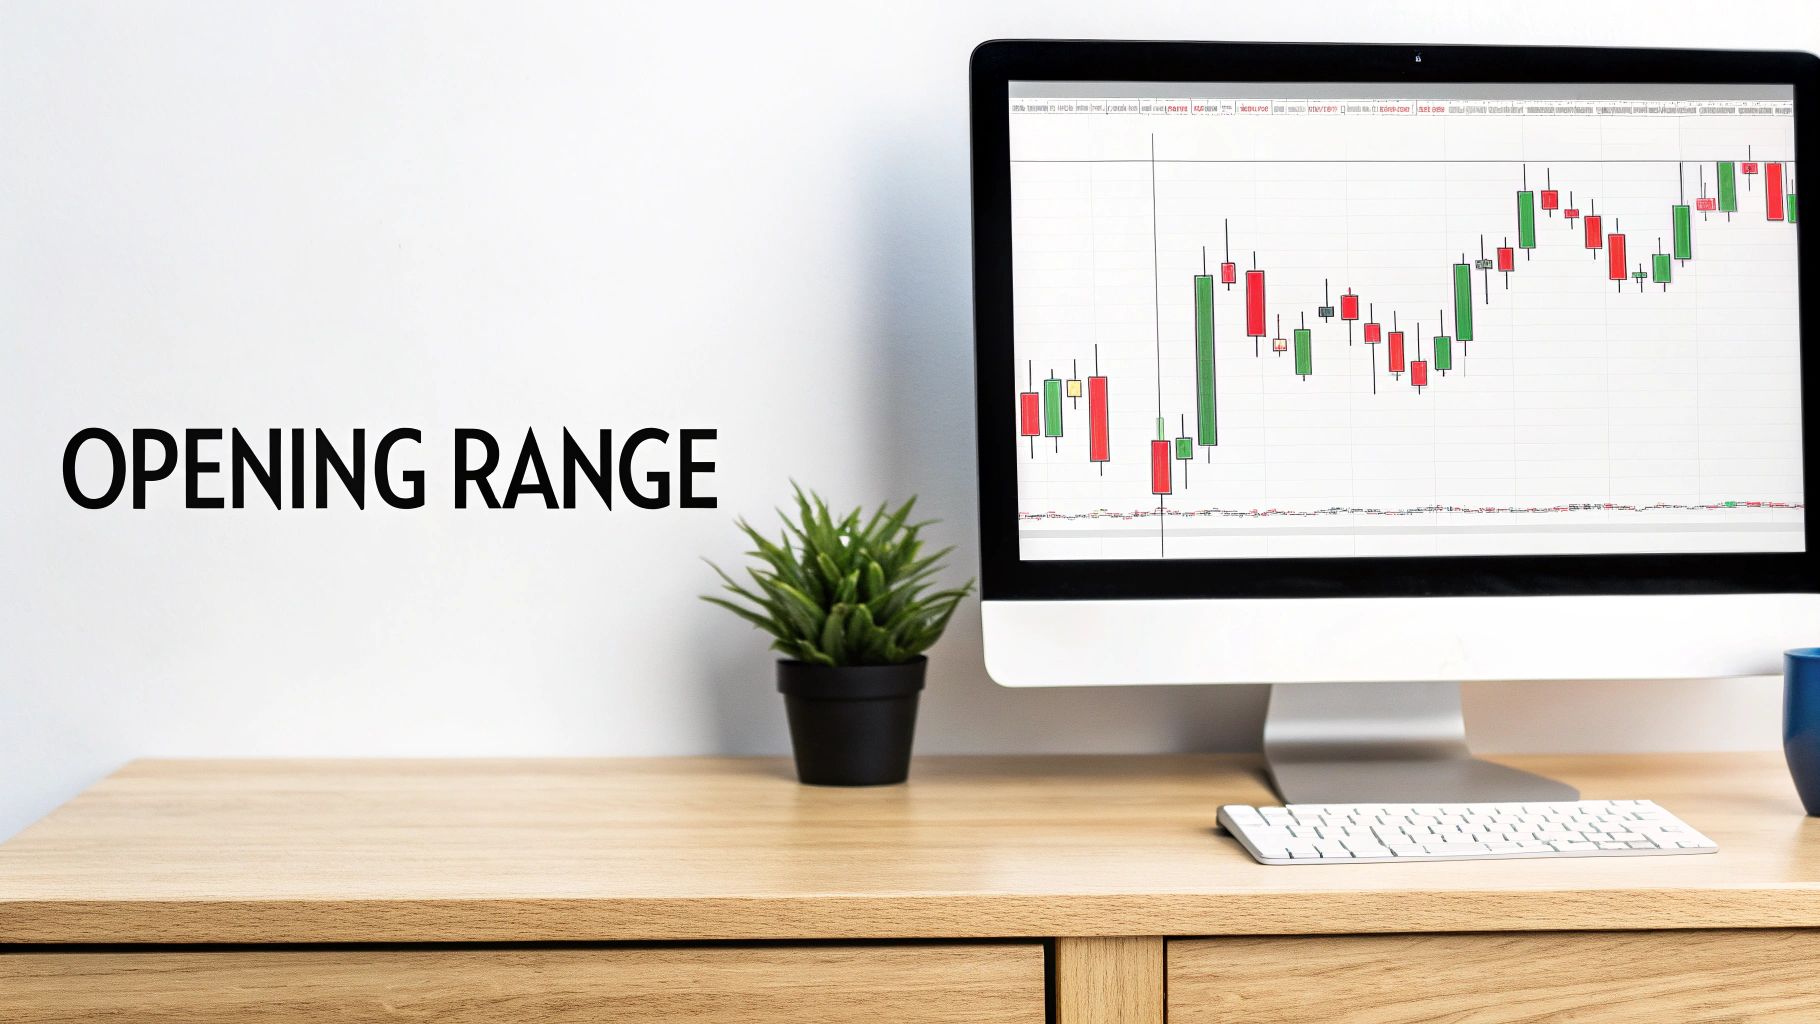
Defining Your Core ORB Components
To trade this strategy effectively, you need a crystal-clear definition of what you're looking for. The "opening range" itself is simply the high and low of a set period, which could be the first 5, 15, 30, or even 60 minutes of the session.
To help solidify this, here's a quick breakdown of the core components that make up a valid ORB setup.
Core Components of the Opening Range Breakout
| Component | Description | What It Reveals in Price Action |
|---|---|---|
| The Time Window | The specific period after the market opens used to define the range (e.g., first 30 minutes). | Captures the initial wave of institutional and retail order flow. |
| Opening Range High | The highest price traded during the defined time window. | Establishes the session's first key supply or resistance level. |
| Opening Range Low | The lowest price traded during the defined time window. | Establishes the session's first key demand or support level. |
| The Breakout | A decisive candle close above the high or below the low of the range. | Signals a shift in control from sellers to buyers (or vice versa). |
Understanding these four elements is the foundation of the entire strategy. It provides a clear map for the day's potential journey, drawn directly from the morning's first few candles.
For traders who follow my work, you'll see how perfectly this aligns with a minimalist, price-action-focused approach. It avoids the clutter of indicators and gets right to the heart of what's moving the market. To explore these core concepts in more detail, our guide on supply and demand trading strategies offers a deeper perspective that complements the ORB perfectly.
Why the Opening Range Breakout Has a Statistical Edge
Any trader worth their salt knows you can't build a career on a strategy that just "feels right." You need proof. You need an edge. The opening range breakout isn't just some random pattern that looks good on a chart; it's a market tendency backed by hard data. This is what gives us the confidence to trade it day in and day out.
The edge is actually pretty simple when you think about it. Instead of trying to guess where the market will top or bottom, the ORB waits for the market to show its hand. That first burst of activity often reveals the path of least resistance for the rest of the day, driven by the big players placing their bets.
Putting Numbers to the Theory
Talk is cheap, so let's look at the data. A good strategy doesn't just make money; it makes money with manageable risk and smooth returns.
A deep-dive study by QuantConnect tested the ORB across a thousand liquid US stocks that were seeing heavy volume. They found the 5-minute opening range was the sweet spot. The result? A stunning Sharpe ratio of 2.396.
To put that in perspective, simply buying and holding the SPY over the same period would have given you a Sharpe ratio of just 0.836. The data paints a very clear picture of superior risk-adjusted returns. You can dig into more of the statistical findings on Edgeful.com if you're interested.
Even more telling was the strategy's beta: a tiny -0.042. That’s a critical number. It means the strategy's performance had almost zero correlation to the broader market. It wasn't just riding a bull market wave; it was generating its own alpha. That makes it an incredible tool for diversification.
The statistical edge of the opening range breakout comes from one simple thing: it isolates and acts on the day's most committed momentum. This often leads to strong, risk-adjusted returns that are independent of the overall market's direction.
What Makes It Statistically Sound?
So, why does this work so consistently? The ORB isn't magic. It's built on repeatable market dynamics that we see almost every single day.
A few key factors are at play:
- Following the "Smart Money": That opening bell is when the big institutions—the hedge funds, the pension funds—are establishing their positions for the day. The ORB is our way of piggybacking on their high-volume moves.
- The Momentum Snowball: A clean breakout acts like a trigger. It hits the stop losses of traders on the wrong side, pulls in other breakout traders, and then attracts the FOMO crowd. This cascade creates a self-fulfilling prophecy that can power a trend for hours.
- A Crystal-Clear "I'm Wrong" Signal: This is huge. With an ORB, you know exactly when the trade idea is busted. If the price breaks out and then smacks right back down into the range, your hypothesis is invalidated. It's a built-in mechanism for tight risk control.
When you put all this together, you realize you're not just trading a pattern. You're trading a quantifiable, recurring market event. The goal isn't to win every trade, but to deploy a strategy where the odds are stacked in your favor over the long run. Understanding this statistical backbone is what allows you to trade with the conviction and discipline required to succeed.
Building Your Actionable ORB Trading Plan
Okay, we've covered the "why" behind the opening range breakout. Now it's time to get our hands dirty with the "how." A good idea isn't enough; you need a detailed, repeatable plan that takes the emotion and guesswork out of the equation. This is your blueprint for creating a complete trading plan, from spotting the perfect setup to managing the trade like a pro.
This isn't about memorizing rigid rules. It's about building a disciplined framework so that every trade follows a logical process. The goal is simple: act on high-probability signals and protect your capital at all costs. This is where we put that statistical edge we talked about into practice.
This flowchart gives you a snapshot of the key metrics that form the statistical foundation of a well-executed ORB strategy.
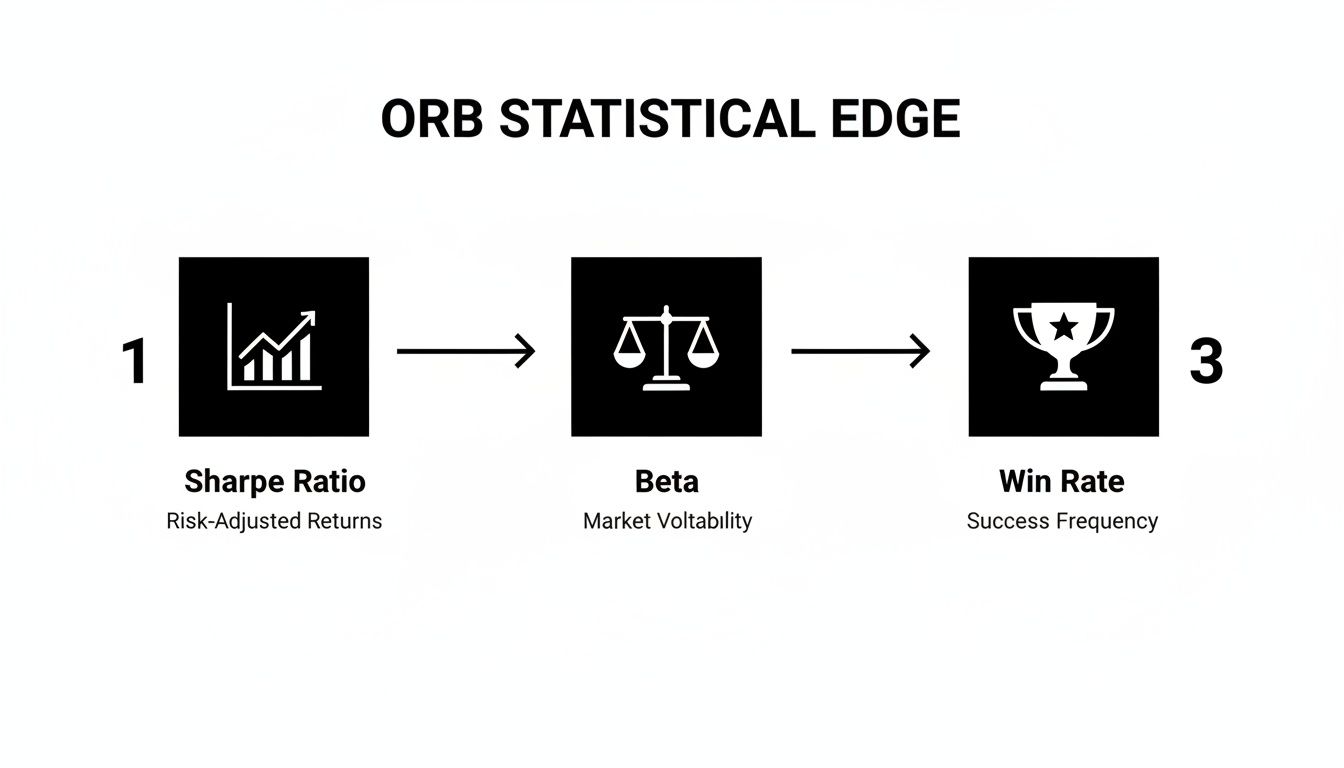
When you see a strong Sharpe Ratio, low Beta, and a healthy Win Rate, it tells you the strategy has the potential for consistent, risk-adjusted returns that aren't just tied to what the broader market is doing.
Defining Your Setup Criteria
The work starts long before the opening bell. Seriously, the quality of your trading day is often decided by the quality of your prep. The job here is to sift through the entire market and narrow it down to a handful of prime candidates for an opening range breakout.
Your watchlist needs to be focused on stocks that have a catalyst. Think news-driven movers—earnings reports, major product announcements, or big industry shifts. High pre-market volume is an absolute must. It's the clearest sign of institutional interest and gives you the liquidity you need for clean, decisive breakouts.
Next, you have to decide on your opening range window. This can vary, but most day traders I know find their sweet spot with one of these intervals:
- The first 15 minutes: This is a nice, balanced approach. It filters out some of that initial chaotic noise but is still early enough to catch the main momentum push.
- The first 30 minutes: A more conservative choice. It gives the market more time to establish a wider, and often more reliable, support and resistance zone for the morning.
- The first 60 minutes: This is best for slower-moving stocks or on those wild, high-volatility days where you need more time for a real consensus to form.
Once the market opens and your chosen time window is up, you mark the high and low of that period on your chart. These two levels are now your battlefield.
Pinpointing Precise Entry Triggers
Here’s where a lot of new traders get into trouble. They see the price poke its head above the range and they jump in. That’s a fantastic way to get caught in "false breakouts" or "head fakes." A professional waits for confirmation.
Your main entry trigger should be a full candle body closing outside of the range. For a long trade, you need to see a solid bullish candle close decisively above the opening range high. For a short, you want a bearish candle to close firmly below the opening range low. This proves that momentum is actually holding, not just a momentary spike.
Volume is your secondary, but equally vital, confirmation tool. A real breakout has to be backed by a clear surge in volume. This is the market showing its hand, telling you that other participants have conviction and that big money is likely behind the move. A breakout on weak, pathetic-looking volume is a massive red flag and usually a trade you should just walk away from.
A breakout without volume is just a price change. A breakout with volume is a statement of intent from the market. Wait for the statement.
Setting Your Stop Loss and Managing Risk
No trading plan is worth the paper it's written on without a rock-solid risk management strategy. Your stop loss is your safety net; it defines the absolute maximum you're willing to lose on a trade. For the opening range breakout, the logic is beautifully simple and powerful.
The most effective place for your stop is just inside the opposite side of the range. It’s that straightforward.
- For a long trade (breakout above the high): Your stop loss sits just below the opening range low.
- For a short trade (breakdown below the low): Your stop loss goes just above the opening range high.
This makes perfect sense from a price action point of view. The entire trade is based on the idea that the market has picked a direction out of that initial range. If the price does a complete 180 and smashes through the other side, your trade thesis is clearly wrong. Time to get out with a small, manageable loss and live to trade another day. For a deeper dive, our guide on how to correctly set a stop loss and take profit offers more context that fits perfectly here.
Planning Your Trade Management and Exits
Getting into a winning trade is only half the battle. How you manage it from there is what separates the consistently profitable traders from everyone else. The goal is to lock in profits while still giving the trade enough room to potentially turn into a huge winner.
A proven way to do this is with risk multiples, or "R-multiples." "R" is just your initial risk—the distance from your entry to your stop loss.
A practical exit plan might look something like this:
- Take Partial Profits at 1R: When the price hits a profit target equal to your initial risk, sell a piece of your position (maybe 1/3 or 1/2). This effectively pays for the trade, turning the rest into a "risk-free" position.
- Move Stop Loss to Breakeven: Right after taking that first profit, slide your stop loss up to your original entry price. Now, the absolute worst thing that can happen is you get out with no loss.
- Trail Your Stop for Further Gains: With the rest of your position, use a trailing stop to ride the trend. You could trail it under a key moving average (like the 20 EMA on a 5-minute chart) or just below the low of the previous candle.
This kind of structured approach forces you to consistently bank profits, protect your capital, and still be in the game for those massive trending moves that make the opening range breakout such a powerful strategy.
How to Adapt the ORB for Different Markets
One of the biggest mistakes traders make is applying the opening range breakout like a cookie-cutter system. Let’s get one thing straight: a strategy is only as good as its application. The exact parameters that deliver incredible results on a volatile tech stock can just as easily bleed your account dry on a major index future. True mastery isn't about finding a magic formula; it's about learning to adapt the ORB to the unique personality of whatever you're trading.
The most critical variable you have control over is the duration of the opening range itself. A shorter range, say 5 or 15 minutes, is built for speed. It’s designed to be highly responsive and capture those explosive, high-momentum moves right out of the gate. This makes it a perfect fit for individual stocks that are gapping up or down on a major news catalyst.
When a stock has a clear story behind it, you see a flood of directional interest at the open. A short range gets you into the day's primary trend before that initial burst of energy starts to fade. The trade-off, of course, is that this agility makes you more vulnerable to market noise and head-fakes.
Adjusting for Index and Options Trading
On the flip side, when you're trading broader market indices like the SPX or QQQ, a longer opening range is often your best friend. This is especially true if you’re trading derivatives like 0DTE (zero days to expiration) options. A major index is a blend of hundreds of individual stocks, so its initial moves aren't about a single story but about the market finding its footing and establishing a broad consensus.
Using a 30 or even a 60-minute range for these markets helps you filter out the chaotic, knee-jerk reactions that dominate the first few minutes of trading. It gives the market time to digest any overnight news and carve out a more stable, meaningful high and low for the session. When a breakout finally occurs from this wider range, it carries a lot more weight and suggests a more sustainable directional move is underway. As you tweak your ORB approach, understanding concepts like implied volatility in options becomes incredibly valuable.
The goal isn't to find the "perfect" time frame but the appropriate one. For fast-moving stocks with a story, think short and aggressive. For broad, slower-moving indices, think longer and more deliberate.
This distinction becomes absolutely critical for options traders. For example, backtesting on 0DTE options has shown that longer opening ranges can produce wildly different outcomes. One study showed a 60-minute ORB strategy on index options generated a total profit of $30,708 with an 88.8% win rate and a max drawdown of just -$3,231.
But when the same strategy was tested with a 30-minute ORB, the profit dropped to $19,555 while the maximum drawdown ballooned to a painful -$8,306. The data speaks for itself.
To better illustrate how these choices play out, let's compare the two approaches.
Comparing ORB Duration for Stocks vs Index Options
The following table gives a comparative look at how the duration of the opening range can impact strategy performance across different asset classes. Notice how the ideal setup shifts based on the instrument's underlying characteristics.
| Parameter | High-Volatility Stocks | Index Options (0DTE) |
|---|---|---|
| Typical Range | 5-15 Minutes | 30-60+ Minutes |
| Goal | Capture initial, high-velocity momentum from a catalyst. | Filter out opening noise and trade the established daily bias. |
| Pros | Early entry on the day's primary trend. | Higher probability of valid breakouts, less susceptible to noise. |
| Cons | More prone to false breakouts and whipsaws. | Later entry, potentially missing the day's most explosive move. |
| Best Suited For | News-driven movers, earnings gaps, high beta names. | SPX, QQQ, and other broad market indices. |
This comparison highlights why a one-size-fits-all approach is a recipe for frustration. What works for a momentum stock is often the opposite of what an index options strategy requires.
Finding the Right Fit for Your Market
So, how do you make the right call? It starts with analyzing the typical behavior of the asset you want to trade.
- Volatility and ATR: Is the stock known for wild swings right at the open, or does it tend to be a slow grinder? Assets with a higher Average True Range (ATR) might need a wider range just to avoid getting stopped out by normal, everyday price fluctuations.
- Liquidity: Highly liquid instruments can handle the order flow of a clean, powerful breakout from a shorter range. We cover this in more detail in our guide on what is market liquidity and its importance.
- Catalysts: Is the stock "in play" because of a specific event? If so, a shorter range helps you capitalize on that urgency. If it's just another Tuesday with no major news, a longer, more patient range is likely the smarter choice.
Ultimately, your decision has to be backed by data. Systematically backtest and forward-test different range durations on the markets you trade. Track the results meticulously in a journal. The numbers will tell you which parameters give you a statistical edge for that specific instrument, turning a generic strategy into your own personalized trading weapon.
Common ORB Trading Mistakes to Avoid
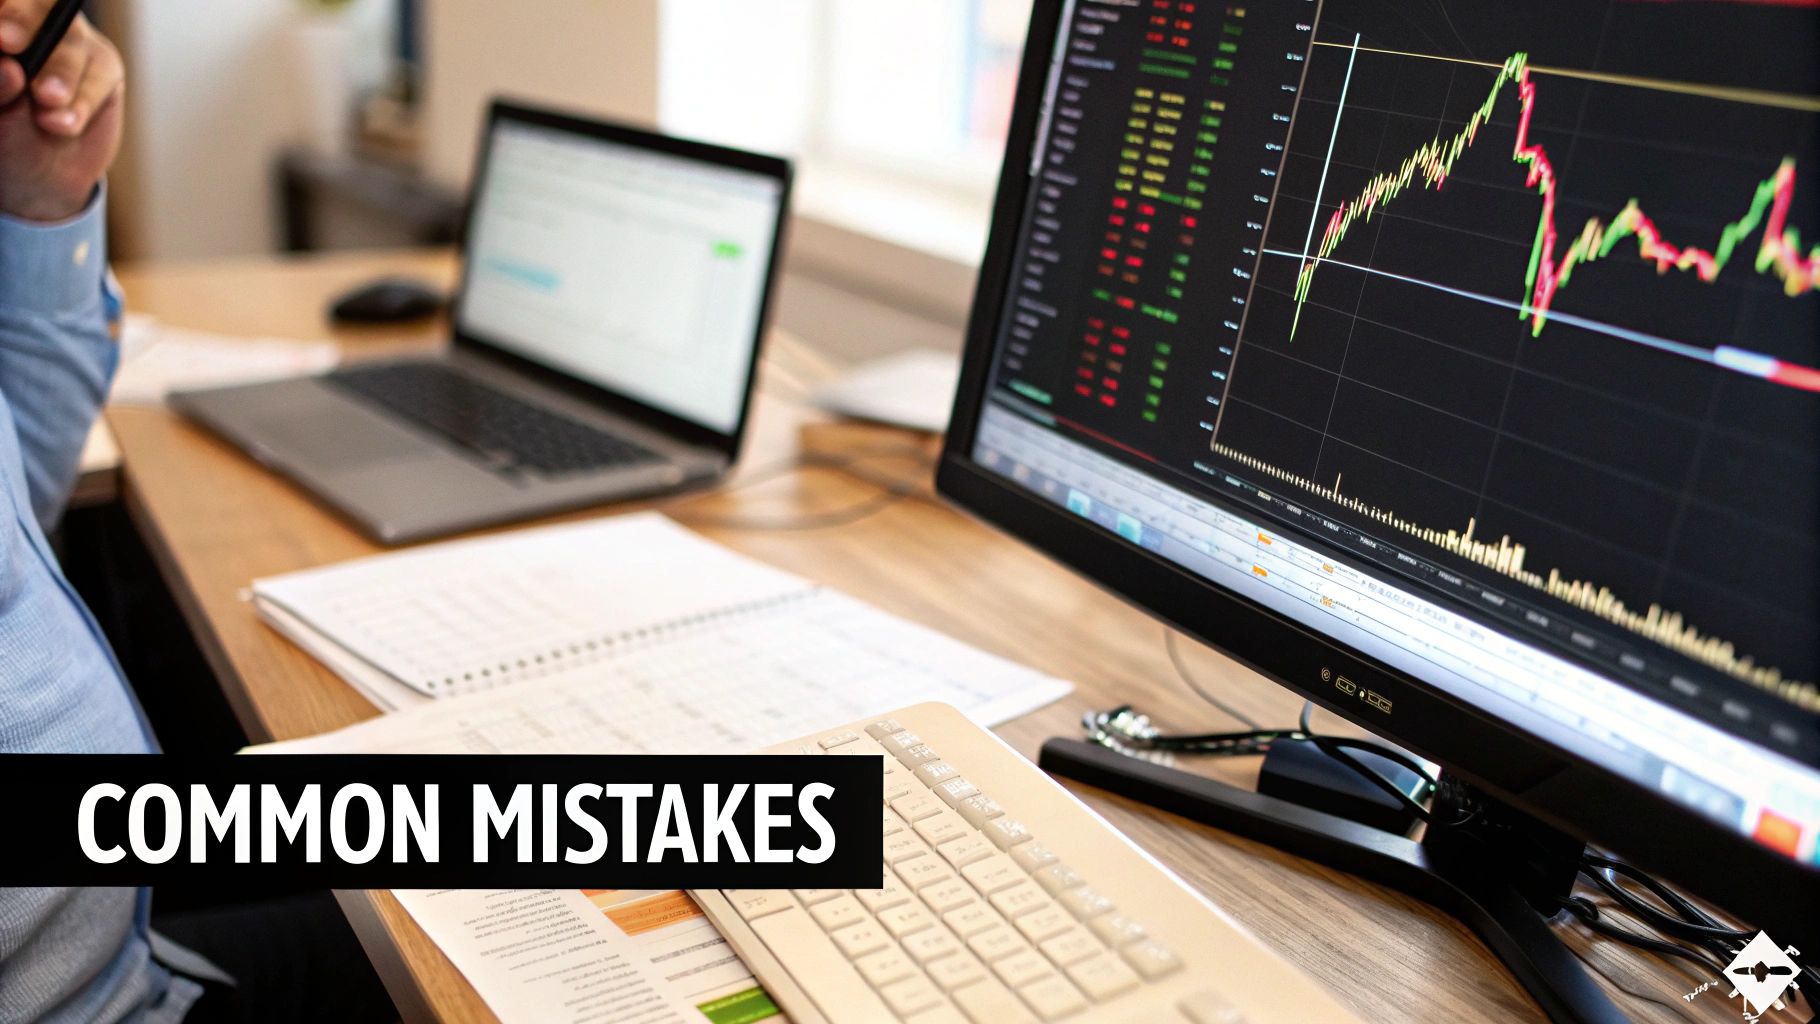
Knowing the rules of the opening range breakout is one thing, but actually executing it flawlessly under pressure? That's a completely different skill. I've seen countless traders understand the concept in theory, only to fall into the same common psychological and technical traps that sabotage their results.
Mastering this strategy means learning to spot these pitfalls before they drain your account. These aren't random errors; they're predictable mistakes born from impatience, fear, and a simple lack of discipline. The good news is, once you're aware of them, you can build a plan to turn these weaknesses into strengths and find the consistency you're looking for.
Chasing Extended Breakouts
This is probably the most damaging mistake I see: chasing the price. It happens when you miss the initial clean breakout. FOMO kicks in, you see the price running away without you, and you jump in far from the original entry point.
By then, the risk-to-reward ratio is completely wrecked. Your stop loss, which should be tucked just on the other side of the range, is now miles away. You're forced to take on massive risk for a tiny potential gain. It's a losing proposition from the start.
The price-action solution is simple, but not easy: patience. If you miss the move, you miss the move. Don't chase it. Instead, wait and see if you get a pullback or a retest of the breakout level. A clean retest often gives you a much safer, higher-probability second chance to get in with a tightly defined risk.
A missed trade is just a missed trade. A chased trade is a planned loss. The market will always give you another opportunity, but it won't always give you your capital back.
Ignoring Volume Confirmation
A breakout without a significant spike in volume is often a trap. Price can easily poke through the opening range high or low on light volume, only to snap back violently. This creates a frustrating false breakout—what some traders call a "head fake." It's easy to get so fixated on the price level that you completely forget to check the volume story.
Think of volume as your confirmation signal. It’s the market showing its conviction behind the move. A genuine breakout should come with a noticeable surge in trading activity, telling you that institutional money is likely participating.
To avoid this trap, make volume analysis a non-negotiable part of your checklist.
- Look for volume that is significantly higher than the average of the candles that came before it.
- If a breakout happens on weak or declining volume, it’s a major red flag. It's almost always better to just pass on the trade and wait for a setup that has clear confirmation.
Setting Stops Too Tight or Too Wide
Your stop-loss placement is a critical skill, and there’s a fine line to walk here. Set it too tight, and you'll get shaken out by normal market noise before the real move even has a chance to get going. But if you set it too wide, you invalidate the entire premise of the trade and expose yourself to a catastrophic loss.
The most logical place for an opening range breakout stop is just inside the opposite boundary of the range. This placement is directly tied to the trade’s core idea: the market has chosen a direction out of the range. If the price completely reverses and breaks through the other side, your idea was definitively wrong. It's time to get out with a small, controlled loss.
Avoid placing stops based on arbitrary dollar amounts or percentages. Let the price action of the range itself define your risk.
Got Questions About the ORB?
Even with a detailed plan, new questions always surface when you're in the heat of the moment. Let's tackle some of the most common things traders ask me about trading the opening range breakout. My goal here is to give you clear, practical answers so you can navigate the market open with more confidence.
What Is the Best Time Frame for the Opening Range?
There's no single "best" time frame, and anyone who tells you otherwise is selling something. The right choice comes down to the personality of the asset you're trading.
For those fast-moving, news-driven individual stocks, a shorter range of 5 to 15 minutes is often where the magic happens. This window is tight enough to let you catch that first powerful, explosive move right out of the gate.
On the other hand, for something broader and less erratic like the SPX, a 30 or 60-minute range usually works better. A longer window like this helps you sidestep all that initial chaotic noise and chop, giving a real, more reliable trend a chance to emerge before you put any capital at risk.
How Do You Handle False Breakouts?
False breakouts are just a part of the game. You'll never eliminate them completely, but you can build a solid defense to minimize their impact. It all comes down to a mix of strict entry rules and disciplined risk management.
First, never, ever jump in the second a price pokes its head above or below the range. Patience is your best friend here. I always wait for a candle to close decisively outside the range. This one little habit filters out a massive number of fake-outs. Also, look for a visible spike in volume confirming the move—that tells you other traders are coming in with conviction.
Your stop-loss is your ultimate safety net against a false breakout. If a move fizzles out and reverses, a well-placed stop gets you out with a small, manageable loss, protecting your capital for the next clean setup.
Can the Opening Range Breakout Be Used for Shorting?
Absolutely. The ORB strategy is completely direction-agnostic, which is one of the reasons it's such a versatile tool. The logic works just as well in a falling market as it does in a rising one.
It’s really straightforward in practice:
- A confirmed breakout above the opening range high is your signal to look for a long entry.
- A confirmed breakdown below the opening range low is your trigger to consider a short entry.
All the core principles remain exactly the same. You're still waiting for a confirmed candle close, still checking for volume, and still placing your stop-loss on the opposite side of the range. The process is identical whether you're buying or selling.
Does This Strategy Work in All Market Conditions?
While the ORB is a robust strategy, it definitely has its preferred environments. It shines in trending or volatile markets where there's clear directional energy. In these conditions, breakouts tend to have more power and follow-through.
Where does it struggle? In choppy, sideways, or low-volatility markets. On those days, you'll see a lot more false breakouts because the market simply lacks the conviction to pick a direction and run with it. A huge part of trading this strategy successfully is learning to read the personality of the day. If the market is quiet and directionless, sometimes the best trade you can make is to simply sit on your hands and wait for a better opportunity tomorrow.
At Colibri Trader, we teach traders how to master price action and build consistent profitability without relying on confusing indicators. Our educational programs provide a clear, step-by-step path to help you read the markets and trade with confidence. Discover your trading potential by exploring our courses and community at https://www.colibritrader.com.