


A Trader’s Guide to Market Structure Trading

Think of a price chart. What do you see? For most, it's just a messy scribble of random ups and downs. But for a price action trader, that's not noise—it's a story unfolding.
This is the very essence of market structure trading. It’s the art of seeing the hidden framework behind price movement to get a real feel for where the market is likely going next. It’s about learning to speak the market’s language, a language told through its peaks, valleys, trends, and consolidations.
Learning to Read the Market Story
Market structure trading isn’t about some magic formula. It’s a core skill, one that allows you to read the psychology of the market directly from your charts. Once you understand the narrative playing out in front of you, confusing data transforms into a clear map of opportunity. This gives you a serious edge. This guide is here to help you see that story for yourself.
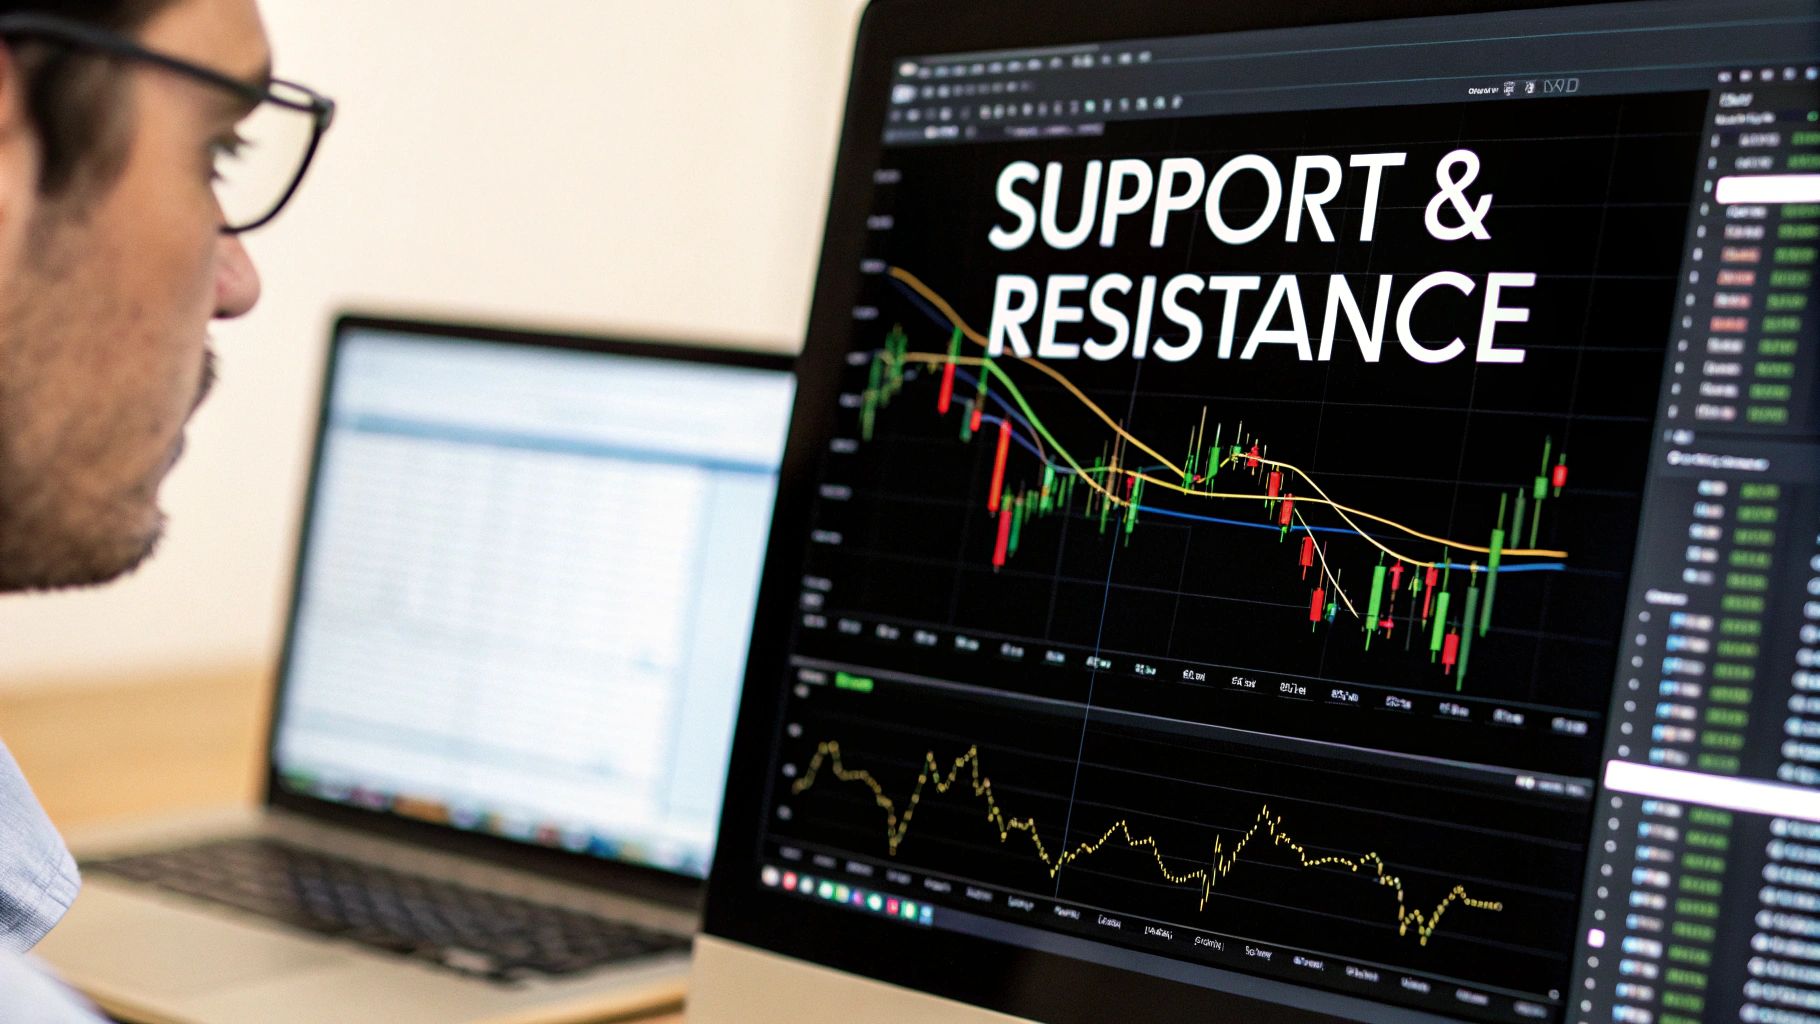
The whole idea is to understand how price behaves and use that to your advantage. For years, traders have used key support and resistance zones to predict where price might bounce or break through. It’s not just retail traders, either. Research shows that markets with a clear, defined structure pull in more trading volume. In fact, you can see up to a 35% increase in volume during breakouts from these key levels, largely because big institutions time their massive orders around these very points.
Why Market Structure Matters
Seeing the market’s framework helps you align your trades with the dominant flow of money. It lets you answer the most important questions before you even think about putting your capital on the line:
- Who’s in control? Are the bulls pushing prices to new highs, or are the bears taking over?
- Is the trend strong? A clear series of higher highs and higher lows tells you the bullish momentum is real.
- Is a reversal coming? When price fails to make a new high and then breaks a recent low, that's a huge signal that the tide might be turning.
By mastering these concepts, you shift from being a reactive participant to a proactive analyst. You stop chasing price and start anticipating its next logical move based on the story it has already told.
This approach gives you a repeatable process for making objective decisions. It strips away the emotional guesswork that kills so many trading accounts. If you're looking to build a rock-solid foundation, our guide on trading market structure offers deeper insights into these core principles.
Identifying The Three Key Market Phases
We often forget that markets, much like people, have moods. One moment they’re charging ahead; the next, they’re retreating for cover or simply taking a breather. In price-action trading, pinpointing these moods—known as market phases—is the first milestone on your path to consistency.
Here’s a quick look at the three phases we’ll explore:
- Uptrend
- Downtrend
- Consolidation
By recognizing these patterns on your chart, you stop swimming against the tidal flow and start moving with the current.
The Uptrend Bullish Momentum
Picture a staircase where each new step reaches a higher point than the last. In trading, we call these higher highs (HH) and higher lows (HL). Buyers are in control here, repeatedly overcoming gravity and snapping up every dip before price can slip below the previous low.
Key points to remember:
- Buyers chase price above past peaks
- Dips become buying opportunities
Trading tip: In a clear uptrend, look for pullbacks to those higher lows—they often make the safest entry points.
The Downtrend Bearish Control
Now imagine descending that same staircase. Each landing sits lower than the one before, and any small rally fails to clear the previous high. You’ll spot lower highs (LH) and lower lows (LL). Sellers are steering the ship, nudging price down and pinching out buyer confidence.
What this tells you:
- Rallies grow weaker over time
- Sellers push price into fresh lows
Trading tip: In a downtrend, focus on selling near lower highs instead of trying to catch a falling knife.
“Trade with the trend. In an uptrend, buy the pullback; in a downtrend, sell the rally.”
Consolidation The Market Takes A Breath
Sometimes the market simply pauses. Price swings within a horizontal band, bouncing between a clear support floor and a resistance ceiling without making new extremes. Think of it as the market catching its breath before its next big move.
During consolidation:
- Buyers and sellers are evenly matched
- Price action feels choppy and indecisive
Trading approaches:
- Sit out until you see a breakout
- Or trade the edges of the range, always watching for that decisive move
Before we move on, here’s a handy reference table to keep these phases and their characteristics top of mind.
Quick Guide to Market Phases
| Market Phase | Key Characteristic | Market Psychology | Trader’s Primary Action |
|---|---|---|---|
| Uptrend | Higher Highs (HH) Higher Lows (HL) |
Optimism, buyer control | Buy pullbacks to HL |
| Downtrend | Lower Highs (LH) Lower Lows (LL) |
Pessimism, seller control | Sell rallies to LH |
| Consolidation | Horizontal support and resistance | Uncertainty, indecision | Wait for breakout or trade range |
Whether you’re riding a bullish surge, navigating a bearish descent, or sitting through a sideways pause, this compact cheat sheet will guide your next move. Use it to check your charts at a glance and stay in sync with the market’s current tempo.
Spotting Key Shifts in Market Momentum

Once you can read the market’s primary trend, the next big step is learning to spot when that trend is running out of gas. How do you know if a pullback is just a healthy dip or the first sign of a complete U-turn?
The answer is found in two of the most critical signals in market structure trading: the Break of Structure and the Change of Character.
Think of these signals as the market telling you a story. One confirms the plot is moving along as expected. The other is a hint that a major plot twist is coming.
Break of Structure (BoS): Confirming the Trend is Still Your Friend
A Break of Structure (BoS) is your confirmation signal. It's the market giving you a thumbs-up, saying, "Yep, this trend is still rolling." A BoS happens when price respects the current pattern and pushes decisively past a prior swing high or low.
Here’s what that looks like on a chart:
- In an Uptrend: Price makes a higher high, pulls back to form a higher low, then rallies again to smash above the previous higher high. That's your bullish BoS. It tells you buyers are still firmly in the driver's seat.
- In a Downtrend: Price creates a lower low, rallies to a lower high, then drops to break below the previous lower low. This is a bearish BoS, showing sellers still have the upper hand.
Every BoS you see just reinforces the current market direction. It's like a green light, telling you that your read on the market is in sync with where the big money is flowing.
A Break of Structure isn't just a random price move; it's a validation of momentum. It confirms that the dominant market force—be it buyers or sellers—has enough strength to overcome the last point of significant resistance or support.
Change of Character (CHoCH): The Early Warning Signal
While a BoS confirms a trend, a Change of Character (CHoCH) is the first whisper of a potential reversal. This is your heads-up that the underlying sentiment might be changing. It's a subtle but crucial event that often shows up right before a major trend change.
A CHoCH happens when the market fails to continue its pattern and instead breaks a key structural point in the opposite direction.
Imagine a strong uptrend—a clean series of higher highs and higher lows. Suddenly, the market fails to make a new higher high. Worse, instead of bouncing off the last higher low, price slices right below it.
That break of the last higher low is your CHoCH. It doesn't guarantee a reversal is coming, but it's a massive red flag. It signals that bullish momentum is fading fast, and sellers are starting to show up with some serious intent.
Getting the hang of the difference between a BoS and a CHoCH is what separates novice traders from experienced ones. The BoS helps you ride profitable trends longer and with more confidence. The CHoCH, on the other hand, is your trigger to protect profits, tighten your stops, or even start looking for a trade in the other direction. These two signals take you from just following price to actually anticipating its next move.
Trading Like Smart Money with Order Blocks and Liquidity
If you really want to level up your market structure trading, you've got to start thinking like the institutions that actually move the market. This isn't about just spotting simple highs and lows anymore. We're diving into two concepts that show you where the big players are hiding: order blocks and liquidity.
Think of these as the footprints left behind by "smart money"—the major banks, hedge funds, and financial institutions. Their massive orders are what create the structural points we trade in the first place. Once you understand how they operate, you can start anticipating major price moves instead of just reacting to them.
Uncovering Institutional Footprints with Order Blocks
So, what is an order block? It's a specific zone on your chart where a huge cluster of institutional buy or sell orders was executed. It's like finding a pocket of concentrated supply or demand that the big players left behind. These zones often act like powerful magnets, pulling price back to them in the future.
- A bullish order block is usually the last down-candle right before a powerful move up that causes a Break of Structure (BoS).
- A bearish order block is the last up-candle just before a massive drop that leads to a BoS.
When price returns to these zones, you'll often see a sharp reaction. Why? Because institutions are either defending their original positions or looking for another opportunity to get in. Nailing these zones gives you a high-probability area to plan your entries.
If you want to go deeper on this, our guide on trading supply and demand zones builds on these exact ideas.
Order blocks aren't just your average support and resistance lines. They pinpoint a specific area of institutional interest, giving you a very precise zone to watch for setups with fantastic risk-to-reward potential.
Understanding Liquidity as the Market's Fuel
If order blocks are the footprints, then liquidity is the fuel that powers the market's engine. Put simply, liquidity is just a pool of orders sitting at a certain price level. For smart money, the most delicious pools of liquidity are the clusters of stop-loss orders placed by retail traders like us.
And where do these stops tend to pile up? In the most predictable places, of course:
- Just above recent swing highs (buy-stop liquidity)
- Just below recent swing lows (sell-stop liquidity)
To fill their enormous orders, institutions often have to engineer a "liquidity grab" or "stop hunt." They'll push the price just far enough to trigger all those stop-losses, which creates a surge of volume they need to enter their own positions. Only then do they drive the price hard in the direction they wanted all along.
This is exactly why you so often see a sharp, nasty spike through a key high or low right before the market completely reverses.
The Rise of Algorithmic Market Structure Trading
This focus on liquidity and order flow has become even more important with the explosion of high-frequency trading. Algorithms now drive over 50% of trading volume in the big equity markets. These complex systems are literally programmed to hunt for market structure signals—things like order book imbalances and volume spikes at key levels—to execute trades with lightning speed.
This shift helps explain why market structure trading has become a cornerstone for institutional strategy. In fact, it's estimated that roughly 60% of hedge funds and quant funds now build their models around these core structural elements, shifting away from purely fundamental analysis.
This trend isn't just in stocks; it's everywhere, including the massive global derivatives markets, which have a notional value of over $640 trillion. When you learn to see the market through the lens of liquidity, you're starting to see it through the same eyes as these powerful players.
A Step-by-Step Market Structure Trading Strategy
Alright, let's start connecting the dots. It's one thing to understand concepts like trends, order blocks, and momentum shifts in isolation. But the real magic happens when you weave them together into a repeatable trading plan. This is where we'll build a practical, top-down framework for spotting and executing high-probability trades based on market structure.
Think of this as a blueprint. It's designed to move you from just identifying patterns to actually using them to build solid trade ideas, bringing a much-needed dose of clarity to your decision-making.
Start With the Higher Timeframe Narrative
First things first: you have to understand the bigger picture. A strong trend on a higher timeframe (HTF), like the daily or 4-hour chart, is like a powerful river current. You can try to swim against it, but it's exhausting and you probably won't get very far. The smarter move is to go with the flow.
Your initial job is to figure out what the market is doing on your chosen HTF:
- Is it an uptrend? You should see a clear series of higher highs and higher lows.
- Is it a downtrend? You'll be looking for a distinct pattern of lower highs and lower lows.
- Is it consolidating? This looks like a sideways chop, where neither buyers nor sellers have the upper hand.
Once you know the HTF trend, you have your trading bias. Simple as that. If it's an uptrend, you're only looking for buys. If it's a downtrend, you're a seller and nothing else. This one rule is your best defense against fighting the market's underlying momentum.
Pinpoint Your Zone and Wait for Confirmation
With your directional bias locked in, the next step is to find a high-probability zone to trade from. When an established trend pulls back, the price often revisits key areas of interest. Your mission is to mark these zones on your chart and then—this is the hard part—wait patiently for the price to get there.
A fantastic spot to watch is a bullish or bearish order block that kicked off the last Break of Structure (BoS). These zones are where institutions likely showed their hand, and they often come back to defend these levels.
Don't just jump in the second price taps your zone. This is where patience separates the pros from the amateurs. You must wait for a confirmation signal on a lower timeframe (LTF), like the 15-minute or 5-minute chart, to tell you it's time to act. A Change of Character (CHoCH) on the LTF is a classic, powerful signal that the tide is turning in your favor.
This whole process can really be broken down into three simple, sequential steps.
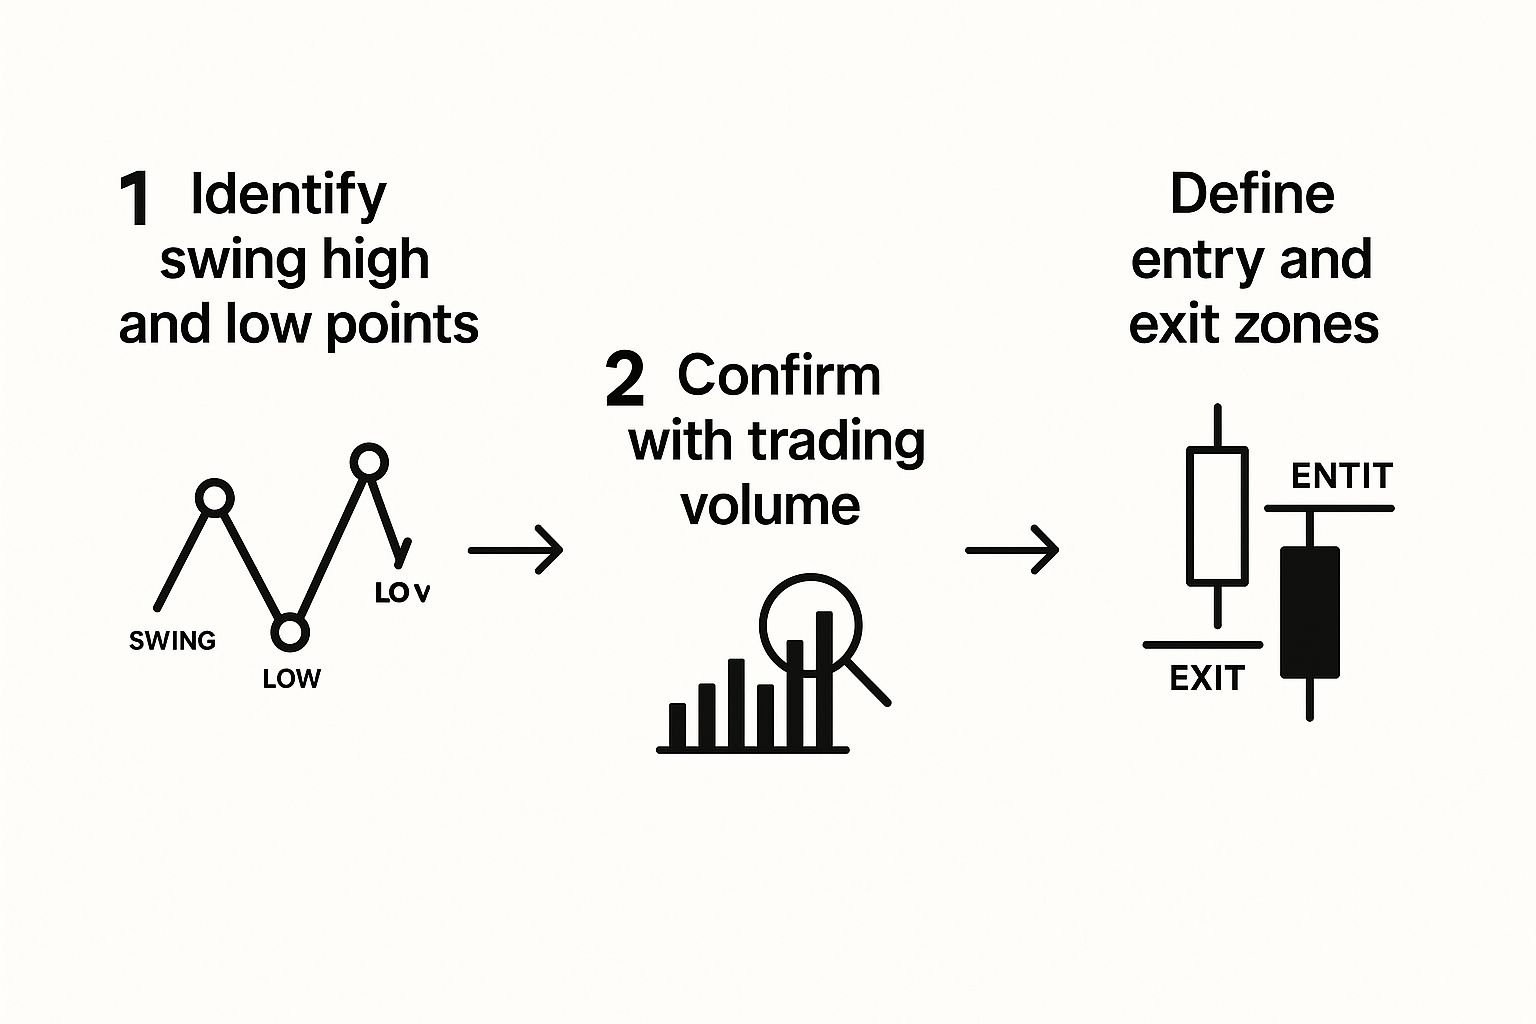
As you can see, it's a logical flow. You start with the big picture, identify your key zones, and then zoom in for confirmation before defining the trade itself.
Define Your Entry and Exits
You've got your HTF bias. You've got your HTF zone. And you've got your LTF confirmation. Now, you're ready to pull the trigger. The market structure itself will tell you exactly where to get in and out.
- Entry: Take your trade as soon as the candle confirming your LTF signal (like that CHoCH) closes.
- Stop-Loss: Place your stop just below the low of your HTF order block for a buy, or just above its high for a sell. This is your safety net if the zone breaks down.
- Profit Target: Your first target should be the next major structural point on the chart, like the most recent HTF swing high (for a long) or swing low (for a short).
Common Trading Mistakes And How To Avoid Them
Trading the market structure is one thing—pulling it off day in, day out is another. Even the best framework can crumble when familiar errors creep in. Spotting these traps early can save both your account balance and your sanity.
Align With The Higher Timeframe
It’s tempting to chase a perfect entry on a 5-minute chart, but if you’re trading against a major daily resistance, you’re swimming upstream. Always zoom out first, let the daily or 4-hour trend set the tone, then drill down for your execution.
Distinguish Pullbacks From Reversals
A healthy trend will pause, pull back, or even retrace. Yet many traders mistake that breath for a full reversal and bail early on winning trades. Remember: a pullback is just the market taking a deep breath—don’t confuse it with the finish line.
Maintain Clarity And Discipline
Cluttered charts do more harm than good. If you’re layering dozens of indicators, you’ll end up second-guessing every price bar. Instead:
- Keep it simple: price action plus volume tells the story
- Draw only the most relevant support, resistance, and structure levels
- Use one or two “go-to” tools and resist adding more when you feel uneasy
Risk Management Is Non-Negotiable
“No strategy survives without risk controls.”
Skipping a stop-loss or over-sizing a position can turn one bad trade into a devastating blow. Define your risk before you click “buy” and stick to it.
Patience Over Impulse
Forced trades rarely pay off. Chasing setups that aren’t there will blow both your edge and your confidence. Sit on your hands until price reaches a pre-defined zone and your confirmation is crystal clear. Learning more about slippage in trading will also help you manage expectations when volatility spikes.
As electronic markets evolved, traders needed a more systematic approach. When U.S. equities decimalized in 2001, bid-ask spreads shrank by roughly 40%, sharpening the microstructural levels we rely on today. For a deeper dive into how market structure has changed, check out Russell Investments’ Global Market Outlook.
A Few More Things You're Probably Wondering
Even after laying out a solid game plan, you'll probably have a few questions rattling around. That’s perfectly normal. Let's tackle some of the most common ones I hear from traders who are just starting to read the markets this way.
Does This Work on All Timeframes?
Yes, it absolutely does. One of the most beautiful things about market structure is that it's fractal. That means the same swings, breaks, and reversals you see on the monthly chart are playing out right now on the 1-minute chart.
The best approach is to start from the top down. Figure out the primary trend on a higher timeframe, like the daily chart, to get your bearings. Then, you can zoom into a lower timeframe, like the 15-minute chart, to pinpoint your exact entries.
Where Do Indicators Fit into All of This?
This is a pure price action approach, but that doesn't mean you have to throw your favorite indicators out the window. Think of tools like the RSI or MACD as confirmation, not the main event.
For example, you might see price approaching a major resistance level. If you also see some bearish divergence forming on the RSI at the same time, that's a powerful clue. But always let the price structure lead your analysis. The indicators are there to back up what the chart is already telling you.
If you’re just starting out, your number one job is to get really, really good at identifying swing highs and lows. Master that, and you’ve built the foundation for everything else.
Is Market Structure a Forex Thing, or Can I Use It in Other Markets?
It works everywhere. At its core, market structure is just a visual representation of the battle between buyers and sellers—supply and demand. That fundamental psychology is the engine that drives every market.
Whether you're trading forex, crypto, stocks, or commodities, the same patterns will show up time and time again. This makes learning to read market structure an incredibly versatile skill that you can take with you, no matter what you choose to trade.