


Market Structure Chart: From Beginner to Pro in 30 Days

Starting Your Market Structure Chart Journey
Learning to read market structure charts can seem daunting at first. However, every trader begins with the same basic knowledge. It's like learning a new language: complex initially, but fluent with practice. This section will break down the essential elements of market structure charts and explain why they are so valuable in the trading world.
Why Focus on Structure?
Professional traders understand the importance of structural analysis, prioritizing it over simply following price fluctuations. Price can be deceptive in the short term, fluctuating like a leaf in the wind. Market structure reveals the bigger picture, like the prevailing winds themselves, giving a better indication of the market’s true direction. This allows for identifying genuine opportunities and filtering out market noise.
Understanding Market Psychology
Market structure charts provide valuable insights into the psychology of other traders. They are a reflection of collective market sentiment, revealing the hopes and fears driving price action. A sequence of higher highs and higher lows indicates underlying bullishness, suggesting confidence in continued growth. Conversely, a series of lower highs and lower lows suggests bearishness, indicating a prevailing expectation of decline. Recognizing these patterns provides a crucial edge in making informed trading decisions.
Essential Components of a Market Structure Chart
Understanding the core components of market structure charts is paramount. Swing highs and swing lows are the fundamental building blocks. A swing high is a candlestick where the price is higher than the candlesticks both immediately before and after it. A swing low is a candlestick with a price lower than those surrounding it. These swings illustrate the ongoing battle between buyers and sellers, revealing trends and patterns.
| Component | Description |
|---|---|
| Swing High | A candlestick with higher prices both before and after it. |
| Swing Low | A candlestick with lower prices both before and after it. |
| Trend Line | Connects a series of swing highs or swing lows to indicate trend direction. |
| Support/Resistance | Price levels where the market tends to reverse direction. |
From Novice to Expert
Mastering market structure charts is a crucial step towards consistent profitability. Like any skill, it requires dedicated effort and practice. By grasping the underlying market psychology, identifying key components, and interpreting patterns, you can significantly improve your trading approach. This journey from beginner to expert isn't about memorizing complex formulas. It's about developing a profound understanding of how the market behaves, translating that knowledge into smarter, more profitable trades.
How Technology Changed Everything For Traders

The era of bustling trading floors, dominated by shouts and hand signals, is fading into history. The transition from this open outcry system to electronic trading platforms has significantly altered how traders engage with and understand market structure charts. This evolution means traders now benefit from precise data, delivering more reliable signals for confident decision-making.
The Rise of Electronic Trading and Market Structure Charts
Imagine grappling with market structure analysis using outdated, fragmented data. It would be a trader's worst nightmare. Fortunately, electronic trading has eliminated this challenge. It offers a centralized, real-time market view, making market structure analysis significantly more accurate and accessible. This technological leap has leveled the playing field, giving individual traders the same powerful tools once exclusive to major financial institutions.
Electronic platforms, for example, feature consolidated order books. These order books display real-time supply and demand, allowing traders to pinpoint crucial support and resistance levels with enhanced precision. Moreover, electronic trading minimizes the "noise" inherent in open outcry systems. This clearer information flow makes it easier to identify genuine structural breaks and emerging trend formations, vital aspects of market structure analysis.
This shift to electronic trading, often called electronification, now dominates market operations. This involves migrating to electronic platforms for improved efficiency and cost reduction, a trend especially prominent in foreign exchange (forex) and equities trading. By 2023, nearly 90% of forex trading was electronic, highlighting the widespread adoption of digital platforms in modern finance. For a deeper dive into this transformation, check out: Find more detailed statistics here.
Democratizing Market Access
This shift hasn't just improved the clarity of market structure charts; it's democratized access to them. Resources once available only to large institutions are now readily available to retail traders. This empowers individual investors to analyze market dynamics and make educated decisions based on real-time structural insights.
The Power of Real-Time Data
The transition to electronic trading has profoundly impacted the reliability of data fueling market structure charts. Up-to-the-second information allows traders to respond instantly to market fluctuations. This immediacy helps traders avoid costly errors and seize fleeting opportunities. The clarity and speed offered by electronic platforms are paramount for accurate market structure interpretation, allowing traders to construct effective strategies based on reliable, timely data.
Increased Speed and Efficiency
Electronic trading platforms execute orders with remarkable speed. This speed is essential in today’s volatile markets, enabling traders to swiftly respond to structural shifts and capitalize on short-term opportunities. This heightened efficiency has made market structure analysis a potent tool for traders of all skill levels. Understanding how technology has transformed this type of analysis is fundamental to grasping the effectiveness of modern trading strategies.
Decoding Chart Patterns That Actually Make Money
Modern traders are increasingly using technology to analyze market structure charts. Tools like the best AI productivity tools boost efficiency. This access to powerful technology helps traders identify profitable patterns and improve their trading strategies. This involves recognizing key structural breaks, swing highs, and trend formations that signal potential trading opportunities.
Identifying Profitable Chart Patterns
Learning to tell the difference between false breakouts and genuine structural shifts is critical for long-term success. False breakouts can quickly deplete trading accounts. Correctly identifying true shifts, however, creates opportunities for substantial gains. Think of it this way: a false breakout is like a mirage, while a genuine shift is like finding an oasis.
- Head and Shoulders: This pattern often signals a potential trend reversal from bullish to bearish.
- Double Top/Bottom: These formations suggest a trend reversal, with two distinct peaks (double top – bearish) or troughs (double bottom – bullish).
- Flags and Pennants: These patterns typically represent short pauses in a strong trend, often followed by continuation in the original direction.
For more information on chart patterns, read How to master day trading patterns.
Utilizing Multi-Timeframe Analysis
Analyzing charts across different timeframes, such as weekly, daily, and hourly, increases the accuracy of your analysis. This multi-timeframe analysis gives a broader market perspective and helps reduce false signals. A bullish pattern on a daily chart, for example, might be confirmed by an uptrend on the weekly chart. This would increase the probability of a successful trade. Alternatively, conflicting signals across timeframes can warn of a potential false breakout.
Adapting to Market Conditions
Different patterns perform better under various market conditions. Understanding these nuances is key for maximizing profits. Some patterns thrive in volatile markets, while others are more reliable during periods of consolidation. The infographic below shows how the number of firms and barriers to entry vary across market structures, illustrating how important it is to adapt to different conditions.
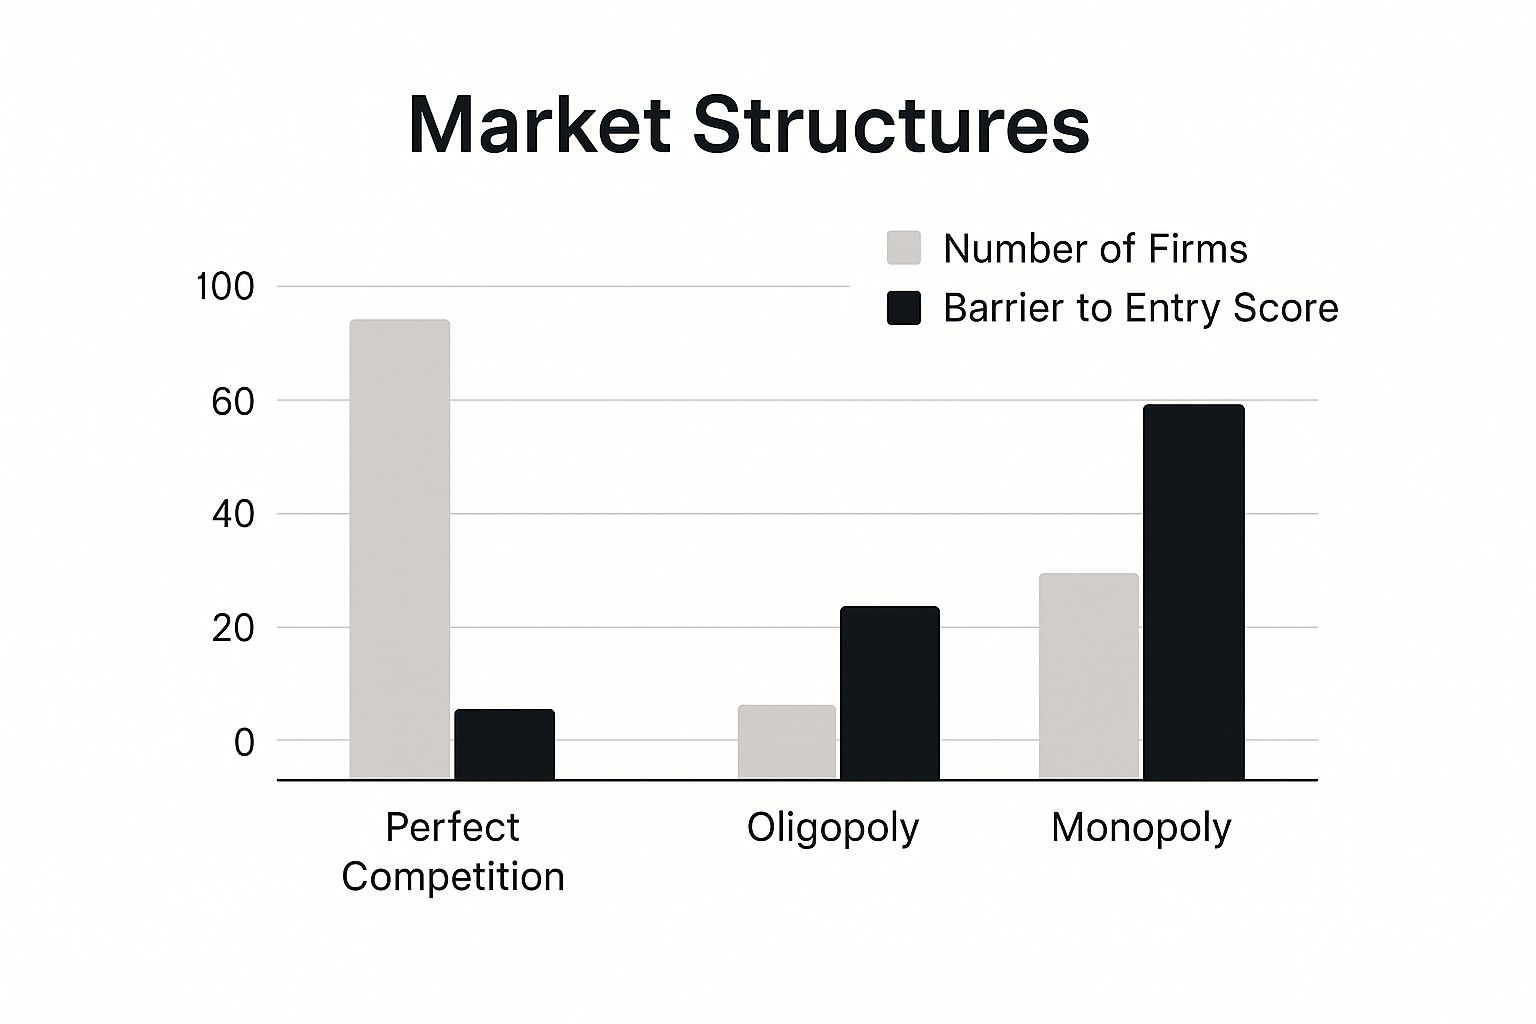
Monopolies, with a single firm and high barriers to entry, represent a drastically different trading environment than perfect competition. In perfect competition, numerous firms operate with low barriers to entry. This highlights the need to adapt your analysis to the specific market structure. Adaptability in analyzing market structure charts is essential for navigating real market complexities. By recognizing the characteristics of each market structure, traders can refine their strategies.
The following table presents real-world performance data of different market structure patterns across various trading conditions, further demonstrating the importance of recognizing these conditions.
High-Probability Pattern Success Rates
| Pattern Type | Success Rate | Best Market Condition | Risk Level |
|---|---|---|---|
| Head and Shoulders | 70% | Downtrend | Medium |
| Double Top | 65% | Ranging | Medium |
| Double Bottom | 60% | Uptrend | Medium |
| Flags | 75% | Strong Trend | Low |
| Pennants | 70% | Strong Trend | Low |
This table illustrates how different patterns thrive under specific conditions. For example, "Flags" and "Pennants" perform well in strong trending markets and are considered lower risk. "Head and Shoulders" patterns are more effective in downtrends, while "Double Top" and "Double Bottom" formations are best suited for ranging markets. By adapting to these conditions and understanding pattern success rates, traders can make more informed decisions.
Why Different Markets Need Different Approaches
Not all markets operate under the same conditions. Recognizing these differences is crucial for effectively using a market structure chart. Just as a ship's captain adjusts their course based on changing seas, successful traders adapt their strategies to the specific market they're trading. This means understanding how U.S. equity markets, for example, differ structurally from those in Europe or Asia, and how those differences impact your approach. To improve your chart analysis skills, consider exploring proven techniques for analyzing stock charts.
Regional Factors Influencing Market Structure Charts
Several factors contribute to these regional variations. Trading hours, for one, significantly impact market activity. When the U.S. market opens, European markets are already well into their day, creating overlapping periods of increased volatility. Participant behavior also plays a crucial role. Different regions attract distinct types of traders:
- Institutional Traders
- Retail Traders
- Algorithmic Traders
Each contributes their unique style to the overall market rhythm.
Asian markets, for instance, often exhibit different patterns due to the prevalence of high-frequency trading and government policies. Strategies effective in one region might not translate well to another. Regional economic factors further complicate the picture. News and data specific to one region can trigger localized reactions that may not impact other markets.

The global outlook adds another layer of complexity. According to J.P. Morgan Research, the U.S. equity market is projected to remain strong, with the S&P 500 potentially reaching 6,500 by the end of 2025. This projected growth is attributed to a positive labor market and significant capital investments. However, Europe faces structural challenges, and emerging markets face slower growth due to factors like higher interest rates.
Tailoring Your Market Structure Analysis
A one-size-fits-all analysis would be ineffective. Instead, successful traders adapt their analysis to each market's specific characteristics.
Understanding Unique Chart Signatures
This involves recognizing the unique chart "signatures" created by trading hours, participant behavior, and regional economics. These signatures appear as distinct patterns in volatility, volume, and price movements. Certain structural signals, such as breakouts from consolidation patterns, might be more reliable in the highly liquid U.S. market.
Focusing Your Analysis
The same signal might be less reliable in a less liquid market where price manipulation is a greater risk. Identifying these nuances helps traders focus their analysis and resources on markets and signals with the highest probability of success.
By understanding these regional and market-specific factors, traders can avoid costly mistakes and develop more effective trading strategies. This approach ensures that their analysis remains relevant and effective in the dynamic global market.
Expanding Beyond Traditional Market Analysis
Traditional market analysis often revolves around well-established markets like stocks and bonds. But experienced traders know that substantial opportunities often lie in less-charted territories. This section explores how the principles of a market structure chart can be applied to alternative investments and emerging markets. These are areas often overlooked, presenting potential for those willing to venture beyond the conventional. For more insight, consider reading How to master supply and demand trading.
Identifying Untapped Opportunities
The ever-shifting dynamics of global trade constantly create unique structural opportunities. These opportunities may not be readily apparent using typical analysis methods. They exist across various asset classes and geographic regions.
Consider, for example, the expanding private equity market. While some investors approach this sector with caution, others see it brimming with potential. This is where a market structure chart becomes incredibly useful. It allows traders to identify emerging trends and position themselves advantageously.
The Power of Structural Trends
Emerging markets, in particular, offer a distinct landscape for structural analysis. These markets often operate under different dynamics than established markets. They can be more volatile, yet they also offer the potential for higher growth. By understanding the structural trends within these markets, traders can potentially capitalize on these opportunities before they become widely recognized.
Furthermore, global economic factors can trigger predictable structural shifts. Traders who can anticipate these shifts gain a significant edge in the market.
This broadened perspective requires more than just simple technical indicators. It necessitates understanding the fundamental forces shaping these markets.
Consider the growth of global trade fueled by services and developing economies. It reached nearly $33 trillion in 2024. This underscores the increasing importance of global trade in the economic landscape. A McKinsey report details the expansion of private capital across several sectors, including real estate, private equity, and infrastructure, with continued growth projected for 2025. The report also highlights the global economy's anticipated GDP growth rate of approximately 3% in 2025, consistent with 2024 levels, with expected improvements in various regions beyond the U.S. and China. Factors such as central bank policies and geopolitical events will influence market structures and investment opportunities.
Navigating Algorithmic Trading
In today's markets, heavily influenced by algorithmic trading, finding opportunities not already exploited by algorithms is critical. A market structure chart can provide this crucial advantage. It helps uncover hidden patterns and opportunities that automated systems may overlook. This is essential for traders seeking an edge (alpha) in an increasingly competitive landscape.
By combining market structure analysis with an understanding of global economic factors, traders can potentially discover opportunities in areas often missed by purely quantitative approaches. This allows for capitalizing on market inefficiencies and potentially achieving superior returns.
Avoiding The Mistakes That Kill Trading Accounts

Even experienced traders can make expensive mistakes when reading market structure charts. This guide helps you avoid common pitfalls, protect your capital, and aim for consistent profits. We’ll explore the psychological traps that can cloud your judgment, and how to develop the objective mindset needed for trading success. For more insights on managing your trading capital, check out this resource: How to master money management.
The Danger of Forced Patterns
One of the fastest ways to lose money in trading is by forcing patterns onto market structure charts where they don't exist. This often happens when traders desperately search for confirmation of a pre-existing trade idea. It's a futile exercise, like trying to force a square peg into a round hole.
For instance, imagine spotting a partial head and shoulders pattern and entering a short trade based on this incomplete formation. The market, however, might move in the opposite direction. Without confirmation, like a break below the neckline, this forced interpretation can result in a significant loss.
Maintaining Discipline When Charts Are Unclear
Market structure charts don't always offer clear signals. This ambiguity can be frustrating, tempting traders to abandon their discipline and enter trades prematurely. Patience is key in these situations.
It's always better to wait for a clear setup than to risk your capital on a hunch. Remember, profitable opportunities don't appear every day, and preserving your capital is essential for long-term success.
Learning from Failed Trades
Analyzing past trading mistakes offers valuable lessons. By reviewing trades that went wrong because of incorrect market structure analysis, you can identify areas to improve. This process reinforces the importance of confirmation and waiting for a genuine structural break.
Consider each losing trade as a learning experience, a necessary cost on your path to becoming a better trader.
The Importance of Structural Breaks
A structural break signals a shift in the established market order. This could be a break above a strong resistance level or below a key support level. These breaks indicate a change in market sentiment and often precede significant price movements.
Waiting for confirmation of a structural break before entering a trade greatly improves your chances of success. This disciplined approach often distinguishes consistently profitable traders from those who struggle. A structural break resembles a crack in a dam; it hints at potential flooding of price movement.
Just as a crack doesn't always guarantee a dam burst, a perceived break in market structure needs confirmation before acting on it.
Patience and Confirmation Are Key
In the fast-moving world of trading, patience might seem like a weakness. But when analyzing market structure, patience combined with confirmation is your greatest asset. By waiting for clear signals and avoiding the urge to force interpretations, you protect your capital and improve your chances of profitable trades.
This disciplined approach is essential for generating consistent returns and navigating the complexities of the market. Successful trading is a marathon, not a sprint. Mastering these principles empowers you to trade with confidence and achieve lasting results.
Key Takeaways
Your journey to mastering market structure charts doesn't end with simply understanding patterns and regional variations. To truly integrate these concepts into your daily trading, you need a structured approach. This section provides that framework, offering actionable strategies and realistic milestones to help you consistently improve your trading results.
Building a Watchlist Based on Structure
Creating a watchlist isn't about randomly picking assets. It's a targeted process of identifying instruments that exhibit promising structural characteristics. Look for assets developing familiar patterns like head and shoulders, double tops/bottoms, or flags. These can suggest potential breakouts or trend reversals. Also, consider assets approaching key support and resistance levels. Breaking through these levels can often signal a significant price move.
Prioritize a focused selection of assets you can thoroughly analyze, rather than spreading your attention too thin.
Leverage the power of charting software to easily identify patterns and mark key structural levels.
Categorize your watchlist by market type, sector, or pattern for quick assessment of relevant opportunities.
Setting Alerts for Key Levels
Once you've built your watchlist, setting alerts for key levels is critical. This ensures you don't miss important structural breaks. Alerts can notify you of an asset breaking through resistance, dropping below support, or forming a specific pattern. Having this real-time information enables you to react swiftly to market shifts and capitalize on emerging opportunities.
Set price alerts for breakouts above resistance or below support.
Consider pattern alerts offered by some platforms for specific candlestick patterns or technical indicator confirmations.
Monitor volume alerts as sudden spikes can confirm the validity of a structural break.
Maintaining a Trading Journal
A trading journal is much more than a simple record of your trades; it's a tool for ongoing learning and self-improvement. Documenting your market structure analysis decisions, whether successful or not, allows you to pinpoint strengths and weaknesses in your approach. This structured reflection highlights what's working, what needs adjustment, and how to refine your analysis for better outcomes.
Carefully record the structural patterns you observed, your entry and exit points, and your reasoning for each trade.
Regularly review your trades, looking for recurring patterns in your behavior.
Track key performance metrics like win rate, average win/loss ratio, and overall profitability.
Essential Tools and Software
Using appropriate charting software and analysis tools is crucial for efficient market structure analysis. Many platforms offer customizable charts, drawing tools, and technical indicators to visualize structural patterns. Some even offer automated pattern recognition and alert features.
Choose charting software that allows you to work with various timeframes and use drawing tools to mark key structural levels.
Consider using scanning tools to find assets matching specific structural criteria, such as those near breakouts or forming particular patterns.
Backtesting software can help you test trading strategies against historical data to evaluate their effectiveness in various market conditions.
Staying Organized and Disciplined
Trading success hinges on discipline and organization. Develop a routine for analyzing markets, managing your watchlist, and reviewing your trading journal. Consistency in your analysis and execution is key for long-term profitability.
Establish a daily or weekly routine for market analysis and journal review.
Stick to your trading plan, avoiding impulsive trades driven by emotion or short-term market fluctuations.
Continuously educate yourself on market trends and refine your understanding of market structure analysis.
Ready to transform your trading with market structure? Colibri Trader offers comprehensive training and resources to equip you with the skills and knowledge you need to succeed. Start your journey today and explore the potential of price action trading.