


Learn to Read Stock Charts Like a Pro
Jumping into trading can feel like trying to read a foreign language, but learning how to read stock charts is a skill you can absolutely pick up. At its core, a chart is just the story of a stock's price, told visually over time. Getting comfortable with this visual language isn't just a good idea; it's the first, non-negotiable step to making trades with any real confidence.
Your First Look at Stock Charts
Think of a chart as your map of the market. Without one, you're just wandering around and guessing. A chart doesn't just tell you where a price has been; it’s packed with clues about where it might go next. You're literally watching the ongoing battle between buyers (the bulls) and sellers (the bears) play out in real time.
Every single chart, no matter what trading platform you're using, is built on a few key components. Nail these down, and you're well on your way.
The Core Components of Any Chart
Let's start with the basic anatomy. When you pull up a chart for a stock like Apple (AAPL) or Tesla (TSLA), you'll see two main axes.
- The X-Axis (Horizontal): This is your timeline. You can set it to show minutes, hours, days, or even years. The timeframe you pick really depends on your trading style. A day trader might live on a 5-minute chart, while a long-term investor would probably stick to a weekly or monthly view.
- The Y-Axis (Vertical): This simply shows the price. The higher you go up the axis, the higher the price. This lets you pinpoint a stock's value at any moment in the past.
Now, look at the bottom of the chart. You'll likely see a series of vertical bars. This is the volume indicator, and it's a critical piece of the puzzle. Volume shows you exactly how many shares were traded in a given period. I can't stress this enough: volume helps confirm the strength of a price move. A big price jump on massive volume carries a lot more weight than a jump on flimsy, low volume.
Your Quick Start Guide to Reading a Chart
Ready for a "quick and dirty" way to get started? Let's forget all the complex patterns for just a minute. Open any stock chart and do just two things.
First, find the current price. It's almost always the point farthest to the right on the chart. That’s the stock’s value right now. Easy enough.
Second, zoom out and just look at the big picture. What’s the general direction of the price over the last few months? Is it climbing from the bottom-left to the top-right? That's an uptrend. Is it falling from the top-left to the bottom-right? That's a downtrend. Or is it just bouncing around in a channel, not really going anywhere? That's consolidation.
Simply identifying the current price and the overall trend is the most fundamental skill in chart analysis. It’s a 30-second observation that gives you immediate context before you dig any deeper.
This simple assessment is your foundation. Believe it or not, you've just performed your first bit of technical analysis without getting bogged down in jargon. This initial read gives you the context you need for any further investigation.
For a more detailed look at these basics, this guide on https://www.colibritrader.com/how-to-read-trading-charts/ is a great resource that expands on these concepts. Building this solid groundwork is key, because it gets you ready to tackle the more advanced techniques we’ll be diving into next.
Choosing the Right Chart for Your Analysis
Okay, let's get into the tools of the trade. If you really want to learn how to read stock charts, you have to start by picking the right one. This isn't just a matter of preference; the type of chart you use directly dictates what you can see—and what you can't.
Think of it this way: a detective wouldn't use a magnifying glass to survey an entire crime scene. You need the right tool for the job. The same goes for charting.
The simplest and most common chart is the line chart. It just connects the closing prices over time with a single line. That’s it. Its power is in its simplicity.
For spotting broad, long-term trends, a line chart is fantastic. It cuts through all the daily "noise" and gives you a clean look at a stock's general direction over months or years. But that's also its biggest drawback—it tells you nothing about what happened during the trading day.
Going Deeper with OHLC Data
To see the real action, you need to step up to a bar or candlestick chart. Both of them show you the four most critical pieces of data for any time period: the open, high, low, and close—what traders call OHLC data. This is where you start to gauge volatility and market sentiment.
This infographic gives a great visual breakdown of how these charts differ.
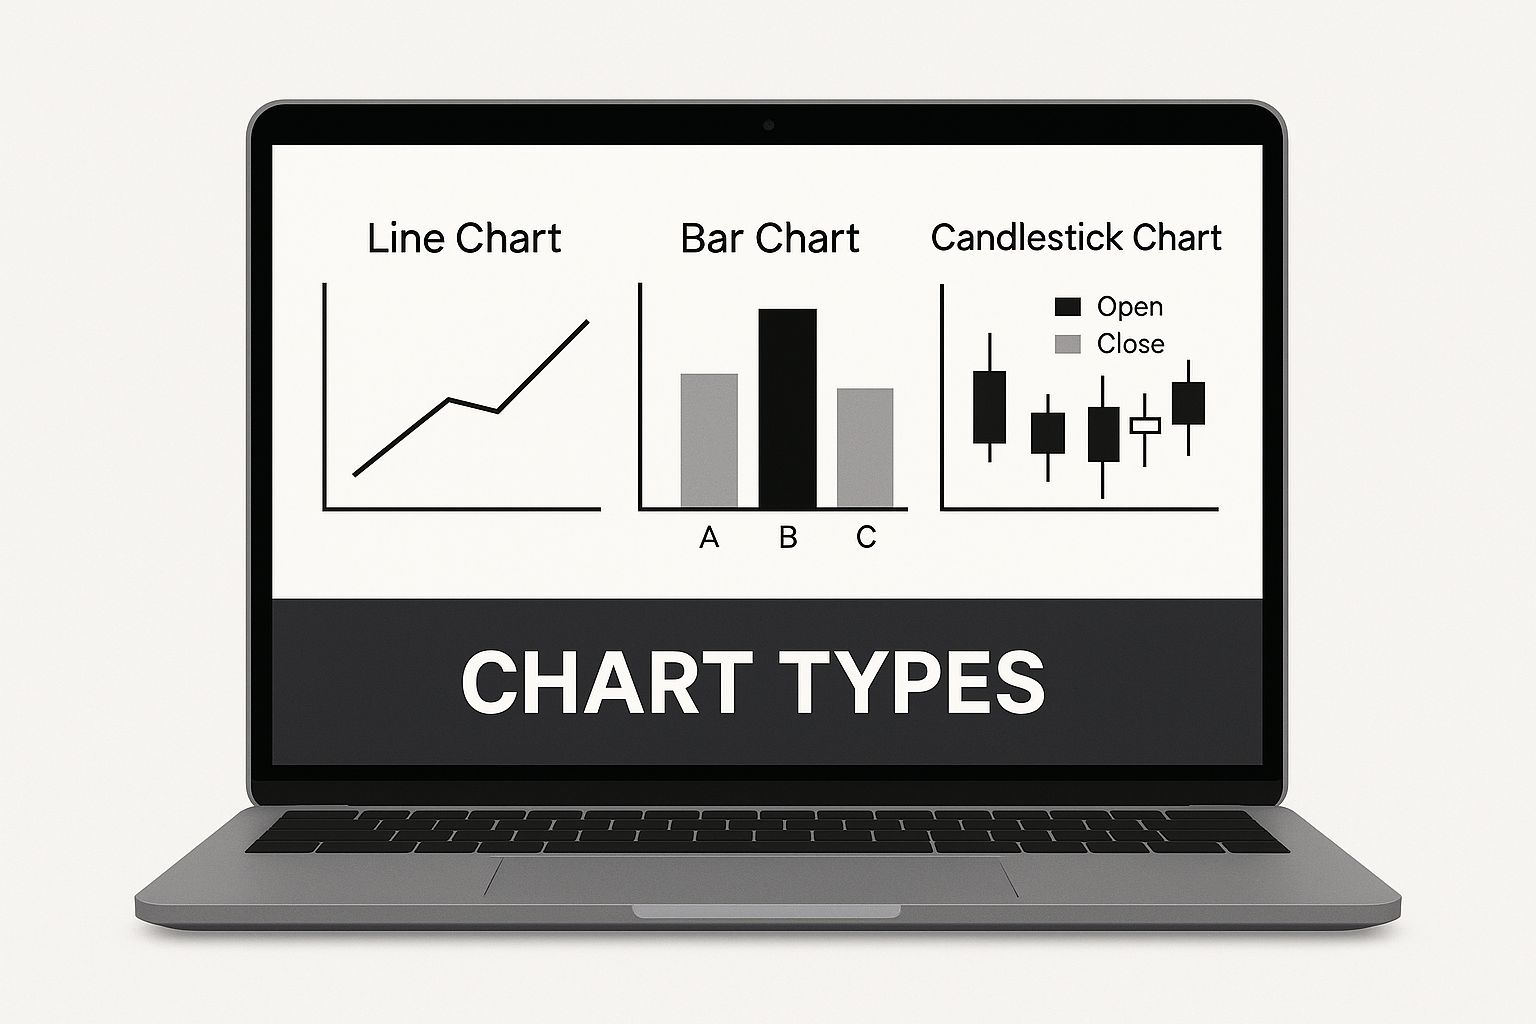
As you can see, line charts give you the big picture, but bar and candlestick charts deliver the rich detail needed for serious analysis.
A bar chart uses a vertical line to show the trading range from the period's high to its low. Two little horizontal dashes stick out from this line: the left dash is the open, and the right dash is the close. Bar charts pack in all the essential OHLC information, which lets you see volatility at a glance. You can find more detail on these foundational chart types in this helpful guide on reading stock charts from Schwab.com.
The Trader's Choice: Candlestick Charts
While bar charts get the job done, I, along with most modern traders, lean heavily on candlestick charts. They show the exact same OHLC data but in a way that’s far more intuitive and visually immediate.
Each "candlestick" has a main part called the "real body." This shows the range between the opening and closing price.
- Green (or white) candlesticks mean the price closed higher than it opened. A good day for the bulls.
- Red (or black) candlesticks mean the price closed lower than it opened. A win for the bears.
The thin lines poking out from the top and bottom of the body are called "wicks" or "shadows," and they show the full journey of the price from its absolute high to its absolute low for that period. The interplay between the body and the wicks tells a vivid story about the fight between buyers and sellers, which is something we'll get into more detail on later.
Key Takeaway: For a clean, long-term trend view, line charts are fine. But for detailed analysis of daily price action and market psychology, candlestick charts are the gold standard. They give you the clearest, fastest read on whether the bulls or the bears are in control.
To make the choice crystal clear, let's break down the main chart types side-by-side.
Comparison of Common Stock Chart Types
This table breaks down the three most common charts to help you decide which one is right for your trading style. Each has its place, but as you'll see, one tends to stand out for active analysis.
| Chart Type | What It Shows | Best For | Limitation |
|---|---|---|---|
| Line Chart | A single line connecting closing prices. | Identifying long-term trends and patterns with a clean, simple view. | Hides intraday volatility and price gaps; lacks OHLC data. |
| Bar Chart | Open, High, Low, and Close (OHLC) prices for each period. | Analyzing volatility and the trading range in detail. | Can appear cluttered and less intuitive to read than candlesticks. |
| Candlestick Chart | The same OHLC data as bar charts, but with a visual body. | Quickly interpreting market sentiment and identifying common patterns. | Can overwhelm beginners with too much initial information. |
In the end, there's a reason most active traders gravitate toward candlestick charts. Their visual design makes spotting recurring patterns and understanding the market's psychology in a single glance much, much easier.
Identifying Market Trends and Momentum
Alright, you've settled on a chart type—and if you're like most of us, you're looking at candlesticks. Now comes the most fundamental question you'll ever ask as a trader: which way is the market heading?
This isn't just a casual glance. Your ability to answer this question accurately is what separates a calculated trade from a wild guess. It's the absolute foundation of your trading plan.
Prices never move in a straight line. They flow in a series of waves, creating peaks and valleys. Your job, first and foremost, is to read these waves and figure out the market's overall direction.
The Three States of the Market
Every single asset you can trade is always in one of three states. Learning to spot them instantly is non-negotiable if you want to learn to read stock charts and actually make sense of them.
- Uptrend: This is what you see when a chart shows a series of higher highs and higher lows. Picture climbing a staircase—each step up is higher than the last, and you don't step back down to where you started. This is a clear signal that buyers are in charge.
- Downtrend: As you'd expect, this is the exact opposite. You'll see a series of lower highs and lower lows. It's like walking down a flight of stairs. Sellers have taken control and are pushing the price down.
- Sideways Consolidation (or Range): This happens when the price gets stuck, bouncing between a predictable high and low. Neither buyers nor sellers have the upper hand, leading to a temporary standoff.
Spotting the prevailing trend is your first filter. You almost always want to trade with the trend, not against it. This is where the old saying, "the trend is your friend," comes from, and it’s wisdom that has saved countless traders from ruin. Fighting a powerful trend is a surefire way to bleed your account dry.
Drawing Trendlines to Frame Price Action
One of the oldest and still most effective ways to visualize a trend is by drawing a simple trendline. But this isn't about just connecting random dots on a chart; there's a specific technique to it.
For an uptrend, you draw a line connecting at least two significant swing lows. A good trendline should act like a floor, or what we call "dynamic" support. You want to see the price come down, touch the line, and bounce off it multiple times. As long as the price respects this ascending line, the uptrend is healthy and intact.
For a downtrend, you do the opposite: connect at least two significant swing highs. This line acts as a ceiling, or dynamic resistance, stopping any rallies in their tracks. The downtrend is in play as long as the price stays below this descending line. The more times a trendline is tested and holds, the more traders are watching it, and the more significant it becomes.
A well-drawn trendline is more than just a directional guide. It frames the price action, giving you clear boundaries. This helps you pinpoint potential entries, set your stop-loss, and, crucially, spot the exact moment a trend might be losing steam.
Using Moving Averages to Gauge Momentum
Trendlines are fantastic, but let's be honest, they can be a bit subjective. What looks like a perfect trendline to you might look sloppy to someone else. For a more objective view of trend and momentum, traders rely on moving averages (MAs).
A moving average takes all the chaotic price data and smooths it out into a single, easy-to-read line. It cuts through the noise and shows you the underlying trend.
Two of the most popular and widely followed are the 50-day and 200-day moving averages. Think of them as momentum gauges with different time horizons.
- The 50-Day Moving Average: This is your go-to for the medium-term trend. In a strong, healthy uptrend, you'll often see the price pull back to the 50-day MA and find solid support there.
- The 200-Day Moving Average: This is the big one. The 200-day MA is the long-term benchmark. When an asset is trading above its 200-day MA, it's generally seen as being in a long-term bull market. If it falls below, it's considered to be in a bear market.
The real magic happens when you watch how these two moving averages interact with each other. A "Golden Cross" is a classic bullish signal that occurs when the faster 50-day MA crosses above the slower 200-day MA. This tells you that shorter-term momentum is accelerating and could signal the start of a major uptrend.
On the flip side, a "Death Cross"—when the 50-day MA slices below the 200-day MA—is a major bearish warning sign that has preceded some of the biggest market downturns in history. Using these MAs adds an objective, data-driven layer to your analysis, confirming what your hand-drawn trendlines might already be telling you.
Mastering Support and Resistance Levels
If trendlines are the roads on your chart, then support and resistance levels are the roadblocks and major intersections. These are specific price areas where the tug-of-war between buyers and sellers gets really intense, often deciding if a trend will push forward or hit a wall and reverse.
Getting a handle on these zones is a true game-changer for reading stock charts. It's one of those "aha" moments in a trader's journey.
Think of support as a price floor. It’s a level where a downtrend often runs out of steam because buyers start seeing value and step in. As the price drops toward support, the sellers lose their nerve, and the buyers get more aggressive.
Conversely, resistance is a price ceiling. This is where an uptrend can stall out. As price rallies towards this ceiling, sellers are eager to cash in their profits, and new buyers get hesitant. This influx of supply can stop a rally in its tracks.
It’s absolutely critical to see these not as razor-thin lines, but as zones. A stock might dip a little below support or poke its head above resistance before snapping back. The real skill is identifying these broader battlegrounds where control has historically changed hands.
How to Pinpoint Key Support and Resistance Zones
Finding these levels isn't some kind of trading voodoo; it's about studying the chart's history. You're looking for the footprints left behind from past battles. The most reliable S/R zones are the ones that have been tested over and over again.
Here are a few practical ways I spot them on my own charts:
- Past Peaks and Valleys (Swing Highs and Lows): This is the most straightforward and effective method. Look for major turning points in the past. A significant peak is a natural resistance level. A major trough is a natural support level. The bigger the reversal from that level, the stronger the zone.
- Psychological Round Numbers: People are weirdly drawn to simple, round numbers. Prices like $50, $100, or $1000 often act as psychological hurdles. Traders naturally place orders around these figures, creating S/R levels even without any prior price action there.
- Key Moving Averages: As we've touched on, the 50-day and 200-day moving averages often act as dynamic support and resistance. In a strong uptrend, it's amazing how often the 50-day MA will act as a floor for pullbacks.
Pro Tip: When a price smashes through a resistance level, that old ceiling often becomes the new floor. I've seen this happen countless times. This concept, known as "role reversal," is a powerful confirmation signal. The same is true in reverse: a broken support level often becomes the new resistance.
This principle is fundamental to understanding market structure. A stock that finally breaks above $120 resistance might drift back down to test that same $120 level as new support before continuing its climb.
Using Support and Resistance in Your Trading
Okay, so you've found the zones. Now what? This is where the magic happens. These levels provide the framework for a logical trading plan, helping you define your risk and spot opportunities with far more clarity.
A clearly defined support level gives you a logical spot to place a stop-loss. If you buy a stock as it bounces off support, putting your stop just below that zone keeps your potential loss small if you're wrong. The market showed you where the buyers were, and a clean break below that invalidates your trade idea.
In the same way, a resistance level provides a natural profit target. If you buy a stock, the next major resistance area is a logical place to think about taking profits. That's where the sellers are likely waiting. This disciplined approach stops you from getting greedy and watching a winning trade turn into a loser. If you want to go deeper, you can explore a more comprehensive article on support and resistance that covers advanced techniques.
By combining trend analysis with a clear map of these S/R zones, you move from just looking at charts to actually planning your trades strategically. You start to understand not just where the price is, but where it's likely to struggle and where it's likely to find its footing.
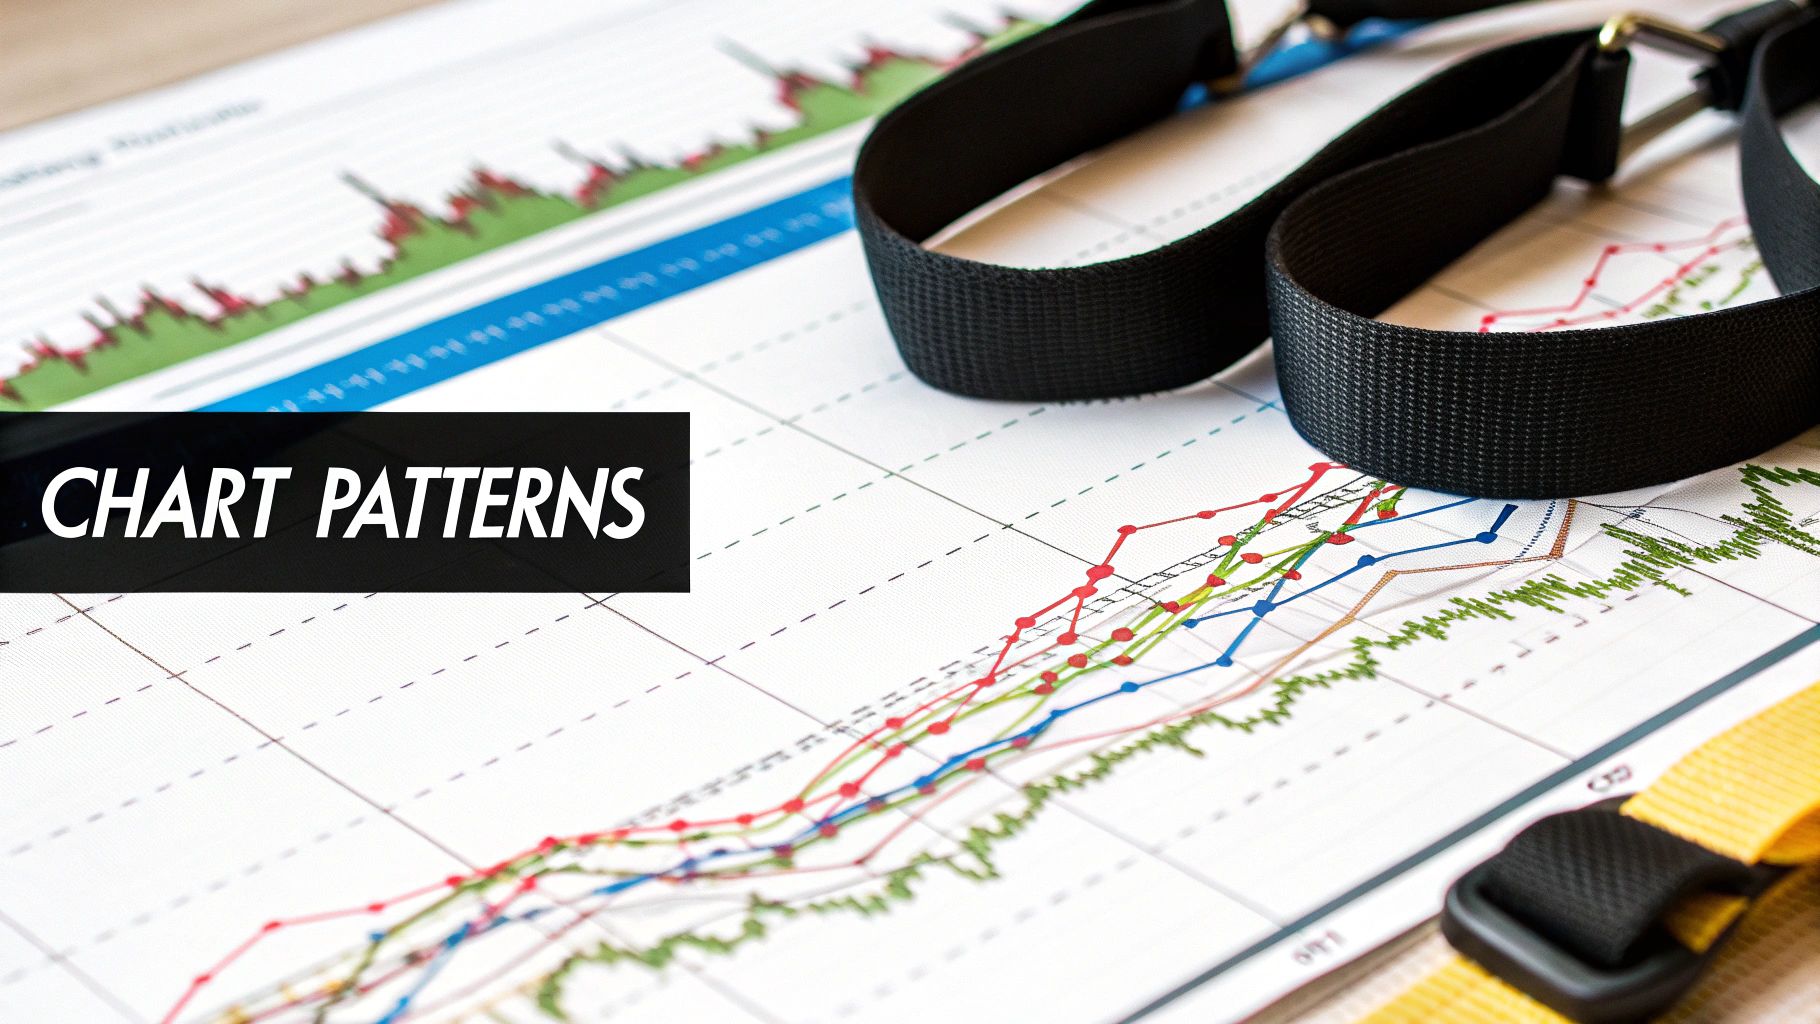
Decoding Candlestick Patterns and Volume
While trends and support/resistance levels give you the big picture, candlestick patterns are the play-by-play. They're the granular, moment-to-moment story of the battle raging between buyers and sellers. If you want to read stock charts with any real precision, learning to decode these miniature stories is non-negotiable.
Each candle tells you four key things: the open, close, high, and low for a specific period. The relationship between these points creates its unique shape. The color shows who won the session—green for the bulls (buyers), red for the bears (sellers)—while the wicks reveal just how far the price traveled before the session ended. A long upper wick, for example, tells you buyers tried to push the price up but were smacked back down by sellers.
The Language of Wicks and Bodies
The real magic happens when you combine the context of the body and the wicks. A candle with a long body and tiny wicks screams conviction. It's pure, unadulterated buying or selling pressure.
On the flip side, a candle with a small body and long wicks on both ends (what we call a Doji) signals total indecision. It’s the visual equivalent of a stalemate, where buyers and sellers fought to a draw. This immediate visual feedback is what makes candlestick analysis so powerful. You're not just looking at numbers; you're interpreting market sentiment as it unfolds.
Key Bullish Candlestick Patterns
Certain patterns love to show up at the bottom of downtrends. They’re a flare in the dark, signaling that buyers are finally stepping in and a reversal could be around the corner. Spotting these can give you a prime entry into a new uptrend.
- The Hammer: This pattern looks just like its name suggests—a short body at the top with a long lower wick. When it appears after a price drop, it shows that sellers tried their best to push the price down, but a huge wave of buyers came in and drove it all the way back up near the open. It’s a classic sign of seller exhaustion.
- The Bullish Engulfing Pattern: This is a powerful two-candle pattern. After a downtrend, a small red candle is followed by a large green candle that completely "engulfs" the body of the previous red candle. It’s a very visual signal that buyers have overwhelmed sellers with aggressive force, marking a major shift in control.
A single candlestick pattern is interesting. But a candlestick pattern that forms at a major support level? That's a high-probability trade setup. Context is everything. Always look for multiple confirming factors before pulling the trigger.
Bearish Patterns to Watch For
Just as some patterns signal a market bottom, others act as a warning sign for a potential top. These usually form after a strong uptrend and suggest that sellers are starting to wrestle back control.
- The Shooting Star: Think of this as the Hammer's evil twin. It has a small body at the bottom and a long upper wick. It shows that buyers pushed the price up confidently, but sellers came in with overwhelming force and slammed it back down. It's a clear red flag that the rally might be over.
- The Bearish Engulfing Pattern: This is the polar opposite of its bullish counterpart. A small green candle is followed by a massive red candle that completely swallows the prior green one. This shows a dramatic and sudden shift where sellers have seized control from the bulls.
These are just a few of the most common patterns. As you gain more screen time, you'll start to recognize dozens of others. To really build out your pattern recognition skills, check out our guide on the top 10 chart patterns every trader should know.
The Ultimate Confirmation Tool: Volume
Now, let's talk about the most important piece of the puzzle. A candlestick pattern without volume is just noise. Volume is the fuel that gives a price move legitimacy. It tells you how many shares traded, revealing the conviction—or lack thereof—behind the move.
Imagine you spot a picture-perfect Bullish Engulfing pattern. It looks great, but if it formed on whisper-thin volume, it means almost nothing. Only a few traders were involved. It’s likely a "head fake" waiting to trap you.
But what if that same pattern forms on a massive spike in volume? That’s a completely different story. It tells you that a huge number of participants—including big institutions—were aggressively buying. That’s the kind of high-octane confirmation you should be looking for.
Here’s how you can put it all together for a powerful trading setup:
- Identify a Key Level: First, find a strong, established support or resistance zone on your chart.
- Watch for a Pattern: Next, wait patiently for a classic reversal pattern (like the ones above) to form right at that level.
- Check the Volume: Finally, look for a significant increase in volume as the pattern completes. This is your final confirmation.
This combination—a key level, a clear pattern, and a surge in volume—is the trifecta. It's one of the most reliable, high-probability setups in technical analysis.
Common Questions About Reading Stock Charts
Even after you get the hang of trends, levels, and patterns, it’s completely normal to have some questions rattling around. Diving into chart analysis is a journey, and hitting a few walls is just part of the process. So, let's go over some of the most common questions I hear from traders who are starting to learn to read stock charts.
Getting these practical hurdles out of the way will help you dodge the usual mistakes and give you the confidence to put what you've learned into practice in the real market.
How Long Does It Take to Get Good at Reading Charts?
This is the question everyone asks, and the only honest answer is: it’s different for everyone. There’s no magic timeline to becoming a master. That said, a lot of traders tell me they start to feel pretty comfortable with the core ideas—like spotting trends and basic support/resistance—within a few months of daily, focused practice.
Don’t make the mistake of trying to learn everything at once. Focus on one single concept until it's second nature. For example, spend a whole week just drawing trendlines on every chart you can find. The next week? Hunt for nothing but Bullish Engulfing patterns. This dedicated, skill-by-skill approach builds a kind of muscle memory way faster than trying to drink from a firehose.
The real aim isn't to cross some imaginary finish line called "mastery." It's about building a solid, dependable skillset through daily screen time and repetition. True competence comes from experience, not a date on the calendar.
What Are the Biggest Mistakes Beginners Make?
New traders almost always fall into a few classic, and often expensive, traps. Just knowing what they are is the first step to avoiding them yourself.
- Analysis Paralysis: This is the big one. Beginners think more indicators must be better, so they pile on five different moving averages, RSI, MACD, and Bollinger Bands all at once. What you get is a mess of conflicting signals and total confusion.
- Ignoring Volume: A price move that doesn't have volume to back it up is a trap. New traders get all excited about a huge green candle but forget to check if the volume confirms the move. A price spike on low volume is usually a sign of weakness, not real strength.
- Forcing Trades: After you learn a new pattern, suddenly you start seeing it everywhere. A beginner might spot something that kinda looks like a Hammer pattern and jump into a trade, even when it’s not sitting on a key support level. Patience is everything; you have to wait for the A+ setups.
My best advice? Start with a completely naked chart. Just focus on pure price action, support/resistance, and volume. Only add one indicator at a time, and only when you know exactly what it’s telling you and how it actually helps your trading strategy.
Do I Need Expensive Software to Analyze Charts?
Absolutely not. This is a huge myth that keeps a lot of people from even starting. Maybe in the old days you needed some pricey software, but today, the free tools available are incredibly powerful.
Most online brokers—like Fidelity, Schwab, or TD Ameritrade—give you excellent charting packages built right in. They come with everything you need: different chart types, a full set of drawing tools, and all the common indicators.
On top of that, platforms like TradingView offer professional-grade charting for free. You can pull up a chart for almost any stock, forex pair, or crypto on a system that’s endlessly customizable. There's zero financial barrier to getting the same tools the pros use. Your journey to learn to read stock charts can start right now, without spending a dime on software.
Ready to move beyond the basics and build a real, profitable trading strategy based on price action? At Colibri Trader, we cut through the noise and provide clear, action-based programs that work. Stop guessing and start trading with a proven method. Take our free Trading Potential Quiz and see where you stand.