


A Trader’s Guide to the Inverted Head and Shoulders Pattern

The inverted head and shoulders pattern is one of the most reliable bullish reversal signals you'll find. It typically shows up at the tail end of a downtrend, signaling that sellers are running out of steam and buyers are getting ready to step in and take charge. Think of it as the market finally finding its footing after a long slide and preparing for a climb back up.
Understanding the Inverted Head and Shoulders Pattern
Imagine a downtrend as a tug-of-war that the bears (sellers) are handily winning. The inverted head and shoulders pattern is that moment when the bulls (buyers) dig in their heels, find a surge of strength, and start pulling the rope back in their favor. This isn't just a random squiggle on a chart; it's a visual story of a power shift from bearish pessimism to bullish hope.
To really get a feel for this pattern, you need to see how its four key parts unfold one by one:
-
The Left Shoulder: After a prolonged fall, buyers make their first real stand, trying to push the price up. But the sellers are still dominant and manage to shove the price back down, creating the first trough.
-
The Head: Feeling overconfident, sellers make one last aggressive push, driving the price to a new, even lower low. This forms the lowest point of the whole pattern—the head. This final plunge often completely exhausts their selling pressure.
-
The Right Shoulder: This is where things get interesting. Buyers now step in with much more conviction. They stop the price from falling to the previous low of the head, creating a higher low. This is a huge clue that the balance of power is shifting.
-
The Neckline: This is a simple resistance line drawn by connecting the two peaks that formed between the shoulders and the head. A clean, decisive break above this line is the confirmation you’re waiting for—it signals the potential start of a brand new uptrend.
The neckline is the trigger. Until the price breaks above it with real momentum, the bullish reversal isn't confirmed. The bears could still be in control.
This pattern is the mirror opposite of its bearish cousin, which you can learn about in our guide to the classic head and shoulders pattern.
Don't just take my word for it—the numbers back it up. Quantitative analysis suggests this pattern has a surprisingly high success rate, estimated to be around 89%. Even more impressive, the data shows it can lead to an average price increase of about 45% after the breakout, which speaks volumes about its power. You can read more on the statistical performance of this pattern to see the data for yourself.
The Story the Market is Telling You
When you see a chart pattern, you're not just looking at lines on a screen. You're watching a battle unfold between buyers (bulls) and sellers (bears). The inverted head and shoulders pattern tells a classic story of a power struggle where the sellers finally run out of steam, and the buyers come charging in to take control.
Getting a feel for this psychological drama is what separates guessing from truly understanding the pattern.

It all starts in a downtrend. Sellers are in the driver's seat, confidently pushing the price lower. Market sentiment is grim, and it feels like every little bounce is just another opportunity for sellers to jump back in and smash the price down again.
The First Cracks Appear
Then, something shifts. The formation of the left shoulder is the first sign of organized resistance. For the first time, a group of buyers decides the price looks cheap and tries to start a rally.
They don't succeed, at least not yet. The sellers are still too strong and quickly shove the price back down. But that initial attempt was important—it planted a tiny seed of doubt.
Next, the sellers go for a knockout punch. They drive the price to a new low, forming the head of the pattern. On the surface, this looks like a huge win for the bears, but it's really a sign of desperation. The fact that the price can't stay down there for long shows that the selling pressure is starting to dry up.
The head is the point of maximum fear and pessimism. Ironically, it's also where the sellers use up the last of their firepower. Their failure to push much lower is the key tell.
The Bulls Make Their Move
Now for the most important part of the story: the right shoulder. After bouncing off the lows of the head, the sellers try to regain control one more time. But this time, the buyers are waiting for them, and they step in with much more conviction.
The buyers successfully defend a higher price level, refusing to let the market make a new low. This is a massive shift in the balance of power.
- Seller Exhaustion: The bears simply don't have the strength to push the price back down to its previous low.
- Buyer Confidence: The bulls are now willing to buy at higher prices, a clear sign their confidence is growing.
This higher low is the final clue that the downtrend is on its last legs. The stage is set for the final act.
The breakout above the neckline is the climax of our story. It's like a starting pistol firing, signaling to everyone watching that the bulls have officially won. This triggers a flood of new buyers who were waiting on the sidelines, pouring fuel on the fire and kicking off the new uptrend. The reversal is complete.
How to Spot the Pattern on a Live Chart
Seeing an inverted head and shoulders pattern on a live chart is about more than just recognizing a familiar shape. It’s about a deliberate process of checking off specific criteria, especially the trend that came before it and what the trading volume is doing. This method helps you separate a genuine, high-potential setup from a fake-out that can cost you money.
First things first, context is everything. This pattern is a bullish reversal, which means it can only show up at the tail end of a clear, established downtrend. If you don't see a solid history of lower lows and lower highs leading into the formation, it's not a valid pattern. A market that's just chopping sideways doesn't have the seller exhaustion needed for this reversal to work.
Your Step-by-Step Visual Checklist
Once you've confirmed the downtrend, you can start hunting for the pattern's key ingredients. Think of it as a story that has to unfold in a specific order.
-
Find the Left Shoulder: This is the first significant low point in the downtrend. After hitting this low, the price should bounce back up a bit, creating the first small peak that helps form the neckline later on.
-
Identify the Head: From that bounce, the price needs to fall again, this time dropping below the low of the left shoulder. This new, deeper low is the "head" and often represents the last big, exhaustive push from the sellers.
-
Confirm the Right Shoulder: The price rallies again from the head's low, then pulls back one more time. Here's the critical part: this final dip (the right shoulder) must be higher than the low of the head. This "higher low" is a huge clue that the sellers are running out of steam.
-
Draw the Neckline: Now, simply connect the peaks of the two bounces—the one after the left shoulder and the one after the head. This trend line is the final line in the sand. A decisive break above this neckline is your trigger to buy.
This visual guide shows you exactly what should be happening with trading volume during each phase. Pay close attention.
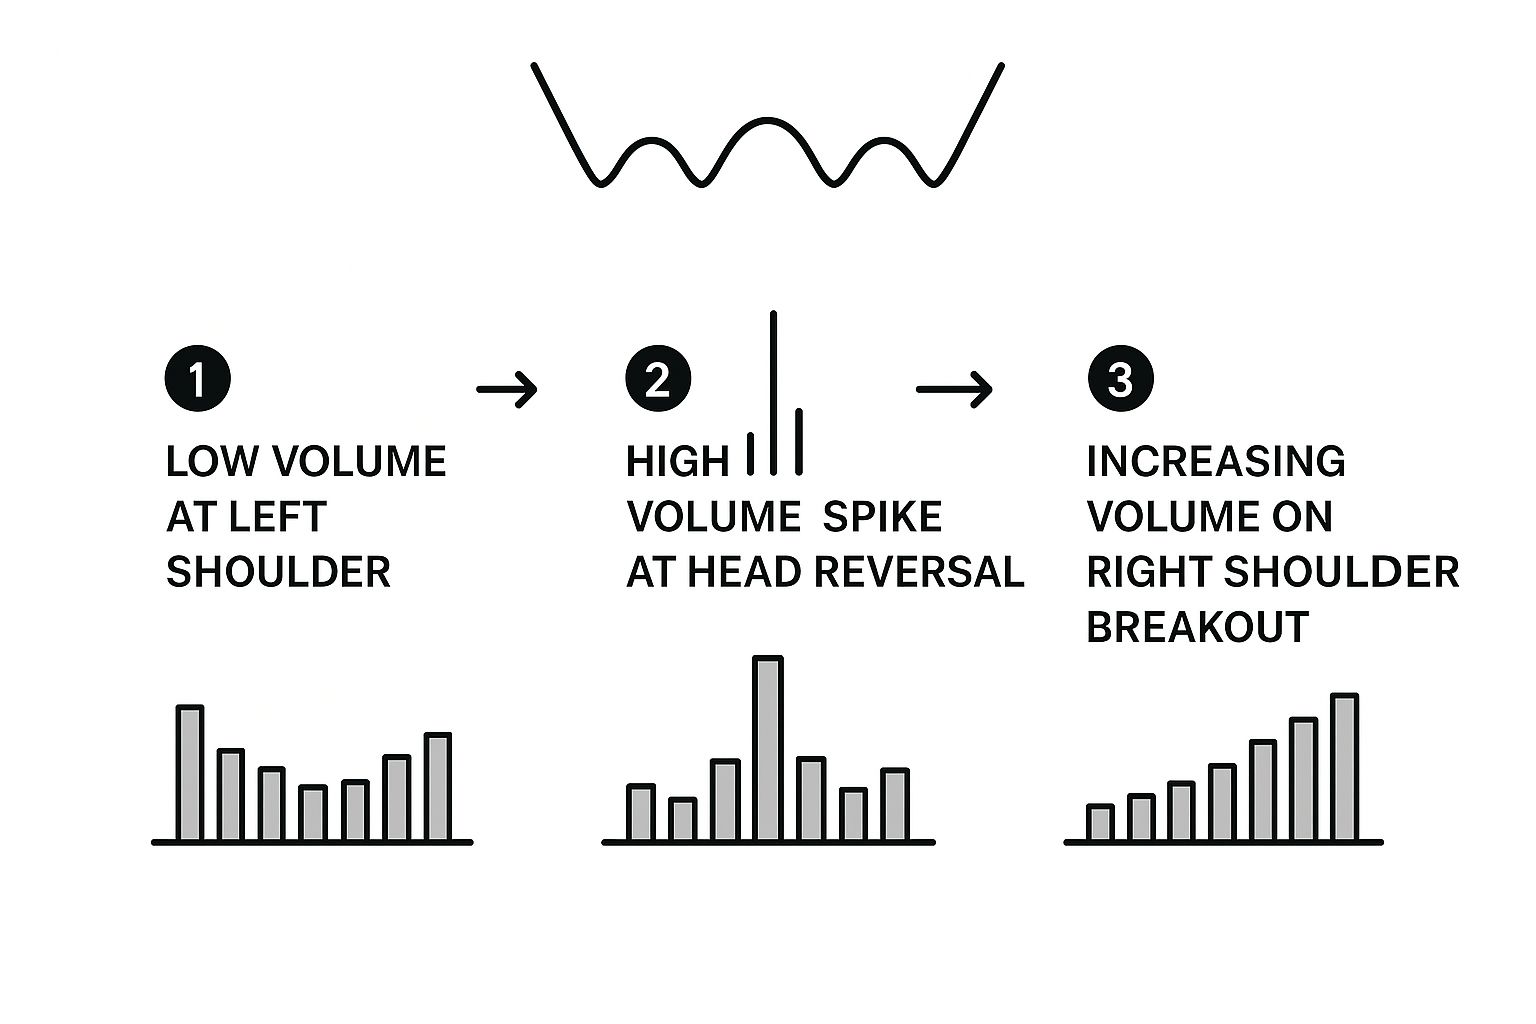
As you can see, the breakout above the neckline needs a big surge in volume. That's your final green light, showing that buyers are stepping in with serious conviction.
Volume: The Ultimate Confirmation Tool
Volume is your lie detector for this pattern. A textbook shape with weak volume is a major red flag. Ideally, you want to see trading volume that’s fairly high as the left shoulder forms, maybe even reaching a peak during the head, and then tapering off noticeably as the right shoulder is created.
A breakout on low volume is a warning sign you can't ignore. It tells you there's no real muscle behind the move, making it much more likely to fail. You're looking for a powerful spike in volume as the price punches through the neckline.
This volume surge confirms that big players and institutional money are likely behind the move, giving it the fuel needed to start a brand new uptrend. Understanding these nuances is crucial, and you can learn more about how to read stock market charts in our comprehensive guide.
Before placing a trade, it's always smart to run through a quick checklist to make sure all the pieces are in place.
Pattern Identification Checklist
| Component | What to Look For | Importance |
|---|---|---|
| Preceding Trend | A clear and established downtrend. | Crucial: No downtrend, no reversal pattern. |
| Left Shoulder & Head | The head must form a lower low than the left shoulder. | High: Confirms the final push of seller exhaustion. |
| Right Shoulder | Must form a higher low than the head. | High: This is the first clear sign that selling pressure is fading. |
| Neckline | A relatively straight trend line connecting the two peaks. | Medium: Defines the breakout point. It can be horizontal or sloped. |
| Volume Signature | Volume decreases on the right shoulder, then surges on the breakout. | Crucial: The volume surge confirms buyer conviction and pattern validity. |
| Breakout | A decisive close above the neckline. | High: This is the entry signal that confirms the pattern is active. |
Using this checklist helps you stay objective and avoid jumping into trades based on patterns that only "look" right. It forces you to confirm that the underlying market psychology matches the visual shape.
Building a Complete Trading Strategy
Spotting a clean inverted head and shoulders pattern is a great start, but it's really just the first step. To actually make money from it, you need a solid plan. That means knowing exactly where you’ll get in, where you’ll get out if you’re wrong (your stop-loss), and where you’ll take profits if you’re right. Without these three components, you're not trading—you're just gambling.
A well-thought-out strategy is what transforms a promising pattern on a chart into a genuine low-risk, high-reward opportunity. It takes the emotion out of your trading and replaces it with disciplined, repeatable actions. That’s the secret sauce of every consistently successful trader I know.

Pinpointing Your Entry Point
So, the price has just broken through the neckline. Now what? You have a decision to make, and there are basically two ways to play it. Each comes with its own set of pros and cons.
-
The Aggressive Entry: This is for traders who don't want to miss the boat. You jump into the trade as soon as a candle closes decisively above the neckline. Ideally, you want to see a big spike in volume on that breakout candle to confirm the move has legs. The upside? You're in early. The downside? You run a higher risk of getting trapped in a "false breakout" if the price quickly reverses.
-
The Conservative Entry: This one requires a bit more patience. Instead of buying the initial breakout, you wait. You let the price move up and then see if it pulls back to retest the old neckline, which should now act as a new floor of support. Entering after the price bounces off this retest gives you much stronger confirmation that the breakout is the real deal. The only risk here is that the price might just keep running without ever pulling back, and you miss the trade entirely.
Which one is better? It really comes down to your personal risk tolerance and what the market is doing at the moment. Aggressive entries can work wonders in fast-moving, volatile markets. In calmer conditions, waiting for the retest often gets you a much better entry price.
Setting a Protective Stop-Loss
Your stop-loss is your lifeline. It's the point you decide, before you even enter the trade, where you'll cut your losses and live to fight another day. For the inverted head and shoulders, the most logical spot is just below the low of the right shoulder.
Placing your stop-loss below the right shoulder's low gives the trade room to breathe. This level represents the last point of buyer defense; if the price falls below it, the entire bullish premise of the pattern is likely invalidated.
This placement isn't random; it's strategic. It's far enough away that you won't get shaken out by normal market fluctuations, but it's close enough to protect your capital if the pattern ultimately fails. Getting a handle on where and why you place these orders is crucial, something covered in depth here: https://www.colibritrader.com/how-to-set-stop-loss/.
Calculating Your Profit Target
Okay, so where are we heading? The classic textbook method for setting a profit target is beautifully simple and objective. It gives you a minimum price objective based on the size of the pattern itself.
- Measure the Distance: First, measure the vertical distance from the lowest point of the head straight up to the neckline.
- Project the Distance: Now, take that same measurement and add it to the breakout point on the neckline.
That projected price level is your minimum profit target. It’s a great place to think about taking some or all of your profits off the table. Of course, a truly robust trading plan goes beyond just chart patterns; it also considers how each trade fits into your bigger financial picture. Understanding how to calculate IRR for smarter investments can help you evaluate performance across all your strategies, blending technical targets with sound financial metrics.
A Real-World Example of the Pattern in Action
Theory is one thing, but seeing how an inverted head and shoulders pattern actually plays out on a live chart is where the rubber meets the road. Let's step away from the textbook diagrams and look at a real trade setup to see how all these pieces—the psychology, the structure, the entry—come together.
A fantastic, almost picture-perfect example of this pattern showed up on the chart for Solar Capital Ltd. (SOCL) a while back. It’s a great case study because it clearly shows the pattern forming right after a long, grinding downtrend, which is exactly the context we want to see for a powerful bullish reversal.
Deconstructing the SOCL Chart
Before the pattern even started to form, the stock was in a clear, sustained downtrend. That's the first box we need to tick. The market was bearish, sellers were in control, and that’s the perfect environment for a potential bottom to form. Then, slowly but surely, the classic formation began to emerge.
- The Components: First, we saw the left shoulder take shape. This was followed by a deeper dip that formed the head. The key moment, though, was the rally and subsequent pullback that created the right shoulder. That higher low was the first real clue that the sellers were starting to run out of steam.
- The Neckline: A very clear line of resistance—the neckline—formed right around the $18.18 mark. For anyone watching this chart, that price level became the line in the sand.
The breakout was the moment of truth. When the price finally punched through that $18.18 neckline, it did so with a significant surge in trading volume. That's not just a minor detail; it's the confirmation. The spike in volume showed that big money was stepping in with conviction. It was the market's way of saying, "This reversal is real."
A breakout without a jump in volume is just noise. That volume surge on the SOCL chart was proof that institutional buyers were behind the move, giving traders the confidence to jump in.
Once the breakout was confirmed, it was time to map out the potential profit targets. By measuring the distance from the bottom of the head up to the neckline, traders could project that same distance upward from the breakout point.
Sure enough, the stock hit its first calculated price target by the end of May and blew past the second target by mid-July, beautifully demonstrating the predictive power of this pattern. If you want to dive deeper into this specific example, there's a great analysis of this classic chart pattern on Topstep's blog. This is exactly why traders learn to spot the inverted head and shoulders—it can be a remarkably reliable signal for catching major trend changes early on.
Common Mistakes to Avoid When Trading This Pattern

Even a textbook-perfect inverted head and shoulders can end in a loss if you stumble into a few common trading traps. Often, the line between a profitable trade and a losing one comes down to avoiding these surprisingly frequent errors. More than anything, discipline is your best friend here.
A lot of traders, gripped by the fear of missing out (FOMO), will jump the gun and enter a trade the second the price touches the neckline. This is a classic rookie mistake. The pattern isn't confirmed until a candle closes decisively above that resistance level.
Entering too early exposes you to a nasty false breakout, where the price pokes its head above the line only to get smacked right back down. Be patient. Wait for that confirmed close before you even think about putting your capital at risk.
Overlooking Volume Confirmation
Another huge pitfall is ignoring what the volume is telling you. The whole story of this pattern is about sellers running out of steam and buyers stepping in with real conviction. If the price breaks the neckline on weak, pathetic-looking volume, that’s a massive red flag.
That lack of volume suggests there’s no big money—no institutional power—behind the move. It’s like a car trying to accelerate up a hill with an empty gas tank; it just isn't going to get very far. You should always look for a noticeable spike in volume to prove the breakout has real strength.
A breakout without a strong volume surge is not a high-probability trade. It’s a warning sign that the move lacks the fuel needed to kick off a new uptrend and could easily fizzle out.
Finally, sloppy risk management will destroy even the best trade setup. Two missteps are particularly common:
- Setting Your Stop-Loss Too Tight: Placing your stop just a few ticks below the neckline is asking to get shaken out by random market noise. You need to give the trade some breathing room by setting your stop below the low of the right shoulder.
- Chasing the Price: If you miss the ideal entry point, just let it go. Don't chase the trade higher. A late entry completely torpedoes your risk-to-reward ratio, turning what was a great setup into a terrible one. There will always be another trade.
Frequently Asked Questions
Even after you get the hang of the inverted head and shoulders pattern, a few common questions always seem to pop up. Let's tackle them head-on to clear up any confusion and get you trading this setup with more confidence.
What's the Best Timeframe to Use?
You'll spot the inverted head and shoulders on pretty much any chart you pull up, from a 5-minute intraday chart to a weekly one. The key difference, though, is how much weight you should give it. Generally, the longer the timeframe, the more reliable the signal.
Think of it this way: a pattern that takes weeks to form on a daily chart has a lot more significance behind it. It usually points to a major, longer-lasting shift in the trend. On the flip side, a pattern that pops up on a 5-minute chart might just lead to a quick, short-lived rally.
For swing and position traders, sticking to the daily and weekly charts is almost always the best bet. The signals are cleaner, and the trends that follow tend to have real staying power.
Does the Pattern Have to Be Perfectly Symmetrical?
Not at all. If you wait for a perfect, textbook-symmetrical pattern, you'll be waiting forever. Real-world charts are messy, and you have to learn to work with what the market gives you.
The shoulders don't need to match in size or price. The neckline is rarely a perfectly straight horizontal line—in fact, sloped necklines are incredibly common and work just fine. Don't get hung up on the visuals. Focus on what the pattern is telling you about the psychology of the market.
What truly matters is the underlying structure:
- You need to see an established downtrend first.
- The head must mark a clear lower low than the left shoulder.
- Crucially, the right shoulder has to form a higher low than the head.
What if the Price Breaks Out on Low Volume?
A breakout on weak or declining volume is a massive red flag. You should be extremely skeptical of it.
What we want to see is a powerful surge in volume as the price breaks through the neckline. That's your confirmation—it tells you that big buyers are jumping in with conviction and putting real money to work.
Without that volume spike, you have a much higher risk of a "false breakout." This is a classic trap where the price pokes above the neckline just long enough to suck in hopeful buyers, only to crash right back down. Many seasoned traders will completely ignore an otherwise perfect inverted head and shoulders pattern if that volume confirmation isn't there.
At Colibri Trader, we teach you how to read the story of price action and volume to make disciplined, high-probability trades without a chart full of confusing indicators. Discover your trading potential by taking our free quiz today.