


Trading the Inverted Head and Shoulder Pattern Profitably

Among the classic chart patterns, the inverted head and shoulder is one of the most reliable signs that a downtrend is losing steam. When you see this formation taking shape, it's a powerful clue that the bears are exhausted and the bulls are quietly taking over. It’s a signal that a market bottom might be in, and a new uptrend is on the horizon.
Understanding This Powerful Bullish Reversal Signal
Think of a prolonged downtrend as a brutal tug-of-war where the sellers have been dominant, dragging the price lower and lower. The inverted head and shoulders pattern isn’t just some random shape on your chart; it’s the visual story of the exact moment the tide turns.
It’s the footprint left behind by a critical shift in market psychology, moving from widespread bearish fear to the first whispers of bullish hope.

The Tug-of-War Analogy
This battle for control unfolds in three key phases:
- The First Stand (Left Shoulder): Sellers give a strong pull, pushing the price down. But for the first time in a while, buyers dig in and fight back, causing a respectable rally. This is the first crack in the sellers' dominance.
- The Final Push (The Head): The sellers muster all their remaining strength for one last, desperate heave, driving the price to a new low. But they're spent. Buyers see this exhaustion as an opportunity and launch an even stronger counter-attack, pushing the price all the way back up.
- The Winning Pull (Right Shoulder): Sellers try one more time to push the price down, but their effort is weak. They can't even get close to the previous low. This higher low is the smoking gun—it proves the buyers are now in control, stepping in with more confidence and capital.
This sequence tells a clear story: sellers are losing their grip with every attempt. The resistance line that connects the peaks of the rallies between these three lows is called the neckline. Once the price breaks cleanly through that neckline, the tug-of-war is over. The bulls have won, and the reversal is confirmed.
To get a better feel for reading these subtle shifts in market control, you can dive deeper into what is price action trading in our complete guide.
Core Components at a Glance
Before you can trade this pattern, you need to be able to spot its key anatomical features. Each part tells a piece of the story, and understanding their roles is essential for making smart trading decisions.
The beauty of the inverted head and shoulder pattern lies in its clarity. It visually maps out the exhaustion of sellers and the emergence of buyers, providing a logical basis for a bullish trade entry.
Here’s a quick breakdown of the five core components. Get familiar with them, because in the next section, we’ll dig into the psychology behind each one.
Anatomy of the Inverted Head and Shoulder Pattern
| Component | Description | What It Signals |
|---|---|---|
| Preceding Downtrend | The market must be in a clear downtrend for this to be a true reversal pattern. | Sets the stage for a potential bottoming process. |
| Left Shoulder | The first significant low in the pattern, which is followed by a rally. | The first signs of seller fatigue and buyer interest. |
| Head | The absolute lowest point of the entire formation, created after the left shoulder. | The final, failed attempt by sellers to push prices down; peak pessimism. |
| Right Shoulder | A higher low that forms after the head, often symmetrical to the left shoulder. | Confirmation that buyers are gaining strength and confidence. |
| Neckline | The resistance line drawn across the peaks between the shoulders and the head. | The critical breakout level that validates the bullish reversal. |
Memorizing this table will help you quickly identify high-probability setups as they form in real-time.
The Anatomy of a Market Reversal
To really get a feel for the inverted head and shoulder pattern, you have to stop seeing it as just a shape on your chart. Think of it as the story of a power struggle, a plot twist where the sellers finally run out of steam and the buyers take over. Understanding this narrative is what separates traders who get faked out from those who catch the real move.
First things first, this entire setup is only valid if it shows up after a preceding downtrend. This part is non-negotiable. It's a reversal pattern, and you can't have a reversal without a clear trend to reverse. That downtrend is the context; it sets the stage with the bearish mood that the pattern is about to shatter.
The Left Shoulder: First Signs of a Fight
The story kicks off with the left shoulder. The market is in its downtrend, and sellers push the price to a new low, just as you'd expect. But then something different happens—instead of grinding lower, the price rallies back up with surprising energy.
This is your first clue. It’s a whisper that maybe, just maybe, the sellers aren't as dominant as they were. This rally shows that a fresh wave of buyers has stepped in, ready to absorb the selling pressure. The left shoulder is that first hint of seller fatigue and the bulls mounting their first real defense.
The Head: The Bears’ Final Stand
Spooked by that rally, the sellers regroup and give it one last, powerful shove downward. They manage to drive the price to a new, lower low, which forms the head of the pattern. This is the moment of peak pessimism, where it looks like the downtrend is here to stay.
But their victory is incredibly brief. Buyers flood back in with even more conviction, pushing the price all the way back up to where the last rally fizzled out. This aggressive rebound from the absolute low is a massive red flag for anyone who's short. The bears threw their best punch and the market just shook it off, a classic sign they're exhausted.
The Right Shoulder: The Shift in Power
Now the tide really begins to turn. The sellers try to push the price down again, but their heart isn't in it. Their attempt is weak, shallow, and unconvincing. They can't even get close to the low of the head, and often they fail to even match the low of the left shoulder. This higher low creates the right shoulder.
This is arguably the most important piece of the puzzle. The fact that the right shoulder can't make a new low is the clearest sign yet that sellers have lost their nerve. Buyers are now stepping in sooner and with more confidence.
The symmetry of the pattern tells a compelling story of dying bearish momentum. A textbook example of this played out in December 2015 with the Social Media ETF (SOCL). After a long downtrend, the left shoulder formed near $16.50, the head bottomed out at $15.80 during the peak of the selling, and the right shoulder carved out a higher low around $17.00. This structure was a classic signal of bear exhaustion.
The Neckline: The Definitive Barrier
The final piece that ties everything together is the neckline. This is simply a line drawn across the peaks of the two rallies—the one after the left shoulder and the one after the head. It might be horizontal or it might be sloped, but its job is always the same: it’s the line in the sand.
Think of the neckline as the final barrier. As long as the price is trading below it, the bears are still technically in the game. But the moment the price breaks through that line with conviction, the bullish takeover is confirmed. A clean, decisive close above the neckline tells you the tug-of-war is over, the downtrend is officially dead, and a new uptrend is likely getting started.
To see how this works in reverse, you can check out our complete guide on the classic bearish head and shoulder pattern.
A Practical Guide to Trading the Pattern
Spotting an inverted head and shoulders pattern is one thing, but trading it profitably is a different game entirely. Moving from chart theory to real-world execution demands a clear, disciplined framework. Let's break down the step-by-step process for trading this powerful bullish signal, focusing on the three essential stages: identification, confirmation, and execution.
A solid trading plan is what separates professional traders from gamblers. It removes emotion and guesswork from the equation. By defining your exact entry trigger, stop-loss, and price target before you even think about clicking the buy button, you can act with confidence when the pattern fires. This proactive approach is the bedrock of consistent, long-term success.
The chart below lays out the sequence of this market reversal, from the bears' final push in the left shoulder to the ultimate confirmation when buyers decisively take control.
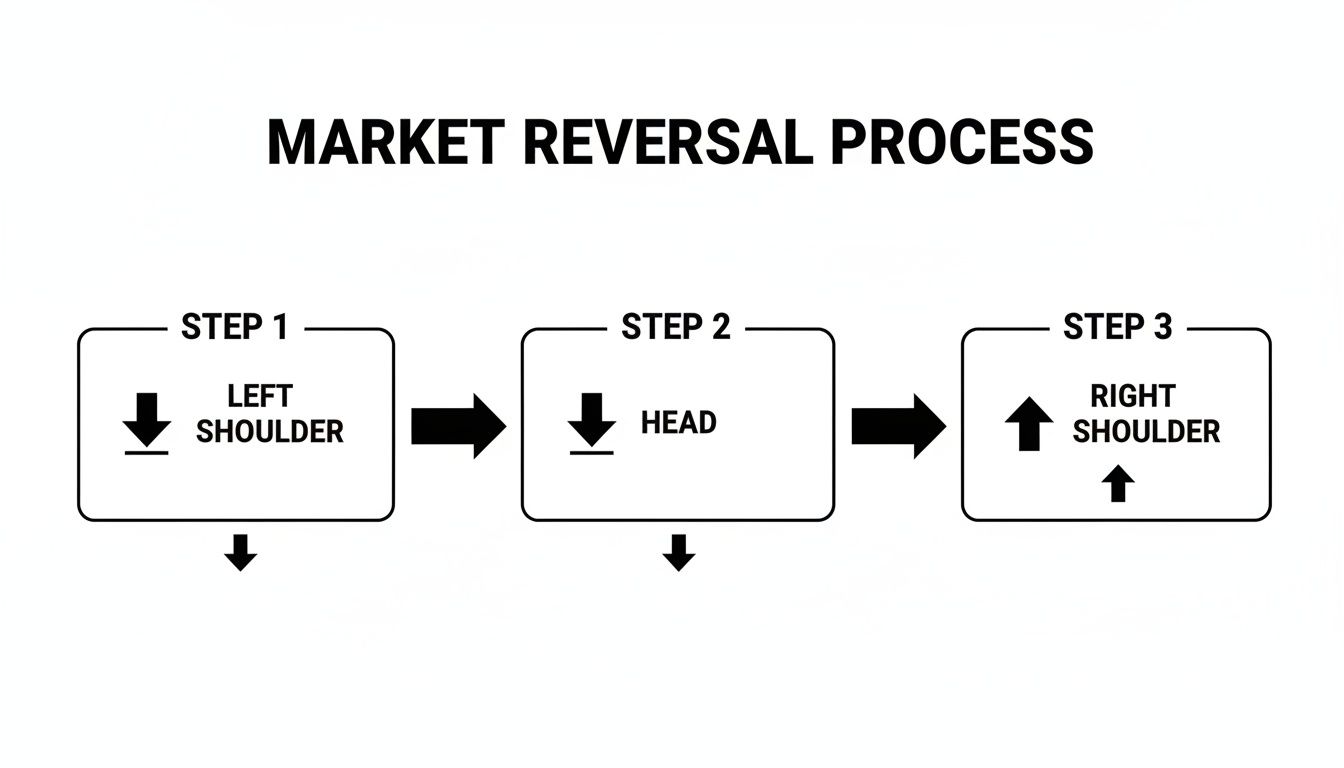
This process perfectly illustrates the gradual exhaustion of sellers and the corresponding rise of buyers, all culminating in a clear breakout signal.
The Entry Trigger: Waiting for Decisive Action
The make-or-break moment when trading an inverted head and shoulders is the breakout. That neckline acts as the final line in the sand—the last barrier of resistance. When the price slices through it, the market is signaling that the bulls have won the battle. Patience here is everything.
Jumping the gun before a confirmed break is one of the most common and costly mistakes a trader can make. Your entry trigger should be nothing less than a decisive candle close above the neckline. This simple rule helps you sidestep "fakeouts," where the price briefly pokes its head above the line only to get smacked back down by sellers. Waiting for that close proves the buyers had the strength to hold that higher ground for the entire session.
For traders interested in automating their strategies, exploring crypto trading bot development can offer ways to programmatically enforce this discipline, ensuring entries only occur after a confirmed candle close.
Stop-Loss Placement: Your Safety Net
Let's be clear: no chart pattern works 100% of the time. That’s why risk management is non-negotiable. Your stop-loss order is your built-in safety switch, designed to protect your capital if the pattern unexpectedly fails.
The most logical and effective place to set your stop-loss is just below the low of the right shoulder. Here’s why this placement makes so much sense:
- It follows the pattern's logic: The right shoulder is the exact point where buyers stepped back in with renewed force, creating that crucial higher low. If the price falls back below this level, the entire bullish story falls apart.
- It gives the trade room to breathe: Placing it just below that swing low accounts for normal market noise and volatility, preventing you from getting stopped out prematurely on a random wick.
A well-placed stop-loss isn't a sign of fear; it's the mark of a professional who respects risk. It defines your maximum loss upfront, allowing you to trade with a clear and objective mind.
Calculating the Price Target
Once you're in the trade, you need a logical destination for taking profits. The inverted head and shoulders pattern gives us a classic, time-tested method for projecting a minimum price target, based on the height and volatility of the formation itself.
Just follow these simple steps:
- Measure the Vertical Distance: Calculate the distance from the absolute low of the head straight up to the neckline. For example, if the head is at $95 and the neckline is at $105, the distance is $10.
- Project from the Breakout: Take that measured distance ($10 in our example) and add it to the price where the breakout occurred.
- Set Your Target: If the price broke out at $105, your minimum price target would be $115 ($105 + $10).
This "measured move" objective provides a data-driven target, helping you avoid the emotional traps of closing a winning trade too early or greedily holding on for unrealistic gains.
The Role of Volume as a Final Confirmation
Volume is a powerful tool that can dramatically increase your confidence in a breakout. Think of volume as the fuel propelling the price move. A breakout that happens on weak, anemic volume is suspicious and has a much higher chance of failing.
What you want to see is a clear surge in trading volume as the price punches through the neckline. This spike in activity confirms that a large number of market participants—including the big institutions—are backing the move. It signals conviction and adds a huge degree of validity to the breakout. To get a better handle on this critical skill, you can learn more about how to trade breakouts with our in-depth guide.
Real Chart Examples and Statistical Performance
Theory is one thing, but seeing the inverted head and shoulders pattern play out on a live chart is where real confidence is built. This pattern isn't just some abstract idea from a textbook; it’s a tangible footprint left by buyers overpowering sellers. You’ll find it across all markets—from major stock indices to the most volatile cryptocurrencies—because it’s driven by universal human psychology.
Let's move past the diagrams and see how these setups actually unfold in the wild.
I’m going to walk you through a classic, high-stakes example that literally marked one of the most significant market bottoms in recent history. This will show you exactly how the pieces of the puzzle—the shoulders, head, and neckline—all come together to signal a powerful trading opportunity.
A Historic Bottom in the S&P 500
Picture the market in early 2020. The COVID-19 crash was in full swing, hammering global markets with panic and relentless selling pressure. It was chaos. But amid that fear, a perfect textbook inverted head and shoulders began to form on the S&P 500's daily chart.
The left shoulder took shape in late February, the "head" carved out the absolute market low on March 23, and the right shoulder established a critical higher low on April 3. When the price finally blasted through the neckline on April 6 with a massive surge in volume, it was the definitive confirmation of a bullish reversal. This single pattern kicked off a historic rally that sent the S&P 500 soaring 45% in just a few months.
This wasn’t just a lucky bounce. It was a technically validated reversal, and it’s why professional traders respect this pattern so much. Decades of backtested data show the inverse head and shoulders has an impressive 89% success rate for calling reversals from downtrends, often leading to average price gains of around 45% after the breakout. You can discover more insights about these historical findings and what they mean for your trading.
Statistical Reliability: A Quantifiable Edge
The S&P 500 example wasn’t a fluke. The reason seasoned traders pay close attention to this pattern is because it offers a quantifiable statistical edge. While no setup is ever a sure thing, this formation has proven its reliability time and time again.
Here’s what makes it so robust from a numbers perspective:
- High Success Rate: As mentioned, independent studies often show success rates topping 80% when the pattern is well-formed and confirmed with a volume-supported breakout.
- Clear Profit Targets: The measured move objective gives you a logical price target. This isn't guesswork; it’s a data-driven way to plan your exit.
- Defined Risk: The structure gives you a clear invalidation point—usually the low of the right shoulder—for placing a tight, logical stop-loss.
This combination of a high probability of success, a logical target, and a defined risk level is the holy trinity of a great trading setup.
The power of the inverted head and shoulders isn't just in its visual shape, but in its proven track record. It’s a pattern that tells you not just when to buy, but also where to place your stop and where to aim for profits, all backed by historical data.
Spotting the Pattern Across Different Markets
The beauty of price action is that it's a universal language. The same human emotions of fear and greed that shape the S&P 500 are at play in forex, crypto, and individual stocks. As a result, the inverted head and shoulder pattern appears consistently across all of them.
- Forex (EUR/USD): You might spot this forming at the end of a multi-week downtrend on a 4-hour chart, signaling a potential shift in the currency pair's direction.
- Cryptocurrency (Bitcoin): After a brutal bear market, Bitcoin has historically carved out massive inverted head and shoulders patterns on its weekly chart, often preceding epic bull runs.
- Individual Stocks (AAPL): Even on a smaller timeframe like a 1-hour chart, a company like Apple might form this pattern after a sharp sell-off, presenting a solid opportunity for a swing trade.
Once you learn to recognize its core structure, you can apply this powerful reversal signal to any market you choose to trade. It’s a skill that stays with you for your entire trading career.
Common Pitfalls and Advanced Trading Tactics
Spotting an inverted head and shoulders pattern is a great first step, but moving from recognition to consistent profit means learning to navigate the messy reality of the live market. No chart pattern is a magic bullet. Understanding why they fail is just as crucial as knowing why they succeed—this is what separates a promising setup from a profitable trade.
The single biggest mistake I see traders make is jumping the gun. It’s classic FOMO. They see the price touch the neckline and immediately hit the buy button, terrified of missing the move. This is a rookie error. You’re essentially buying straight into a wall of resistance before the bulls have proven they can actually break through it.
Another major red flag is ignoring volume. A breakout that happens on weak, dwindling volume screams a lack of conviction from buyers. It’s a huge warning sign that the move is likely a "fakeout" just waiting to reverse back below the neckline. What you want to see is a significant spike in volume to confirm the breakout has real power behind it.
Mastering Pattern Variations
Textbook examples are clean. Real charts are messy. One of the most common curveballs the market will throw at you is a slanted neckline.
- Upward Sloping Neckline: This is actually a sign of underlying strength. It shows that buyers are getting more aggressive even before the breakout, as the rallies between the troughs are already making higher highs.
- Downward Sloping Neckline: This one calls for a bit more caution. While the pattern is still valid, it reveals some weakness. A breakout here needs to be exceptionally strong, with powerful volume, to be trustworthy.
The key is to adapt. Don’t just throw a pattern away because the neckline isn't perfectly horizontal. Instead, adjust your strategy and demand stronger confirmation when the setup isn’t picture-perfect.
"A common misconception hypes the inverted head and shoulders success rate, but real-world data paints a more realistic picture. True reliability, around 60-70%, hinges on proper structure, volume confirmation, and a decisive neckline break."
This pragmatic view is backed up by market history. Following the FTX collapse in late 2022, Bitcoin formed a massive inverted head and shoulders on the weekly chart. The breakout in January 2023 was driven by enormous volume and kicked off a 150%+ rally. However, a deeper dive shows that while 63% of these patterns hit their price target after a breakout, about 45% first pull back to retest the neckline. Explore more insights on these success rates at TradingView.
Advanced Entry Tactic: The Neckline Retest
For more conservative traders, waiting for the price to pull back and retest the neckline offers a fantastic, lower-risk entry point. After the initial breakout, it's very common for the price to fall back and "kiss" the old resistance level (the neckline), which should now act as new support.
This patient approach gives you two huge advantages:
- Better Risk-Reward: Entering on the retest allows for a much tighter stop-loss placed just below the neckline, dramatically improving your potential risk-to-reward ratio.
- Higher Confirmation: When the price successfully bounces off the neckline, it’s a powerful confirmation that the market has accepted the new level. The bulls are now in control and defending their territory.
To execute this, watch for the price to return to the neckline and then print a clear bullish price action signal, like a pin bar or an engulfing candle. This is your high-probability trigger to enter the trade.
Frequently Asked Questions
Even after you understand the mechanics of the inverted head and shoulders pattern, questions always pop up when you're facing a live chart. Let's tackle the most common ones I hear from traders. My goal here is to give you direct, practical answers that will help you bridge the gap from theory to real-world execution.
Think of this as the final checklist before you take your next trade, clearing up any lingering doubts so you can act with confidence.
What Is the Most Important Confirmation Signal?
If you had to pick just one thing, the single most crucial confirmation is a decisive candle close above the neckline. This is the moment of truth.
A quick poke above the line that immediately sells off means nothing. You need to see the buyers prove they can seize that ground and hold it for the entire trading session. This powerful close validates the entire bullish story the pattern has been building for days or weeks. It’s the final signal that the sellers' last line of defense has crumbled.
A close second, and a massive odds-enhancer, is a significant increase in trading volume on that breakout candle. When you see a huge surge in activity, it tells you the big money is participating. That spike in volume shows conviction and dramatically lowers the chances of a nasty "fakeout." A strong close on high volume is the market giving you a bright green light.
Can This Pattern Fail and How Do I Protect Myself?
Yes, absolutely. And you must trade with the mindset that any pattern can and will fail. That’s not pessimism; it’s professional risk management. No chart pattern is a crystal ball. An unexpected news event or a sudden shift in market sentiment can wreck even the most picture-perfect setup.
Your number one defense is a non-negotiable, pre-planned stop-loss order. This is your safety net, and you trade with it every single time.
The most logical place for your stop-loss is just below the low of the right shoulder. This spot is strategic for a few key reasons:
- Pattern Invalidation: The right shoulder is the higher low that proved buyers were stepping in with more force. If the price breaks back below that level, the bullish structure is broken. Your reason for being in the trade is gone.
- Defined Risk: Placing your stop here lets you calculate your exact dollar risk before you even click the "buy" button. This takes the emotion out of it and allows you to size your position properly.
- Breathing Room: It gives the trade enough space to handle the normal noise and volatility of the market without getting wicked out prematurely.
A well-placed stop-loss isn't a sign you expect to lose. It's the hallmark of a professional trader who respects risk and ensures that one bad trade can never take them out of the game.
By always defining your exit point for a loss, you can trade with a clear head, knowing your downside is capped no matter what the market throws at you.
How Do I Calculate the Price Target?
One of the best things about the inverted head and shoulders pattern is that it gives you a logical price target right on the chart. This technique, called the "measured move," provides a data-driven objective based on the height of the formation itself. It helps you set a realistic profit goal, so you're not closing the trade too early out of fear or holding on too long out of greed.
The calculation is simple. Just two steps:
- Measure the Height: First, find the vertical distance from the lowest point of the head straight up to the neckline. Let's say the head is at $50 and the neckline is around $58. The height of the pattern is $8.
- Project from the Breakout: Now, take that same height ($8) and add it to the price where the breakout occurred. If the candle closed above the neckline at $58.20, your minimum price target would be $66.20 ($58.20 + $8).
This measurement gives you a minimum objective. Many professional traders use this level as their primary target, where they’ll take off at least a portion of their profits. A more advanced approach is to sell part of your position at this first target and then trail your stop-loss on the remaining piece to capture more upside if the new trend turns out to be a powerful one.
At Colibri Trader, we focus exclusively on teaching these kinds of pure price-action strategies, helping you read the market's story without the clutter of indicators. If you're ready to build a consistent, repeatable trading process based on proven patterns, explore our educational programs and start your journey at https://www.colibritrader.com.