


Inverted Hammer Candle Pattern: Identify, Confirm, and Trade Bullish Reversals
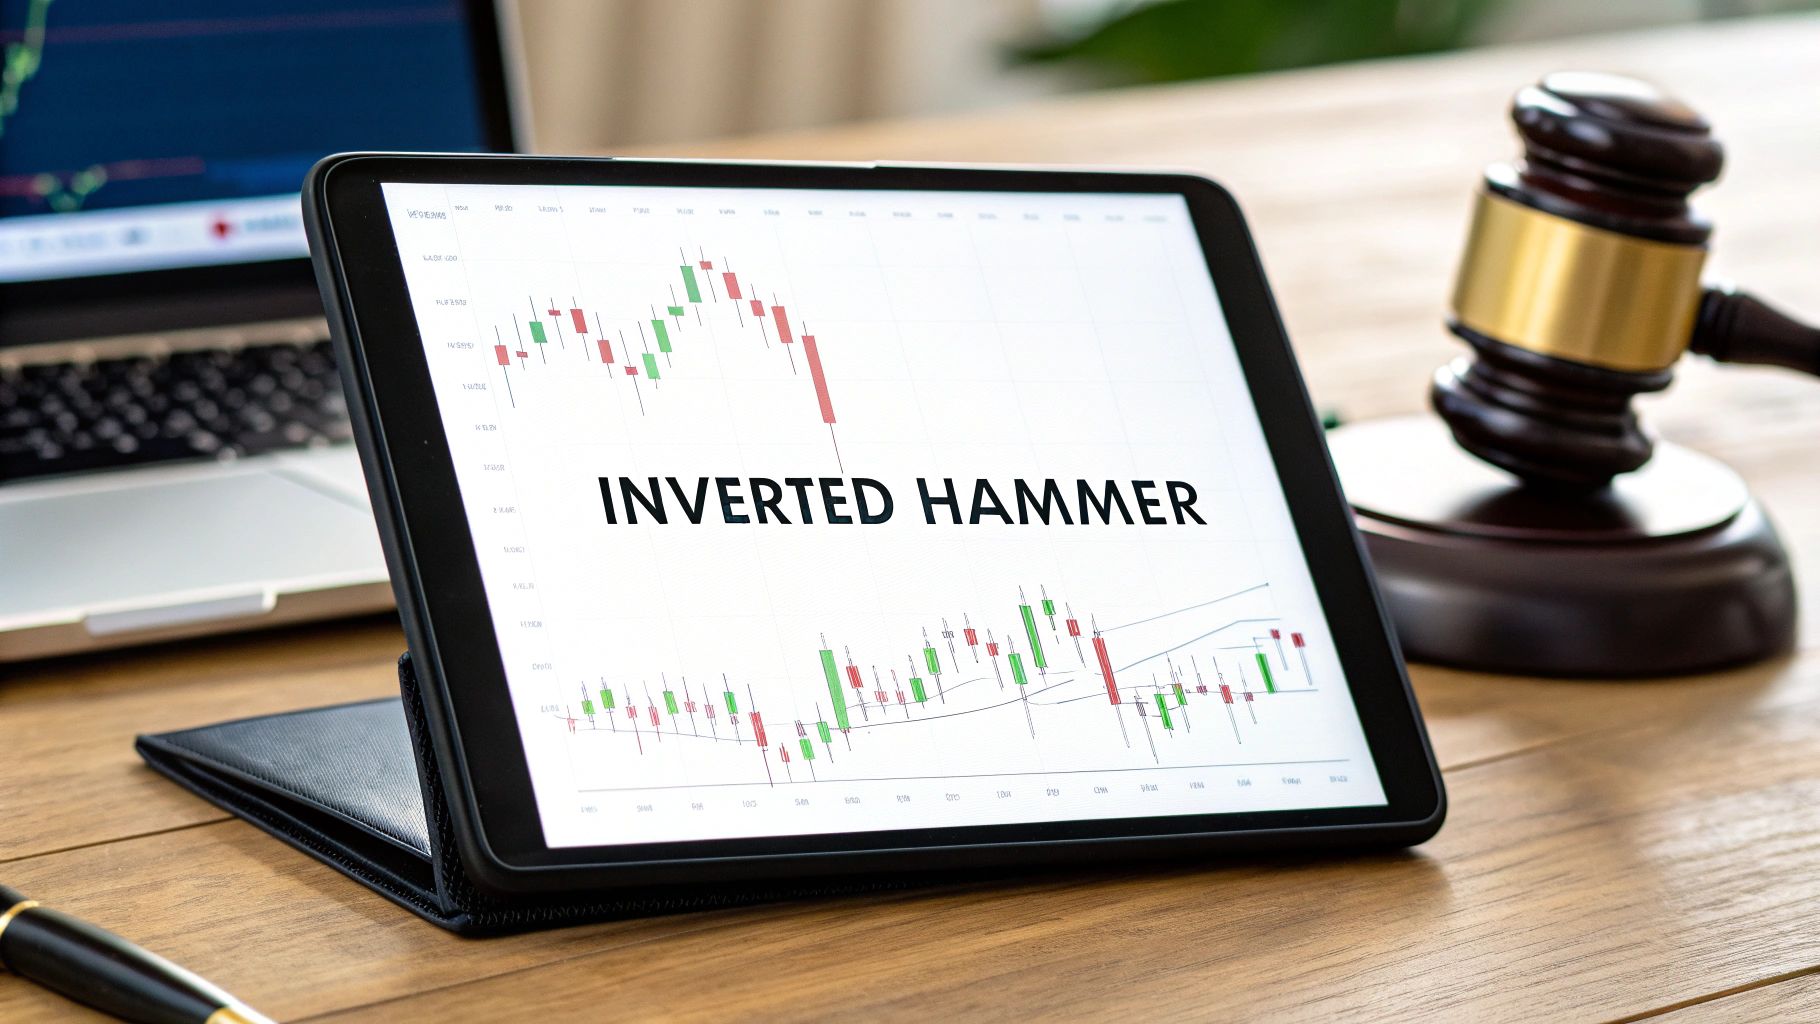
At its core, the inverted hammer candle pattern is a single candlestick that pops up at the bottom of a downtrend, hinting that a bullish reversal might be just around the corner. It's a visual clue, a story on the chart that tells us buyers are starting to wake up and test the sellers' resolve.
What the Inverted Hammer Candle Pattern Reveals

Before we get into specific trade setups, it’s crucial to understand the psychology behind this simple pattern. Think of any market as a constant battle, a tug-of-war between the bulls (buyers) and the bears (sellers). An inverted hammer shows up after the bears have had a good run, dragging prices lower and lower in a clear downtrend.
Then, out of nowhere, a strange-looking candle forms. Within that single trading session, buyers suddenly find some courage and launch a surprise attack, driving the price way up. That fierce but brief burst of buying pressure is what creates the long upper shadow (or wick) of the candle.
But here’s the twist: the buyers don't have enough firepower to hold that ground. By the time the session closes, the sellers have fought back and pushed the price all the way back down near its opening level. This struggle results in that tiny little "body" at the very bottom of the candle's range.
Decoding the Anatomy of the Pattern
It might look like the sellers won the day, right? After all, the price closed low. But the real story, the key piece of intelligence for us as traders, is that initial buying surge. It's the first real sign that the bears are facing some serious, organised resistance.
To spot a genuine inverted hammer, you need to tick a few specific boxes. It's all about the structure and, most importantly, the context.
- Small Real Body: The body of the candle (the part between the open and close) is tiny and sits at the bottom of the candle's total range.
- Long Upper Shadow: This is the star of the show. The wick sticking out of the top must be long, at least twice the size of the real body.
- Minimal Lower Shadow: There should be virtually no wick sticking out of the bottom. This tells us the price didn't fall much below where it opened.
- Location is Everything: This is non-negotiable. The pattern is only valid if it appears at the bottom of an established downtrend.
This specific formation is like seeing a crack appear in a dam. It doesn't mean the dam is about to burst, but it signals that the structure holding back the buyers is becoming unstable.
Inverted Hammer Pattern At a Glance
Here’s a quick-reference table to summarise the essential details of the inverted hammer pattern. Think of it as your cheat sheet for identifying this critical signal on your charts.
| Characteristic | Description | What It Means for Traders |
|---|---|---|
| Appearance | Small body at the bottom, long upper wick, little to no lower wick. | A clear visual sign of a struggle between buyers and sellers. |
| Location | Must form after a clear downtrend. | Context is key; this pattern is meaningless in a choppy or uptrending market. |
| Psychology | Buyers attempt a rally but sellers push the price back down. | Shows that buying pressure is emerging, even if sellers won the immediate battle. |
| Signal Type | Potential bullish reversal signal. | It's a warning, not a command. Wait for confirmation before acting. |
Ultimately, this table helps you quickly verify if what you're seeing is a legitimate setup or just market noise.
Why This Signal Matters to Traders
The inverted hammer is so much more than just a funny-looking shape on a chart. It’s a powerful clue about shifting market sentiment. While sellers have been running the show, this pattern proves that a wave of buyers saw value at these low prices and decided to step in with force.
The appearance of an inverted hammer does not guarantee a reversal. Instead, it serves as a critical alert for traders to pay close attention, as the probability of a trend change has just increased significantly.
This early warning is gold for a price action trader. It’s our cue to stop looking for places to sell and to start hunting for a potential buying opportunity. Don't get too hung up on the color of the body (whether it's green/bullish or red/bearish). While a green body might hint at slightly more bullish conviction, the core message is in the structure. Both are valid. That long upper wick is telling the real story: newfound buying interest is here, and it could be about to turn the tide.
The Market Psychology Behind the Signal
To really get a feel for the inverted hammer candle pattern, you have to look past the shape on the chart and see the story it's telling—the real-time battle between buyers and sellers. It’s like that moment in a boxing match where the underdog, after taking a beating for several rounds, suddenly lands a solid punch. The crowd gasps. The dynamic has shifted.
Picture the scene: the market is in a clear downtrend. Sellers, the bears, have been running the show, pushing prices lower and lower without much of a fight. For a while, it's been a one-sided story of bearish control.
Then, out of nowhere, things change. As the inverted hammer candle forms, buyers suddenly storm the gates. They see a bargain at these low prices and decide it’s time to make a move, driving the price way up during the session. That powerful push is what creates the long upper wick—a clear visual signal of this new buying pressure.
A Crack in the Bearish Armor
But the buyers don't have enough gas in the tank just yet. Their rally is strong, but it doesn't last. Before the session closes, the sellers—who are still a powerful force—manage to wrestle back control and slam the price back down near where it opened. At a glance, it might look like the sellers won that round.
But that’s not the real story here. The critical piece of information isn't who won that single candle, but the fact that a fight even happened. That powerful surge from the buyers is a warning shot. It's the first real sign in this downtrend that there are serious buyers waiting in the wings, ready to step in.
Think of this signal as the first major crack in the downtrend's armor. The bearish structure isn't broken yet, but its dominance has been challenged. The sellers' easy ride is probably over.
This is exactly the kind of shift in sentiment a price action trader lives for. We aren't just spotting patterns; we are reading the underlying tug-of-war between supply and demand. The inverted hammer is telling us that demand is finally waking up.
The Shift from Fear to Opportunity
The psychology here is a classic switch from fear to opportunity. Throughout the downtrend, fear is the dominant emotion, prompting traders to sell. The inverted hammer is a sign that this fear is starting to fade, being replaced by a sense that prices have become too cheap to ignore.
A few things are happening under the surface to cause this:
- Seller Exhaustion: The downtrend might just be running out of steam. Sellers are starting to cash in on their profits, which eases the downward pressure.
- Value Buyers Emerge: Traders who were patiently waiting on the sidelines now see the asset as undervalued and start buying.
- Short Squeeze Potential: That sudden pop in price, even if temporary, can spook short-sellers into buying back their positions to cut losses, adding more fuel to the buyers' fire.
The inverted hammer captures this entire moment perfectly. It shows the buyers' first attempt to take control—an attempt that failed but still left a mark. Even though sellers pushed back by the close, the psychological damage is done. The market is now on notice: the bulls are off the bench, and a change in trend is a real possibility.
How to Reliably Identify the Inverted Hammer
Alright, let's move from theory to what actually matters on your charts. Spotting a genuine inverted hammer candle pattern isn't about guesswork; it requires a strict, rule-based approach. Not every candle that looks vaguely like a hammer is a real signal. To cut through the noise, you need to know exactly what you're looking for.
Think of it like being a detective showing up to a crime scene. You don't just follow a hunch; you look for specific, concrete pieces of evidence. The same discipline applies here. We need to build a solid case before we even think about risking capital.
The Non-Negotiable Identification Checklist
For a candle to truly qualify as an inverted hammer, it absolutely must meet these criteria. If even one of these boxes isn't ticked, it's not a valid pattern. Consider it market noise and move on. This checklist is your first and most important filter.
-
A Clear Preceding Downtrend: This is the big one. An inverted hammer is a bullish reversal pattern. You can't reverse something that isn't happening, right? The pattern must show up after a clear series of lower lows and lower highs, where sellers are obviously in control.
-
Long Upper Shadow (Wick): The upper wick has to be at least twice the length of the real body. This long shadow is the visual footprint of that failed rally we talked about—it shows buyers had enough conviction to push the price way up during the session.
-
Small Real Body: The body of the candle—the colored part between the open and close—must be small. It should be sitting right at the bottom of the entire candle's range. That small body is a sign of a stalemate, a moment of indecision after the buyers' push.
-
Little to No Lower Shadow: A proper inverted hammer should have a tiny lower wick or none at all. This tells you that once the session opened, sellers couldn't push the price down any further. Their power is visibly fading.
Getting these visual cues burned into your memory is essential. To help train your eye, our complete candlestick patterns cheat sheet is a great resource for seeing more examples.
The flowchart below breaks down the psychology of what's happening during the downtrend as an inverted hammer forms—from the sellers' final push to the buyers' first real test.
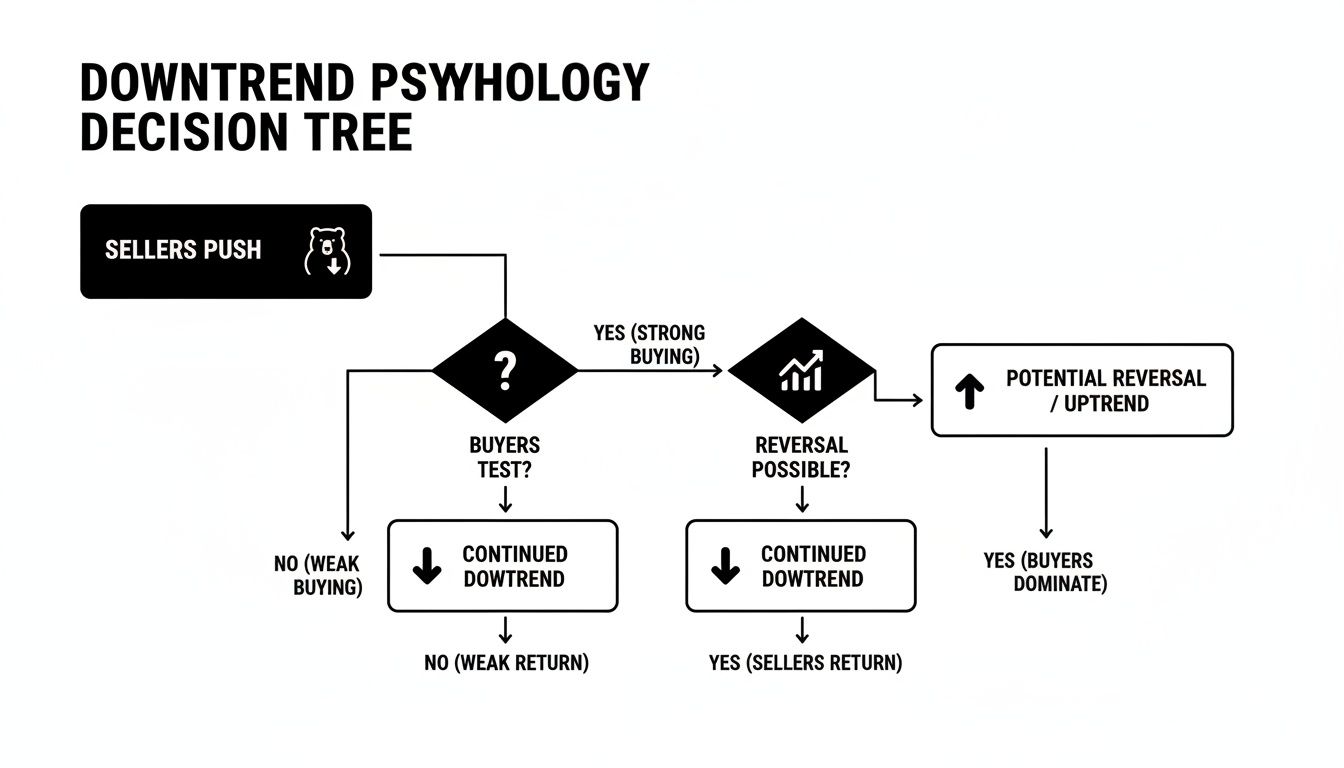
This visual really captures that critical shift in momentum, highlighting the battle between buyers and sellers that gives this pattern its power.
Context is Everything in Price Action
Let's be crystal clear: if you see a candle that looks just like an inverted hammer but it appears during an uptrend, it is not an inverted hammer. It's a bearish pattern called a shooting star. If it shows up in a messy, sideways market, it’s just random noise with zero predictive value.
The context of the downtrend is what gives the pattern its meaning.
Think about it this way: hearing a loud cheer in a library is just weird and out of place. Hearing that same cheer at a football stadium after a touchdown makes perfect sense. The sound is identical, but the context changes everything. It’s the exact same logic for candlestick patterns.
The location of the inverted hammer candle pattern on the chart is more important than its shape. Without a prior downtrend, the pattern is invalidated, regardless of how perfectly formed it may be.
This is a fundamental truth of price action trading. We don't trade candles in isolation. We read the story the market is telling us by seeing how these patterns form in relation to the bigger picture—the trend and key market structure.
The Role of Data in Confirmation
This strict identification process isn’t just my opinion; it’s backed by historical data. Backtesting has shown that the inverted hammer can have a success rate somewhere between 60-70% when you follow the proper confirmation rules.
One study, for example, pegged its accuracy at 67% in forecasting reversals, which is a solid statistical edge. This confirms that while no pattern is foolproof, a correctly identified inverted hammer gives you a genuine advantage. If you want to dive deeper into the numbers, you can explore the findings on platforms that track this data. It all comes back to trading with discipline, not emotion.
Why Confirmation Is Key to Successful Trades
Seeing a textbook inverted hammer candle pattern pop up at the bottom of a downtrend gets the heart racing. It feels like you’ve just been handed a secret tip that the market is about to reverse course. But I have to be blunt: acting on this signal too soon is one of the most common—and most expensive—mistakes a trader can make.
The inverted hammer is a signal of potential. It's not a guarantee. Think of it like a weather report forecasting sunshine for tomorrow. The signs look promising, but you wouldn't cancel your indoor plans just yet, would you? You'd wait to actually see the sun come out. In trading, that waiting period is called confirmation, and it is absolutely non-negotiable.
Trading this pattern all by itself is a low-probability gamble. That long upper wick shows that buyers gave it a good shot, but it also proves sellers were strong enough to slam the price right back down. Who's going to win the next round? We have no idea yet. Acting before you have that answer isn't trading; it's just hoping.
The Power of Price Action Confirmation
The purest and most reliable way to confirm an inverted hammer is to simply watch what price does next. This method doesn't require a single indicator or fancy formula—just the discipline to watch the very next candle form.
The rule couldn't be simpler: wait for the next candle to close above the high of the inverted hammer candle.
That one simple action changes the entire story. A close above the high proves the initial buyer surge wasn't a one-off fluke. It tells you that buyers have come back to the fight with even more conviction, decisively taking out the high of the previous struggle. This follow-through is the hard evidence you need that the momentum is truly shifting from bears to bulls.
A confirmed inverted hammer is a signal that buyers have not only challenged the sellers but have now won a decisive battle. An unconfirmed pattern is just a sign that a challenge occurred, with the outcome still very much in doubt.
Sticking to this patient approach will filter out a massive number of false signals. So many times, you'll see an inverted hammer form, only for the next candle to be a huge bearish bar that continues the downtrend. The traders who jumped the gun are now trapped and underwater. By waiting, you sidestep those traps and only put your capital at risk when the odds have clearly shifted in your favor.
Using Volume as a Secondary Clue
While price action should always be your number one tool, trading volume can add another valuable layer of conviction to your analysis. High volume during the formation of the inverted hammer—and even more importantly, during the confirmation candle—gives the signal much more weight.
Here’s what you want to see:
- Elevated Volume on the Inverted Hammer: A spike in volume tells you the battle between buyers and sellers was fierce and meaningful.
- Strong Volume on the Confirmation Candle: A surge in volume as the price breaks the inverted hammer's high shows that buyers are stepping in with serious commitment.
When you get that perfect combination of a price action breakout and high volume, you've got a powerful signal for a genuine reversal. This is a core part of what we call building confluence in trading, where multiple independent signs all point to the same outcome.
Timeframe and Statistical Reality
It’s also fascinating to see how the effectiveness of this pattern changes depending on the timeframe you're trading. Historical forex data has shown that the inverted hammer had a 52.9% success rate on thirty-minute charts. But on the four-hour charts, the pattern was actually followed by a bearish continuation more often than not.
What does this tell us? It suggests the signal holds more statistical weight for short-term day trading than for longer-term swing trading. You can dig deeper into these numbers by checking out the detailed analysis on forexop.com. As always, patience and confirmation are your best friends for navigating these statistical realities.
A Practical Price Action Trading Strategy
Knowing how to spot a pattern is one thing, but that skill alone won’t make you money. For that, you need a repeatable game plan with rock-solid rules. That’s exactly what we’re building here—a complete price action strategy for trading the inverted hammer candle pattern, with no confusing indicators.
This is a mechanical process, not guesswork. It's designed to manage risk while capturing potential gains when the pattern signals a high-probability setup. We’ll walk through the three pillars of any good trade: your entry, your stop-loss, and your exit.
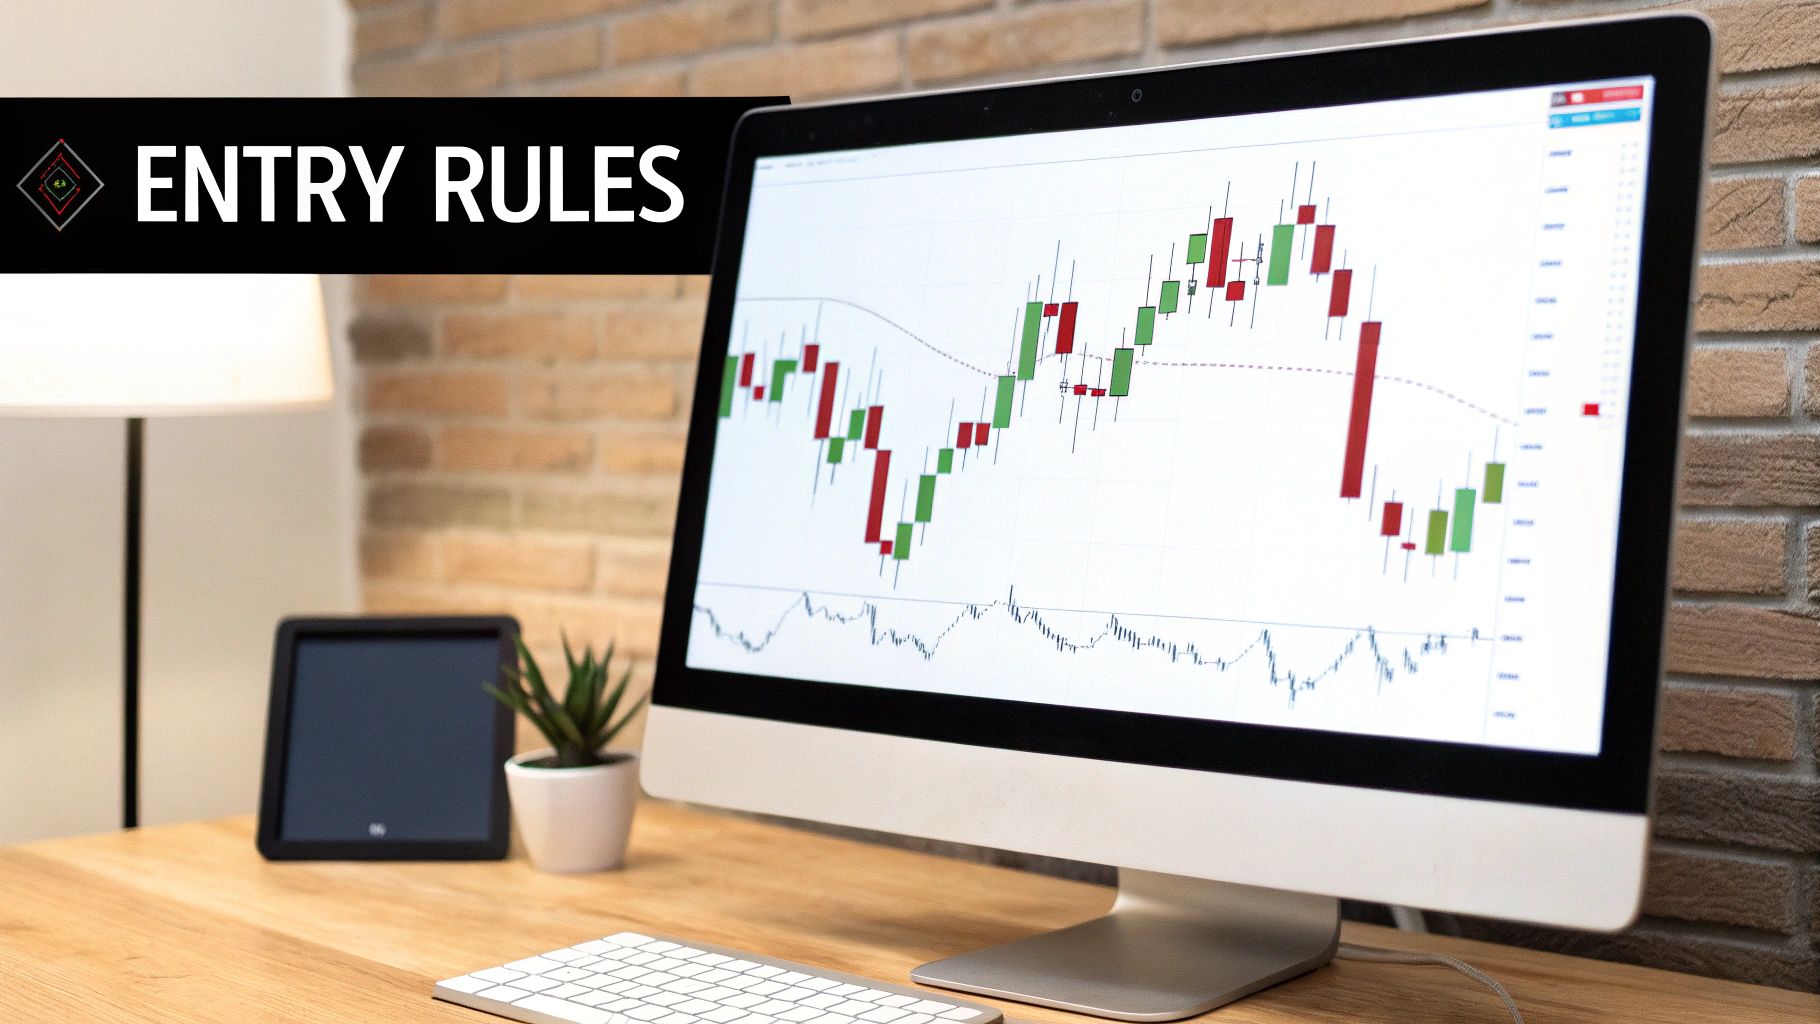
The Trade Entry Rules
Your entry is your commitment to a trade, and you should only pull the trigger after the market proves your analysis right. For the inverted hammer, this means waiting for that crucial confirmation candle we talked about.
-
Find a Valid Pattern: First, make sure you have a textbook inverted hammer. Run through the checklist: it must show up after a clear downtrend, have a long upper wick (at least 2x the body), a small real body near the low, and almost no lower wick.
-
Wait for Confirmation: This is where patience pays off. Don’t jump in as the inverted hammer is forming. Let the next candlestick complete its session.
-
Execute the Entry: Your signal to act is a candle that closes above the high of the inverted hammer. Once that confirmation is locked in, you enter a long (buy) position at the open of the very next candle.
This disciplined entry ensures you’re trading with the market's momentum, not trying to catch a falling knife. You are letting the buyers prove their strength before you risk a single cent.
Setting Your Stop Loss
Every trade needs an escape hatch—a price where you admit the setup didn't work and get out to protect your capital. With the inverted hammer, this is simple and logical.
Place your stop-loss order just below the low of the inverted hammer candle.
From a price action perspective, this placement just makes sense. The low of the pattern is the line in the sand where buyers showed up. If the price breaks below that, sellers have won the battle, and your bullish signal is officially dead. This keeps your stop tight and your risk-reward favorable.
By placing a stop-loss below the pattern's low, you define your maximum risk upfront. This transforms trading from a gamble into a calculated business decision where potential losses are known and controlled.
Understanding how to manage your trades is paramount. You can dive deeper into this topic in our detailed guide on setting your stop-loss and take-profit levels.
Defining Your Profit Targets
Knowing when to take your profits is just as important as knowing when to get in. An entry without an exit plan is a great way to watch winning trades turn into losers. Here are a few solid, price-action-based methods for setting profit targets.
- Targeting Key Resistance: Look left on your chart. Where is the next major roadblock? This could be a previous swing high, an old support level that might now act as resistance, or a major supply zone where sellers have gathered before.
- Using a Fixed Risk-to-Reward Ratio: A straightforward approach is to aim for a profit that’s a multiple of what you're risking. If your stop-loss is 50 pips, you could set a take-profit for a 2:1 reward (100 pips) or a 3:1 reward (150 pips).
The right exit strategy comes down to your personal trading style, but the golden rule is to always have a plan before you enter.
Inverted Hammer vs. Shooting Star
It's absolutely critical to tell the inverted hammer apart from its bearish twin, the shooting star. They look identical but signal the exact opposite because of where they appear in a trend. Mixing these two up can lead to some painful losses.
This table breaks down the key differences. Notice how everything comes down to context.
Inverted Hammer vs. Shooting Star Comparison
| Feature | Inverted Hammer (Bullish) | Shooting Star (Bearish) |
|---|---|---|
| Location | Appears at the bottom of a downtrend. | Appears at the top of an uptrend. |
| Signal | A potential bullish reversal signal. | A potential bearish reversal signal. |
| Psychology | Shows buyers are testing seller strength. | Shows sellers are testing buyer strength. |
| Confirmation | A subsequent candle closes above its high. | A subsequent candle closes below its low. |
The takeaway here is simple: the trend is everything. The market environment is what gives these patterns their predictive power. Always check the trend first before acting on any candlestick signal.
Common Questions About the Inverted Hammer
No matter how solid your trading plan is, questions always pop up when you’re facing live markets. The inverted hammer candle pattern seems simple on the surface, but its nuances can trip up even experienced traders. Let's walk through some of the most common questions I hear to clear up any confusion and sharpen your trading edge.
Think of this as your personal FAQ—quick, practical answers that get straight to the point. Getting these details right is what separates traders who consistently pull profits from the market from those who get chopped up by false signals.
Inverted Hammer vs. Shooting Star: What's the Difference?
This is, without a doubt, the biggest point of confusion. It's understandable, because they look identical. Both candles have a small body at the bottom and a long upper wick sticking out. The difference has absolutely nothing to do with the candle’s shape and everything to do with where you find it.
It's all about context.
-
An Inverted Hammer is a bullish reversal pattern. It only counts if it appears at the bottom of a clear downtrend. It’s a clue that buyers are testing the waters and a potential rally is on the horizon.
-
A Shooting Star is a bearish reversal pattern. This is the inverted hammer’s evil twin, and it only matters when it forms at the top of an uptrend. It signals that sellers are stepping in to challenge the buyers, and a move lower could be next.
Picture the exact same candle. If you spot it after a significant price drop, you call it an inverted hammer and start looking for an opportunity to go long. But if that same candle shows up after a strong rally, it's a shooting star, and you should be thinking about a potential short. Getting the trend wrong here is a critical error that puts you on the wrong side of the market's likely direction.
How Reliable Is This Pattern?
The inverted hammer is a moderately reliable signal, but that comes with a massive caveat. Its success rate hinges entirely on two things: context and confirmation. If you trade this pattern in a vacuum just because you see the shape, you’re using a low-probability strategy that will quickly burn through your capital.
Its predictive power only becomes meaningful when other pieces of the puzzle fall into place.
The reliability of an inverted hammer isn't in the candle itself; it's built from the market structure surrounding it. A pattern at a key support level with strong bullish confirmation is a high-probability setup. One floating in the middle of a price range is just noise.
This pattern is most powerful when it forms at a predefined area of major support, like a previous swing low or a significant demand zone. When you combine that prime location with a strong confirmation candle—one that closes decisively above the inverted hammer's high—its reliability skyrockets. Without those elements, you're just gambling.
Should I Ever Trade It Without Confirmation?
In one word: no. I strongly advise against ever trading an inverted hammer without waiting for confirmation. I know it’s tempting, especially for newer traders who are afraid of missing the very bottom of a move. But that impatience is a very expensive habit.
Remember what the candle actually represents: a potential change in momentum. That long upper wick shows that buyers made a run for it but were beaten back down by sellers. At the moment that candle closes, the battle is still undecided. The sellers haven't given up control yet.
Jumping in on an inverted hammer before the buyers prove they mean business is like betting on a horse before it has even left the gate. You're acting on incomplete information. The confirmation candle is your proof—it shows that buyers came back with force and are now in charge.
By waiting for that confirmation, you filter out a huge number of failed signals where sellers simply take over again on the next candle. Patience is your best friend here. It keeps you out of bad trades and ensures you only put your capital on the line when the odds are stacked in your favour. That discipline is the cornerstone of professional price action trading.
At Colibri Trader, we are dedicated to transforming your trading with a clear, price-action-based approach that works. If you're ready to stop guessing and start trading with a proven strategy, discover your true potential today. https://www.colibritrader.com