


Indicator Free Trading: Master Price Action Strategies
Breaking Free From Indicator Dependency
Many traders start their journey with technical indicators, viewing them as essential guides—much like training wheels on a bicycle. They offer a sense of stability and direction when the market feels overwhelmingly chaotic. But just as those wheels eventually slow you down and limit how sharply you can turn, a heavy reliance on indicators can stall a trader's growth. To truly become fluent in the market, you must learn to read its native language: price action. This is the foundational idea behind indicator-free trading, a method that cuts through the noise to focus on the raw story the price is telling.
This change isn't about blindly throwing away tools. It's about moving to a more direct and intuitive way of analyzing the market. By their very design, indicators are derivative; they take raw price and volume data and run it through a mathematical formula. This process creates a delay, which means the signal you see on an indicator reflects something that has already happened on the price chart. For traders looking for an edge, that lag can be the difference between a well-timed entry and a costly, late decision.
The Power of a Clean Chart
Picture two different scenarios. In the first, you're having a direct, face-to-face conversation. In the second, your discussion is passed through a translator who gives you a summary a few moments after something is said. Which scenario gives you a better feel for the person's real intentions and emotions? Trading without indicators is like having that direct conversation with the market. Every single candlestick, every high, and every low is part of a larger story about supply and demand, fear, and greed.
When you remove the clutter of extra lines, oscillators, and histograms, you can see the market's narrative with total clarity. This clean approach pushes you to develop a much deeper connection with market sentiment, allowing for quicker and more confident decisions based on the source data itself.
Reading the Market's True Story
The philosophy of indicator-free trading is all about interpreting market behavior without relying on secondary tools. It's about understanding the psychology that drives trends by observing raw price movements. For example, during the extreme volatility of the COVID-19 pandemic, the S&P 500 experienced massive swings. While many indicators struggled to provide reliable signals in such unusual conditions, price action traders could identify critical support and resistance levels where buyers and sellers were in a clear battle for control. You can explore how major economic events influence market data on resources like TradingEconomics.com.
Ultimately, letting go of indicator dependency simplifies your entire process. It allows you to react to what the market is doing right now, not what an algorithm suggests it might do next. This focused method helps build stronger intuition and promotes a more profound understanding of why markets move, creating a solid foundation for consistent performance.
Decoding Market Psychology Through Pure Price Action
Every single candlestick on your chart is more than a random shape—it’s the final record of a fierce battle between buyers and sellers. This constant struggle, fueled by powerful human emotions, is what truly drives the market. To master indicator-free trading, you need to think like a market psychologist, learning to interpret the collective fear and greed behind every price move.
Think of a major support level not as a technical line on a chart, but as a psychological wall. This barrier is built from the market's shared memory and fear of prices dropping lower. In the same way, a resistance level is born from greed, as sellers decide to cash in their profits, which stops an upward trend in its tracks.
Understanding this dynamic lets you see what’s really happening beneath the surface. For instance, you can learn to spot the subtle signs of institutional accumulation. This is where "smart money" quietly buys up assets, often when retail traders are panic-selling. The reverse is also true; professionals frequently sell their positions into a buying frenzy, leaving behind clues in the price action long before the crowd realizes a top is forming. By focusing on these raw psychological footprints, you gain a real edge over traders who are waiting for lagging indicator signals.
Reading Between the Candlesticks
Significant market turning points are almost always signaled by these psychological shifts first. Certain price levels act like magnets because of past battles fought there, creating an emotional "memory" that influences how traders react in the future. If you'd like to explore these ideas further, you can learn more about price action trading in our detailed guide. This knowledge helps you understand how the market's true bias is revealed through its reaction to news, rather than just reacting to the headlines themselves.
This chart, for example, shows a textbook psychological trap known as a failed breakout.

The initial surge above the resistance line looks incredibly bullish, tempting many to buy. However, the quick and sharp rejection back below the line shows that buyers didn't have enough strength, and sellers easily took back control. This isn't just a chart pattern; it’s a visible story of greed quickly turning into fear. This is a fundamental lesson in pure price action trading.
Essential Price Action Patterns That Work

While the market can often feel chaotic, its movements are frequently driven by repeatable patterns. These patterns are like a language, revealing the constant tug-of-war between buyers and sellers. An indicator-free trading approach helps you learn this language, cutting through the noise to make decisions based purely on what price is doing. At its heart, this method is about identifying where the big players—the institutions—are likely to make their moves.
Identifying Key Support and Resistance Zones
Forget about just connecting a few dots on your chart. True support and resistance levels are not thin lines; they are zones—broad areas where a significant amount of trading has previously occurred. Think of them as historical battlegrounds. When price revisits a strong support zone, it’s returning to a place where buyers previously overwhelmed sellers, creating a floor. Conversely, a resistance zone is a price ceiling where sellers have historically taken control.
To spot these powerful zones, look for areas on the chart with:
- Multiple instances of price being rejected.
- Sharp reversals that occurred on high trading volume.
- Long periods of sideways movement (consolidation) just before a major price swing.
These are the exact levels that large institutions monitor, which makes them far more reliable than arbitrary lines. A price reaction at one of these key zones tells you much more than a delayed signal from a lagging indicator.
Distinguishing Breakouts from Deceptive Fake-Outs
A common trap that catches many aspiring traders is the fake-out, sometimes called a "bull trap" or "bear trap." This happens when the price seems to break decisively through a support or resistance zone, only to reverse direction sharply. This reversal traps anyone who jumped in, expecting the move to continue. A genuine breakout, on the other hand, signals a real shift in who is in control of the market.
So, how do you spot the difference? The secret is confirmation. A real breakout is usually powered by a noticeable increase in trading volume, which shows strong belief behind the move. Often, after the initial break, the price will pull back to re-test the old resistance level, which has now become new support. This re-test is a classic entry signal for the patient price action trader.
A fake-out, however, usually lacks strong volume and fails to hold its ground beyond the broken level, quickly falling back into its previous range. By waiting for confirmation instead of acting impulsively, you can avoid being caught on the wrong side of a move designed to fool the impatient. This disciplined, observant strategy is a cornerstone of successful indicator-free trading.
Reading Market Structure Like The Professionals
While new traders might see a chart as a jumble of chaotic price movements, professionals see an underlying framework. This framework is called market structure, and learning to read it is a foundational skill in indicator-free trading. It’s the art of figuring out if a market is trending, consolidating, or about to reverse, just by watching its sequence of highs and lows. Think of it as having the market's blueprint.
The Big Picture: Top-Down Analysis
Successful price action traders don't just stare at a 5-minute chart; they always start from the top down. They begin with monthly or weekly charts to identify the dominant trend before zooming into daily or intraday timeframes. This approach keeps them from getting trapped in minor price swings that run counter to the market's real momentum.
Having this wide-angle view is essential for making smart decisions. For instance, recognizing the Dow Jones Industrial Average (DJIA) saw a 19% increase throughout 2021 was a key insight for trend traders. This knowledge came from reading the larger market structure, not from a lagging indicator. With access to millions of instruments globally, traders can perform this kind of analysis across various markets. You can explore the range of instruments available on TradingView to get a sense of this data coverage.
Trend Recognition And Breakdowns
Market structure essentially shows you the ongoing battle between buyers and sellers. Here's how to interpret the fight:
- Uptrend: This is marked by a series of higher highs (HH) and higher lows (HL). Each peak climbs higher than the last, and every pullback finds support at a higher level than the one before it. Buyers are clearly in control.
- Downtrend: The reverse is true here, with a clear pattern of lower lows (LL) and lower highs (LH). This signals that sellers are consistently pushing the price down.
- Consolidation: The price moves sideways, failing to make a clear series of higher or lower points. This indicates a period of indecision in the market.
For a trader, the most critical signal is the break of structure. This occurs when an uptrend, for example, fails to create a new higher high and instead forms a lower low. This is often the earliest warning sign that the trend is losing steam and a reversal could be on the horizon. Learning to spot these pivotal moments is a vital skill. To sharpen your abilities, you might find value in our detailed guide on understanding market structure.
Indicator Free Trading Versus Traditional Analysis
Choosing between indicator free trading and traditional, indicator-heavy analysis is a fundamental decision every trader faces. These aren't just two different tactics; they are separate philosophies on reading the market. Think of it like a detective solving a case: one detective interviews witnesses and examines the crime scene directly, while the other analyzes statistical reports from past cases. The first is reacting to raw, real-time evidence, while the second is interpreting a mathematical summary of what already occurred.
This same contrast exists in trading. Traditional analysis leans on indicators like the RSI or MACD, which are simply formulas applied to past price data. This creates a natural delay, meaning the signals you see are based on events that have already finished. In contrast, an indicator-free approach focuses directly on the "crime scene"—the raw price action and candlestick movements—for a more immediate and direct interpretation.
The Psychological and Performance Divide
The mental experience of using these two methods is vastly different. Traders who rely heavily on indicators often experience analysis paralysis, getting caught between conflicting signals from different tools. What do you do when the RSI signals an overbought condition, but the MACD is just showing a bullish crossover? This internal conflict can lead to hesitation, second-guessing, and missed trades.
On the other hand, an indicator-free trader works with a single source of truth: the price chart. This focus helps cultivate quicker, more confident decision-making and builds a deeper, more intuitive feel for the market's pulse.
This infographic, based on anecdotal reports from traders, offers a visual comparison of how the two approaches can perform.
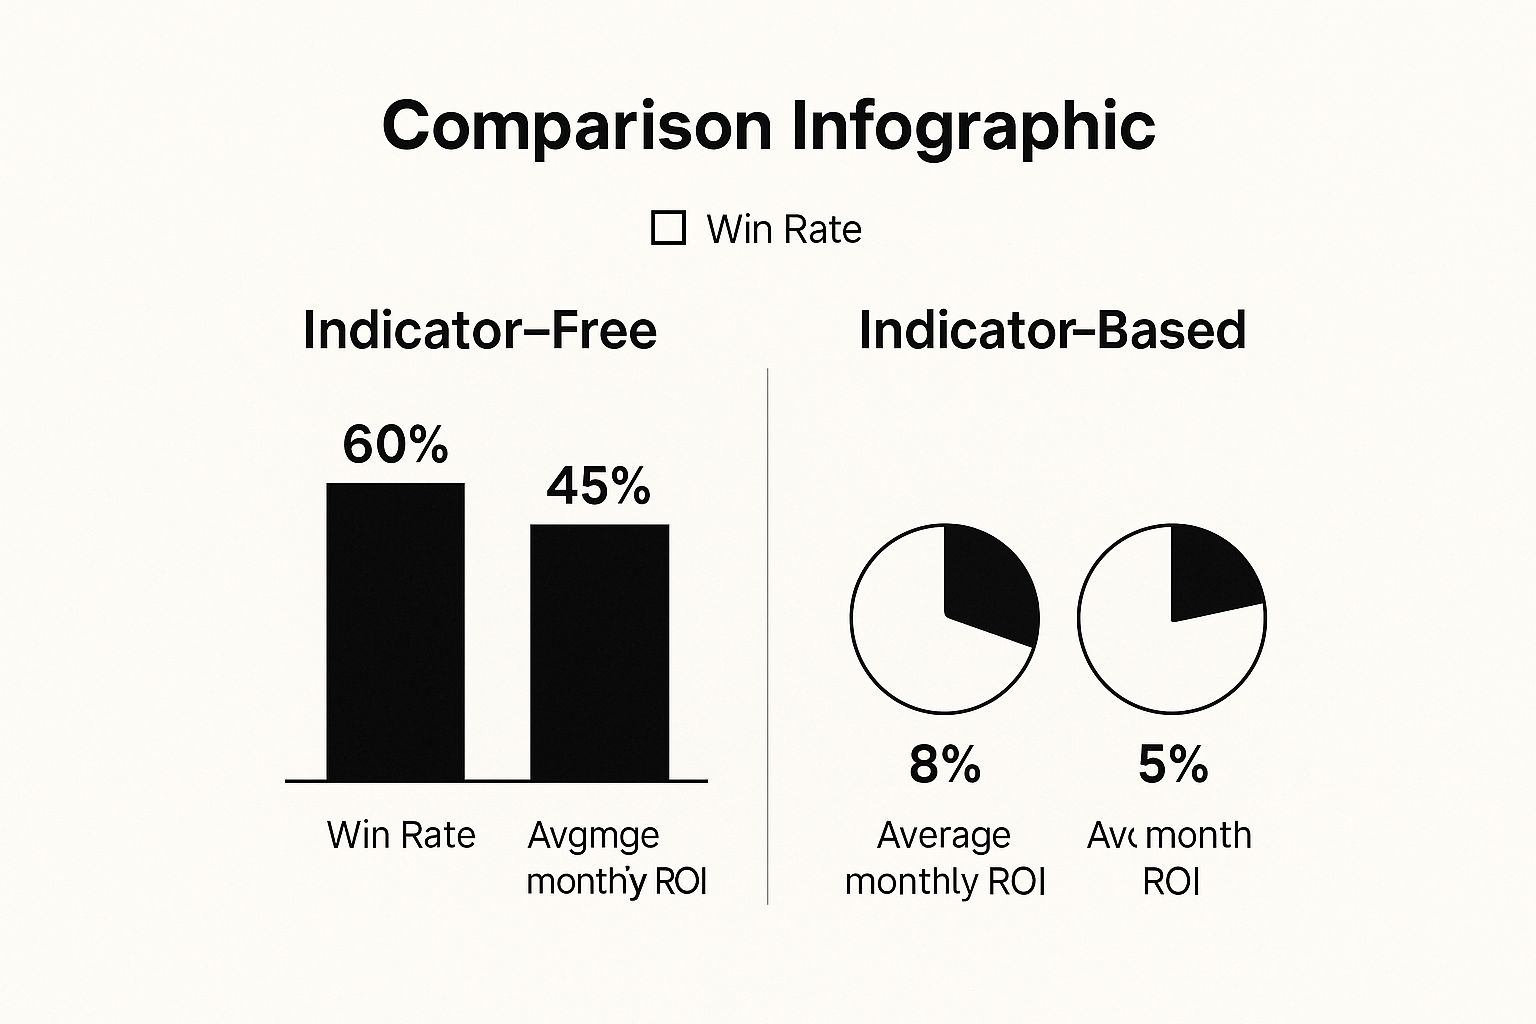
The data suggests that traders focusing on pure price action often report better win rates and ROI. This is likely because reading the chart directly allows for faster reactions and a clearer understanding of market sentiment as it unfolds.
To better understand the core differences, let's compare the two approaches side-by-side.
Indicator Free vs Traditional Technical Analysis
A comprehensive comparison of indicator-free trading versus traditional technical analysis across multiple dimensions
| Aspect | Indicator Free Trading | Traditional Technical Analysis | Advantage |
|---|---|---|---|
| Data Source | Raw price charts (candlesticks, bars) | Mathematical formulas based on price and/or volume (e.g., RSI, MACD, Bollinger Bands) | Indicator Free: More direct and less processed view of market activity. |
| Timing | Real-time or leading. Focuses on what the market is doing now. | Lagging. Indicators reflect what the market has already done. | Indicator Free: Faster signals allow for earlier entry and exit points. |
| Clarity | High. One source of truth (the price chart) reduces conflicting signals. | Low to Medium. Multiple indicators can provide contradictory signals, leading to confusion. | Indicator Free: Simplicity fosters clearer, more decisive action. |
| Decision-Making | Fast and intuitive, based on pattern recognition. | Slower and more analytical, requires reconciling different data points. | Indicator Free: Reduces "analysis paralysis" and encourages decisive trading. |
| Learning Curve | Steeper initially, as it requires developing market intuition and pattern recognition skills. | Flatter initially, as it's easier to follow predefined rules from indicators. | Traditional Analysis: Lower barrier to entry for beginners. |
| Flexibility | Highly adaptable to any market and timeframe because price action is universal. | Less adaptable; some indicators work better in trending markets while others are for ranging markets. | Indicator Free: A single skill set applies across all market conditions. |
This table shows that while indicator-based analysis can provide a structured starting point, an indicator-free approach offers a more direct, clear, and adaptable way to engage with the markets once mastered.
Why Simplicity Often Wins
There's a common belief that more complex tools lead to better results, but in trading, the opposite is often true. Many institutional traders favor a clean, price-action-based chart because it is faster and less ambiguous. They know that every indicator is just a derivative of price itself. By learning to read the source code of the market directly, you remove the middleman and align your decisions with its raw behavior.
While traditional indicators can be useful for confirming long-term trends or providing a broad market overview, trying to blend both philosophies can be counterproductive. Imagine getting a clear "sell" signal from a bearish price pattern while your favorite lagging indicator is still showing bullish momentum. This conflict erodes confidence and promotes inconsistent actions. Choosing one clear philosophy and dedicating yourself to mastering it is often the most direct path to consistent trading.
Building Your Personal Trading System

Knowing price action theory is the first step, but the real journey begins when you turn that knowledge into a working, profitable system. A solid indicator-free trading system isn't something you can just copy and paste from another trader. It’s a personal blueprint built around your unique risk tolerance, schedule, and psychological tendencies.
Think of it as your operational guide for navigating the markets. It’s designed to take emotion and snap judgments out of the equation. This system tells you exactly when to enter a trade, how to manage it while it's active, and precisely when it's time to exit, whether for a profit or a loss.
Crafting Your Rules and Managing Risk
The first task is to define your rules of engagement. Your system needs specific, non-negotiable criteria for entries and exits that are based only on what you see the price doing. For instance, an entry rule might be, "I will only buy after a confirmed breakout and successful retest of a major daily resistance level." An exit rule could be, "I will sell half of my position when the price hits a 2:1 risk-to-reward ratio and then move my stop loss to my entry price." The rules must be crystal clear, leaving no room for debate when you're in a live trade.
Your trading plan should be a written document that covers every component of your process. Here are the key elements to include:
- Trade Setups: Explicitly define the price action patterns you will trade. This could be pin bars appearing at key support or resistance, engulfing candles, or a clear break of market structure. Be selective.
- Timeframes: Decide which timeframes you'll use for analysis (like the daily chart to spot the main trend) and which you'll use for execution (like the 4-hour chart for finding entries). This has to align with your lifestyle; a day trader's system will look completely different from a swing trader's.
- Position Sizing: Before you ever enter a trade, you must know how much capital you'll risk. A widely accepted guideline is to risk no more than 1-2% of your trading account on a single trade.
- Risk Management: Detail your stop-loss and take-profit strategy. Will you use a fixed stop based on a certain number of pips, or will it be dynamic, based on market volatility? What risk-to-reward ratio are you aiming for?
Backtesting and Refinement
Once you've drafted your system, you must move on to the critical phase of backtesting. This means scrolling back on historical price charts and applying your rules to see how they would have performed in the past. It's a fundamental step for building confidence in your strategy before any real money is on the line.
During this research, you can also use market data to understand the broader context. For example, looking at statistics on exchange-traded products or liquidity indicators can show how your system might behave in different market conditions. You can find global market data to aid this process from sources like the World Federation of Exchanges, which tracks these key metrics. You can find more details on market statistics at World-Exchanges.org.
Finally, a trading system is a living document, not a stone tablet. It needs constant review and refinement, which is where a trading journal becomes essential. Log every trade: the setup, the outcome, your reasons for taking it, and how you felt. This journal becomes your personal performance database, showing you what’s working and what isn’t.
This process of continuous improvement is fueled by self-awareness and a strict commitment to your rules. For traders who find sticking to a plan difficult, it's vital to explore the 7 steps to becoming more disciplined in your trading. Ultimately, self-discipline is what holds your entire system together, turning a good plan into repeatable results.
Your Action Plan for Trading Success
Switching to an indicator-free trading style is a serious commitment. It’s not just about taking a few tools off your chart; it’s about learning to read the market in its purest form. Think of it like learning to speak a new language—you wouldn’t expect to become fluent overnight. This journey requires a structured plan, patience, and dedication.
This roadmap breaks the process down into manageable phases, guiding you from understanding the basics to executing trades with confidence.
Phase 1: Foundational Learning (1-3 Months)
The first step is all about building a solid foundation without risking a single dollar. Your only job here is to learn and observe.
- Learn to Read the Charts: Open a candlestick chart and just watch. Your goal is to spot the basic language of the market. Look for simple patterns like pin bars or engulfing candles, especially when they appear at obvious historical price levels. Don't trade, just look and learn.
- Understand Market Structure: Next, focus on identifying the market's direction. Practice drawing lines that connect higher highs (HH) and higher lows (HL) to define an uptrend. Do the same for lower lows (LL) and lower highs (LH) in a downtrend. This is the backbone of price action analysis.
- Start Paper Trading: Once you're comfortable identifying structure, open a demo account. The goal here isn't to make a fortune in fake money. It’s to practice applying your knowledge of support, resistance, and trends in a no-risk setting. Treat every trade as if it were real to build discipline.
Phase 2: Skill Refinement (3-6 Months)
Now that you have the basics down, it’s time to sharpen your skills and build a repeatable process. You are still not trading with real capital.
- Build Your Playbook: You can't trade everything. Identify 2-3 specific price action setups that you understand clearly and that feel right for your personality. These will become your go-to strategies.
- Journal Everything: This is non-negotiable. Keep a detailed trading journal for all your paper trades. For each trade, record the setup you saw, why you took it, what happened, and what you could have done differently. This journal will become your most valuable coach.
- Track Your Performance: Start measuring your progress. Look at your win rate and average risk-to-reward ratio on your paper trades. You're not chasing profits yet; you're aiming for consistency. When you can follow your plan perfectly for at least 30 consecutive trades, you know you're building the right habits.
Phase 3: Going Live (6+ Months)
After you've proven your discipline and consistency on a demo account, you might be ready to trade with real money. The key here is to start small.
Open a live account, but fund it with a small amount. Your initial position sizes should be so small that the financial outcome feels almost meaningless. The real goal is to get used to the psychological pressure of having actual money at risk. Can you still follow your plan when it’s real?
As you demonstrate the ability to stick to your system under pressure, you can then begin to slowly and carefully increase your position size.
This path requires patience and hard work. To see how these principles are applied in a proven system, see how Colibri Trader provides a clear, action-based approach to mastering each phase of your price action journey.