


How to Trade with Price Action A Complete Guide
To trade with price action, you’re essentially learning to read the raw story of the market directly from the price chart, without the clutter of technical indicators. It's all about analyzing candlestick patterns and market structure to figure out the ongoing battle between buyers and sellers and making your moves based on what the price is actually doing.
Reading the Market Without Indicators
Ever tried to have a serious conversation in a room with a dozen people shouting at once? That's what trading with a chart full of indicators can feel like. You're bombarded with lagging, and often conflicting, signals.
Price action trading strips all of that away. It brings you back to the purest source of market information there is: the price chart itself. This whole approach is about learning to read the market’s language directly from the source, not from a translator that's always a few steps behind.
The core idea is simple but incredibly powerful. Every single tick up or down, every candlestick that forms, is a direct reflection of the collective actions—and emotions—of every single person in that market. It’s the raw, unfiltered story of supply and demand, fear and greed, playing out right in front of you.
When you focus on a ‘naked’ chart, you’re not trying to predict the future with some complex formula. You’re simply reacting to the present reality of the market's psychology.
The Power of a Clean Chart
The moment you remove indicators like the RSI, MACD, or Bollinger Bands, your chart becomes incredibly clean. This clarity isn't just for looks; it's a massive strategic advantage. Instead of getting sidetracked by a lagging oscillator, all of your attention is on what really matters:
- Candlestick Formations: Each candle's open, high, low, and close (OHLC) tells a detailed story about that session's power struggle. A long wick at the top, for example, is a clear sign that buyers tried to push prices higher but were smacked down by sellers.
- Market Structure: By identifying the series of swing highs and swing lows, you can get a clear read on the current trend. Is the market carving out higher highs and higher lows, signaling a solid uptrend? Or is it failing to break past previous peaks, hinting at a potential reversal?
- Key Support and Resistance Zones: These are the historical price levels where the market has consistently pivoted. Think of them as the battlegrounds where major market decisions are made, time and time again.
The real beauty of price action is that it’s universal. It doesn’t matter if you're trading stocks, forex, or commodities—the principles of human psychology reflected in price charts are constant. This is your edge.
This isn’t some niche strategy, either. It’s used by everyone from small retail traders to the biggest institutional players. The focus is always on one thing: analyzing the raw price movements of an asset over time.
Ultimately, learning to trade with price action is like becoming a chart detective. You’re constantly looking for clues left behind by the 'smart money' to build a logical case for putting on a trade. It simplifies your decision-making and helps you develop a true, intuitive feel for how the market breathes.
If you're looking to dive deeper and really sharpen your skills, I highly recommend exploring our other articles on trading without indicators. You'll find a ton of insights to help you on your journey.
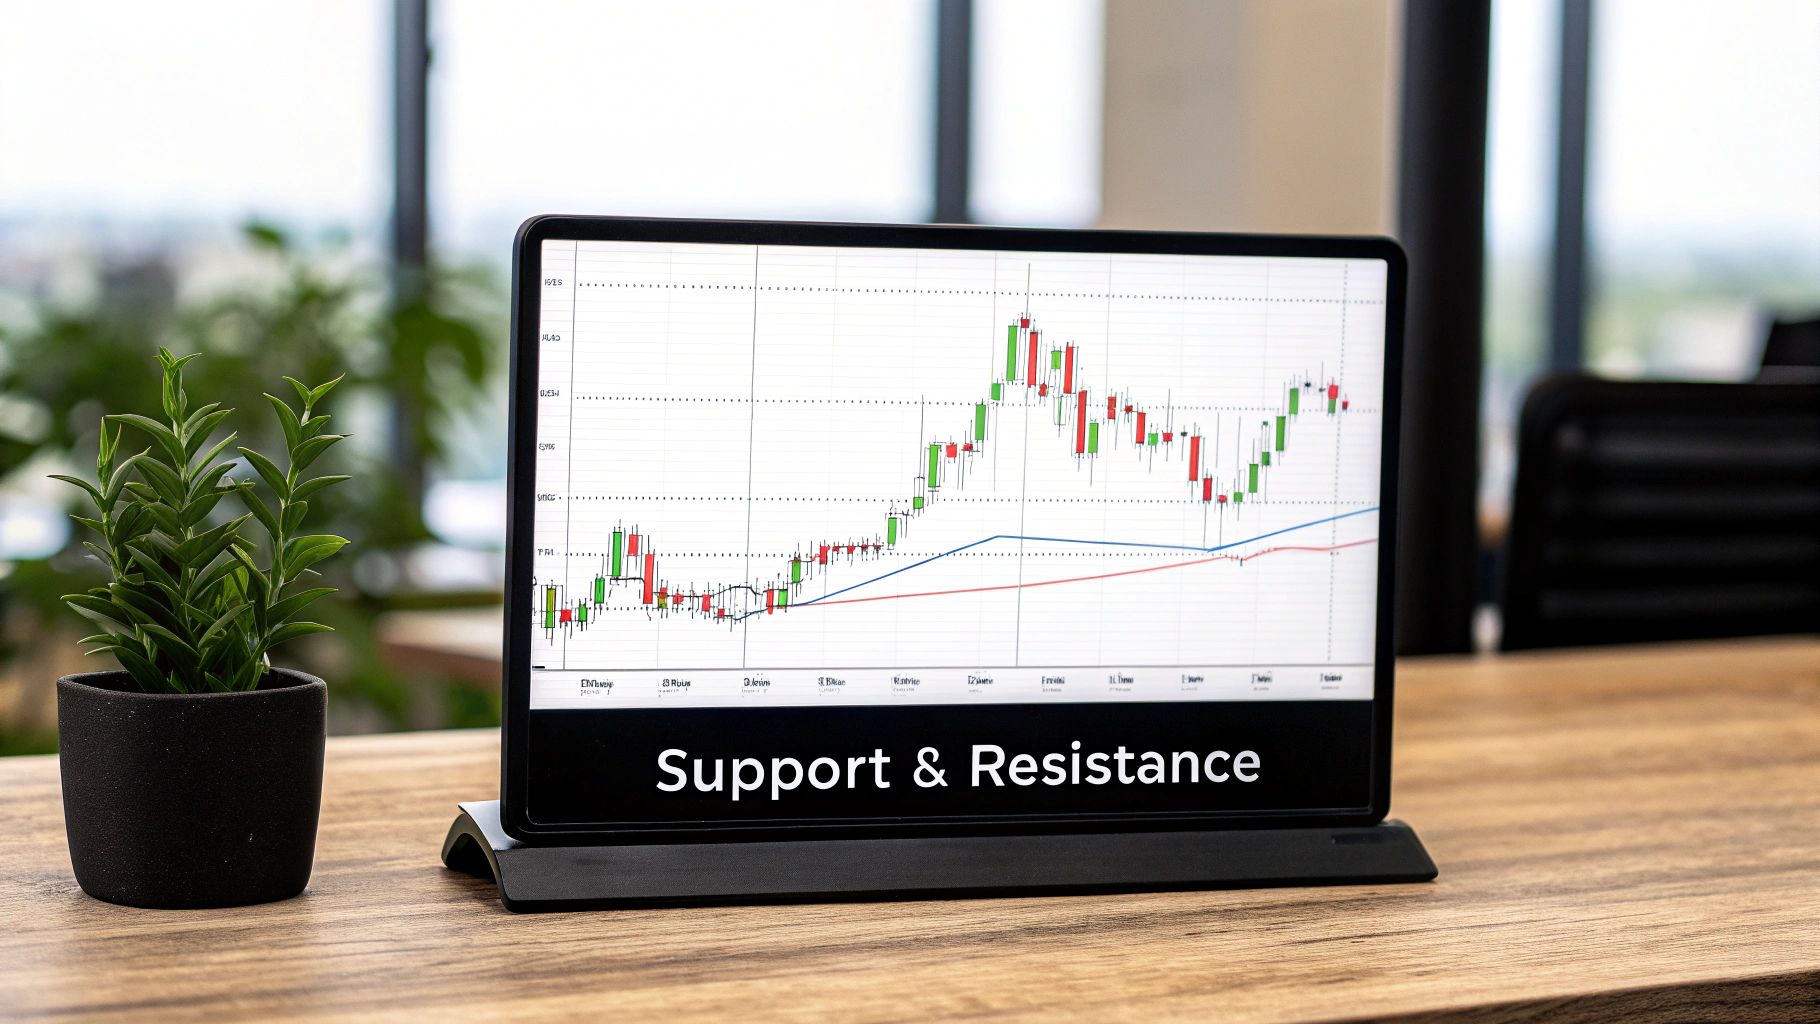
Finding Where the Smart Money Hides
Great price action trading doesn’t start with an entry signal. It starts way before that, with you mapping out the market’s terrain to pinpoint the exact spots where institutional traders—the "smart money"—are probably laying their traps.
These are the psychological battlegrounds where price is almost guaranteed to react. Understanding this context is what separates high-probability setups from random guesses.
This means looking beyond simple horizontal lines on a chart. You're hunting for meaningful support and resistance zones. These aren't single price points; they're entire areas where buying or selling pressure has historically crushed the other side. Think of them as the market's memory.
Reading the Market's Structure
To find these zones, you first need a solid read on the market's current structure. Is it trending hard, chopping around in a range, or maybe looking tired and ready to reverse? The answer is always in the sequence of swing highs and swing lows.
- Uptrend: A clear series of higher highs and higher lows. Every dip is a potential opportunity for buyers to jump back in.
- Downtrend: A defined pattern of lower highs and lower lows. Every rally is a chance for sellers to re-establish control.
- Range: Price gets stuck between a floor (support) and a ceiling (resistance), unable to make any real progress in either direction.
By mapping out these swing points, you're doing more than just looking at old data. You're getting a live read on the balance of power between bulls and bears. This structural analysis is the absolute foundation of any price action trade worth taking.
A huge mistake I see traders make is cluttering their charts with lines on every tiny pivot. You have to ignore the noise. Focus only on the most obvious, significant swing points—the levels that practically jump off the screen. If you have to squint to see it, it’s not important enough for the big players to care about.
Let's say a stock is in a beautiful uptrend, making one higher high after another. That last major swing low, where buyers previously came in with force, is now a critical support zone. If the price pulls back to that level, it's not just a dip; it's a test of the bulls' resolve. This is exactly the kind of spot where you should be patiently waiting for a bullish candlestick pattern to give you the green light.
Beyond Horizontal Levels
While horizontal support and resistance are the bread and butter, the market rarely moves in perfectly straight lines. This is where you need to bring in dynamic levels to get the full picture.
Dynamic Trendlines
A trendline is simple but powerful. You connect the swing lows in an uptrend or the swing highs in a downtrend. It becomes a moving, diagonal line of support or resistance that guides the trend. A clean, decisive break of a well-established trendline is often one of the earliest warnings that the trend is losing steam.
Supply and Demand Zones
These are specific areas on the chart where price made an incredibly strong, explosive move away from a period of consolidation.
- Supply Zone: A tight area of sideways action right before a massive price drop. This signals an overwhelming surplus of sellers.
- Demand Zone: A similar consolidation area just before a huge spike in price, showing a concentration of eager buyers.
What makes these zones so potent is the idea that large, unfilled orders from institutional traders might still be sitting there, waiting. When price finally returns to that zone, those orders can get triggered, often causing a swift and predictable reaction.
Mastering price action means you learn to identify these key levels first. Then, you patiently wait for the market to come to you and show its hand. This proactive approach keeps you out of the market's random noise and laser-focused on only the A+ setups.
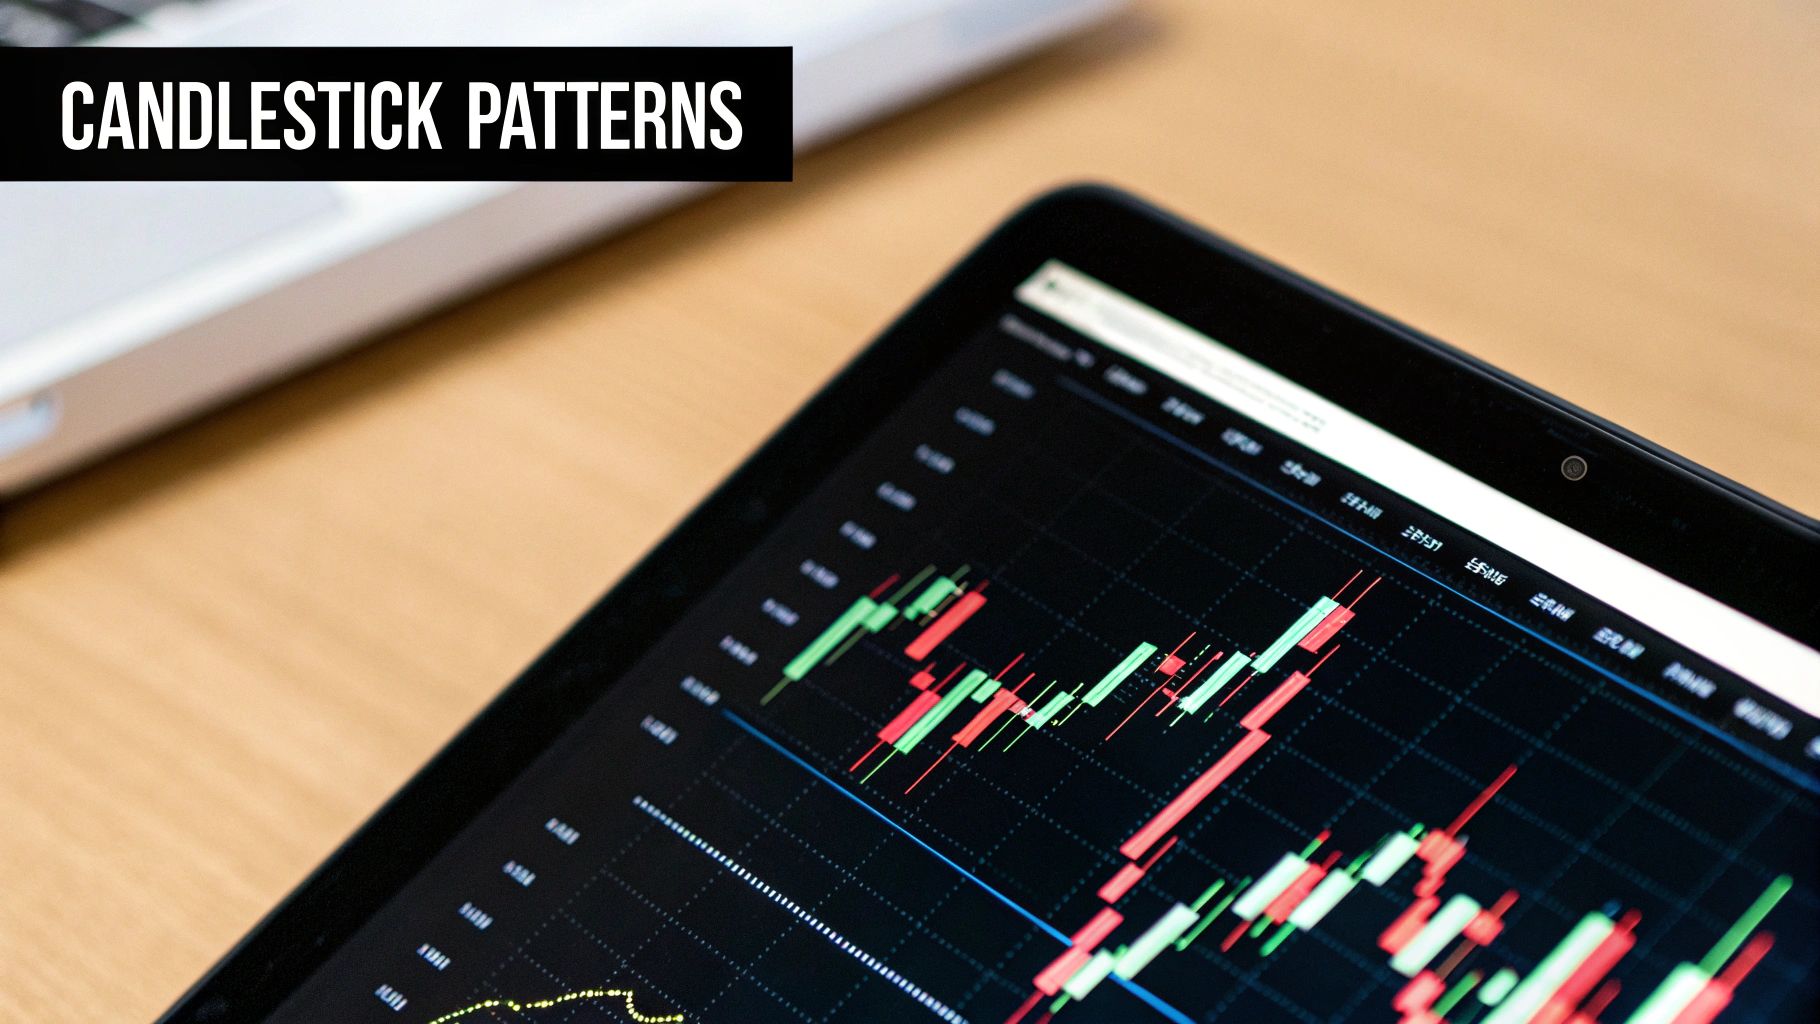
Mastering High-Probability Candlestick Patterns
So you've mapped out the key battlegrounds on your chart. Good. Now comes the hard part: waiting. Your job is to sit patiently for a clear signal that a power shift is underway. This is where high-probability candlestick patterns become your best friend—they're the entry triggers you've been looking for.
Don't think of these patterns as magic shapes. They're not. They are a compressed story of a single trading session, revealing the raw psychology and the final outcome of the fight between buyers and sellers at those critical levels you’ve already marked.
A pattern floating in the middle of nowhere is just noise. But that same pattern at a key support or resistance zone? That’s a signal, loud and clear. Remember, the single most important rule in price action trading is that context is everything. A powerful-looking pattern means nothing unless it forms at a pre-identified level of significance.
The Pin Bar Rejection Story
The pin bar is a classic reversal signal and, in my experience, one of the most reliable you'll ever find. You can spot it by its long wick (or tail) that "pins" through a key level, leaving a small body on the opposite end.
What's the story here? Imagine a long upper wick at a resistance level. This shows that buyers made a valiant attempt to force a breakout, pushing the price way up. But then, sellers came in with overwhelming force and slammed the price right back down, forcing it to close near its open. It’s a vivid picture of a failed breakout and a strong rejection of higher prices.
- Bullish Pin Bar: Sports a long lower wick rejecting a key support level. This tells you buyers absorbed all the selling pressure and are now in control.
- Bearish Pin Bar: Features a long upper wick rejecting a key resistance level, showing sellers completely overpowered the buyers.
The longer the wick, the more dramatic the rejection—and the more powerful the signal.
The Engulfing Bar Power Shift
Another dominant reversal signal I watch for is the engulfing bar. This pattern is made of two candles, where the body of the second candle completely swallows, or "engulfs," the body of the previous one.
This pattern signals a sudden, decisive shift in momentum. A bullish engulfing bar, for example, shows a small bearish candle followed by a huge bullish one that opens lower but closes much higher than the previous candle's entire range. It’s a visual knockout punch—buyers stepping in and completely overwhelming the sellers in a single session. This isn’t a subtle hint; it's a clear statement of control.
A common mistake traders make is focusing only on the engulfing candle itself. The size of the candle being engulfed is just as important. A massive bullish candle engulfing a tiny bearish doji is far more significant than one that just barely covers a medium-sized candle.
The Inside Bar Coiling Spring
The inside bar is a different beast. It signals consolidation and hints at a potentially explosive move to come. It's a small candle that trades entirely within the high-to-low range of the candle right before it, often called the "mother bar."
Think of the inside bar as the market taking a deep breath. Energy is coiling up like a spring, getting ready for its next big push. What makes this pattern so powerful is that it often leads to a clean breakout trade. When the price finally breaks above the mother bar’s high or below its low, it signals which direction all that coiled-up energy has been released.
I've found that truly understanding the psychology behind these formations is what separates novice traders from seasoned ones. To help you get a quick handle on what to look for, I've put together this simple reference table.
Key Price Action Patterns and Their Meaning
| Pattern Name | What It Looks Like | What It Signals |
|---|---|---|
| Pin Bar | A candle with a long wick and a small body on one end. | Rejection. Buyers or sellers tried to push the price but were forcefully rejected by the opposing side. Strong reversal potential. |
| Engulfing Bar | A large candle whose body completely covers the body of the previous candle. | Power Shift. A sudden and decisive takeover by either buyers (bullish) or sellers (bearish). Strong reversal signal. |
| Inside Bar | A small candle that trades entirely within the high-low range of the prior candle. | Consolidation. The market is pausing and building energy. Watch for a breakout from the "mother bar's" range. |
This table is just a starting point, of course. Mastering these core formations is a massive step forward in your trading journey. To get a more detailed look at these and other powerful setups, you can find a wealth of information in our complete guide to price action patterns. This is how you start to see beyond just bars on a screen and begin to read the real story the market is telling you.
Building a Case for Your Trade
Spotting a single candlestick pattern at some random price level isn't a strategy—it's a guess. This is a tough lesson for many, but it's the absolute key to unlocking price action trading. Experienced traders almost never risk their capital on one signal alone.
Instead, they build a logical case for every single trade. It's about stacking multiple pieces of evidence together until you have an undeniable, high-probability setup staring you in the face.
This powerful concept is known as confluence.
It’s the art of finding those sweet spots on the chart where several independent technical factors are all screaming the same thing. When you learn to pinpoint these areas, your odds of success skyrocket. You're no longer just following a pattern; you're trading from an area of immense technical strength.
The Confluence Checklist
Think of yourself as a detective building a case. You wouldn't go to trial with one flimsy piece of evidence, would you? Of course not. You'd want witness testimony, forensic data, and a clear motive all lining up perfectly. Trading is no different.
Before you even think about putting money on the line, run through a mental checklist. How many factors are backing up your trade idea?
Your mission is to find setups where you can confidently check off several of these boxes:
- Key Horizontal Level: Is your signal forming right at a major support or resistance zone with a history of holding?
- Market Structure: Does the trade actually go with the flow? (e.g., a bullish signal in a clear, established uptrend).
- Dynamic Level: Is there a trendline or a key moving average like the 21 EMA adding extra weight to the level?
- High-Probability Signal: Is the candlestick pattern itself clean and obvious? We're talking about textbook pin bars or massive engulfing bars, not weird, ambiguous candles.
Once you’ve gathered your evidence and the case is strong, you can move toward execution. The flow is always the same: find the setup, confirm the confluence, and then manage the trade.
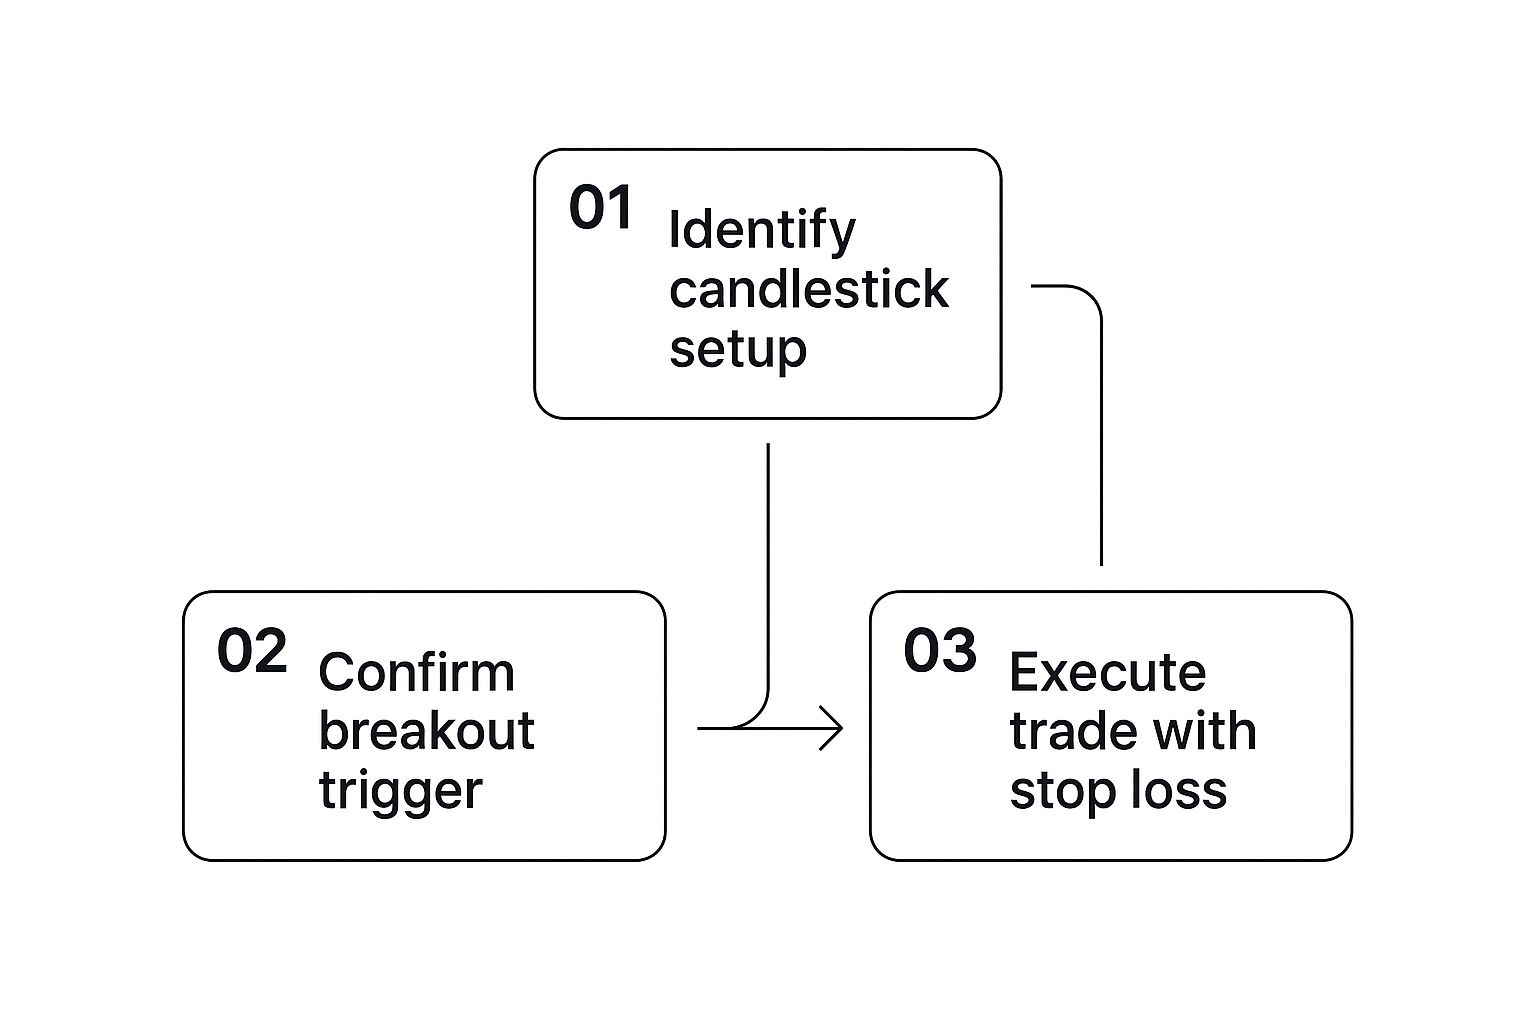
This process keeps you disciplined, ensuring you only act when the odds are stacked in your favor.
A core tenet of price action is that these combined signals dramatically boost a trade's probability. For example, a perfect pin bar rejection forming at a key horizontal support level that also lines up with a 50% Fibonacci retracement is a classic A+ confluence setup. If you want to dive deeper into how pros use these combinations, check out the great price action trading insights at learntotradethemarket.com.
Let's paint a picture. Imagine a stock is in a monster uptrend. It finally pulls back to a previous swing high, which you've marked as a potential new support level. As price touches that exact level, it also kisses the 21-period exponential moving average, and then a huge bullish engulfing bar prints. That's not one reason to go long—it's three powerful, independent reasons all converging at once.
Layering your evidence like this gives you the confidence to pull the trigger when a great setup appears. Just as importantly, it gives you the discipline to sit on your hands and do nothing when the evidence just isn't there.
By demanding confluence, you automatically filter out mediocre, coin-flip trades and focus your capital only on the very best opportunities the market has to offer.
Protecting Your Capital at All Costs
Let's get one thing straight. A powerful entry signal means nothing if one bad trade can blow up your account. Your number one job as a trader isn't finding winners; it's staying in the game long enough for your edge to actually work.
This is the exact spot where most aspiring traders crash and burn—not because their analysis is bad, but because their discipline is nonexistent.
What separates the pros from the gamblers? Effective risk management. And it all starts with setting a smart stop-loss. In the world of price action, this is never just some random number of pips or dollars you're comfortable losing. Your stop-loss has to be dictated by the market's structure.
This means placing it just beyond the key level or signal candle that completely invalidates your trade idea. For example, if you go long on a bullish pin bar at a support level, your stop-loss belongs just a few pips below the low of that pin bar's wick. If the price breaks that low, your reason for entering the trade is officially wrong. Time to get out. No questions asked.
Defining Your Reward-to-Risk Ratio
Once you've logically placed your stop, you can turn your attention to the fun part: your profit target. This is where you lock in gains and, more importantly, make sure your winners are substantially bigger than your losers. A core survival metric is maintaining a positive reward-to-risk ratio on every single trade.
A common target for disciplined traders is a 2:1 ratio or higher. This simply means for every dollar you risk, you're aiming to make at least two.
- Risk: The distance from your entry point to your stop-loss.
- Reward: The distance from your entry point to your profit target.
So, if you risk 50 pips on a trade, your minimum profit target should be 100 pips away. This simple rule has a massive mathematical impact over time. It means you can be wrong more often than you are right and still be a profitable trader.
Your trading strategy is only as strong as its weakest link, and that link is almost always risk management. Treat every dollar in your account as a soldier; don't send them into battle without a clear exit plan and a mission worth the risk.
This isn't just theory. Backtesting often shows that solid price action strategies can operate with drawdowns averaging under 15% while consistently targeting these 2:1 (or better) reward-to-risk ratios. You can find more practical insights on how professionals apply these principles over at FP Markets.
By letting market structure define your risk and demanding a worthwhile reward, you stop guessing and start executing with a calculated plan. This discipline is the absolute foundation of a long-lasting trading career.
Common Price Action Trading Questions
When you’re first digging into price action, a few questions always seem to bubble up. It’s totally normal to wonder about the finer points of how this all works in the real world. Let's clear the air and tackle some of the most common ones I hear from traders.
One of the first things people ask is about timeframes. Does this stuff actually work on a 5-minute chart the same way it does on a daily?
The short answer is a resounding yes. The principles behind market structure, candlestick patterns, and support and resistance are universal. They reflect market psychology, and that doesn't change whether you're looking at a year's worth of data or just the last hour.
That means you can scalp on a 1-minute chart or swing trade on a weekly chart using the exact same concepts. That said, I've found that higher timeframes—like the 4-hour and daily—tend to give more reliable signals. They filter out a lot of the intraday noise and show you the bigger picture.
Can I Still Use Indicators?
Another big question is whether you need to ditch all your indicators. While pure price action trading means working with a "naked" chart, you don’t have to go cold turkey. It's not about being a purist; it's about finding what helps you make better decisions.
Some traders find blending one or two simple tools with their analysis adds an extra layer of confirmation.
For instance, adding a simple moving average, like the 21 EMA, can be a great way to spot dynamic support and resistance. It complements your analysis of horizontal levels without cluttering your view. The key is to avoid "analysis paralysis"—that feeling of being overwhelmed by conflicting signals from too many indicators. Keep it clean.
Your goal should be to use an indicator as a complementary tool, not as your primary decision-maker. The price itself should always be your main focus.
How Long Does It Take to Get Good at This?
Finally, everyone wants to know: how long until I master this? You can learn the basic patterns and concepts in a few weeks, but getting consistently profitable is a marathon, not a sprint. True mastery takes months, sometimes years, of dedicated screen time and disciplined practice.
For more hands-on advice to help speed up that learning curve, you can check out these seven price action tips that work.
The journey really comes down to a few key habits:
- Focusing on just one market and one strategy at a time.
- Keeping a detailed trading journal to track your setups.
- Learning from every single trade, whether it was a winner or a loser.
There are no shortcuts here. But with consistent effort and a solid focus on the core principles, you can definitely develop the skill and intuition needed to read the market like a pro.
At Colibri Trader, we specialize in providing the clear, no-nonsense guidance you need to master price action. Our action-based programs are designed to transform your trading skills and build lasting confidence. https://www.colibritrader.com