


How to Trade Using Price Action: Master Smarter Strategies
When you trade with price action, you're essentially learning to read the market's story straight from a clean chart, without the clutter of lagging indicators. It’s all about analyzing candlestick patterns and the overall market structure to see the tug-of-war between buyers and sellers in real-time.
This direct approach helps you make more informed and proactive trading decisions.
The Philosophy of Trading Naked Charts
At its heart, learning price action is like learning a new language—the native tongue of the market itself. Forget about layering your charts with oscillators, moving averages, or other indicators that just crunch past price data. You're focusing on the raw data. This is what many of us call "trading naked."
Every single candlestick tells part of a bigger story. It shows you the outcome of the constant battle between the bulls pushing prices up and the bears shoving them back down. By learning to interpret these individual candles and the patterns they create together, you get a direct line into market psychology.
The whole approach is built on a simple, powerful belief: all the important market information is already baked into the price. Economic reports, breaking news, institutional order flow—it all ultimately shows up as price movement on your chart. So, what’s the most direct way to analyze the market? Just analyze the price itself.
Why Price Action Trading Works
The real power of this method lies in its simplicity and directness. Think about it: indicators, by their very nature, are lagging. They are just mathematical formulas based on what has already happened.
Price action, on the other hand, is happening right now. This gives you a serious edge when it comes to timing your entries and exits with much better precision.
Seasoned traders tend to gravitate towards this strategy for a few key reasons:
- It's Universal: The core principles of price action apply to any market you can pull up on a chart—Forex, stocks, commodities, crypto. The human emotions of fear and greed that drive markets are the same everywhere.
- It's Timeless: The patterns that signaled major reversals a hundred years ago still work today. Why? Because they're based on predictable human behavior under pressure, and that never really changes.
- It Brings Clarity: A clean chart strips away all the noise and helps you avoid "analysis paralysis." You're forced to focus only on what truly matters—where the price is going and the story it's telling you.
“The market is a device for transferring money from the impatient to the patient.” – Warren Buffett
This quote perfectly sums up the discipline price action demands. It isn't about frantically searching for a signal on every candle. It’s about patiently waiting for a high-quality setup to emerge at a significant level on your chart.
Price Action vs Indicator-Based Trading
To really grasp the difference, it helps to see how price action stands apart from indicator-heavy strategies. While you can make money with both, their core philosophies are worlds apart. Seeing them side-by-side can help you figure out which style really clicks with your personality as a trader.
| Aspect | Price Action Trading | Indicator-Based Trading |
|---|---|---|
| Primary Focus | Raw price movement, candlestick patterns, and market structure (support/resistance). | Mathematical formulas derived from past price and/or volume (e.g., RSI, MACD). |
| Signal Generation | Proactive. Signals are generated in real-time as price interacts with key levels. | Reactive. Signals are generated after the price has already made a move. |
| Chart Appearance | Clean and minimalist, often with only horizontal lines or trend lines. | Often cluttered with multiple overlays and sub-charts for different indicators. |
| Trader Mindset | Discretionary and interpretive. Relies on reading market context and psychology. | Systematic and mechanical. Relies on specific indicator crossovers or values. |
Ultimately, choosing to learn how to read price action is a commitment to understanding the why behind the market’s moves, not just reacting to the what.
By studying the open, high, low, and close (OHLC) prices across different timeframes, you observe how patterns form around key support and resistance levels to anticipate where the price is headed next. By focusing on these core elements, you're not just learning a strategy; you're building a robust and adaptable trading skill that can serve you for a lifetime.
Identifying The Market’s Architectural Blueprint
When you look at a price chart, you’re not simply seeing random bars. You’re seeing a landscape carved by buyers and sellers. Before you pull the trigger on any trade, you owe it to yourself to map out the terrain—the market’s blueprint.
That framework reveals the key battlegrounds where large moves start and finish. These aren’t thin lines; think of them as thick walls built on clusters of orders.
The Bedrock Of Support And Resistance
At the heart of every chart lie support and resistance zones. These horizontal bands act like the floor and ceiling in a room.
- Support: A price floor where demand gathers and a downtrend often pauses.
- Resistance: A price ceiling where selling pressure mounts, halting or reversing uptrends.
To spot them, scan your chart for repeated peaks and troughs at the same level. Then, draw these not as single lines but as wide boxes—you’re capturing the full range where institutional orders live.
A level respected on a daily chart for six months carries far more weight than one formed on a 15-minute chart an hour ago.
That said, the real magic kicks in when these roles swap. A broken support often flips into new resistance. And a breached resistance can morph into fresh support—ideal entry signals when that role reversal happens.
Drawing And Interpreting Trend Lines
While support and resistance sit horizontally, trend lines lean diagonally to reveal momentum. They link the swing lows in an uptrend or the swing highs in a downtrend.
- A valid uptrend line connects at least two, ideally three, ascending lows.
- A downtrend line ties together at least two descending highs.
Each bounce off these lines confirms the trend’s strength. Think of trend lines as dynamic support or resistance—shifting as the market advances.
Understanding Supply And Demand Zones
Supply and demand zones take things a notch further by highlighting pockets of order imbalance.
- Demand Zone: An area with a high concentration of unfilled buy orders, often followed by a sharp rally away from a base.
- Supply Zone: An area packed with unfilled sell orders, typically triggering a swift drop from consolidation.
These zones form when price surges away from a tight range, leaving “hungry” orders behind. On a revisit, those trapped orders tend to kick in. In practice, this entire framework dovetails with what traders call market structure, the sequence of highs and lows that defines any trend.
By plotting support, resistance, trend lines and supply/demand zones, you’re no longer just watching candles—you’re reading the underlying architecture that drives price. That insight lets you anticipate reactions and craft high-quality trades.
Decoding High-Probability Candlestick Signals
Trading price action is like tuning into the market’s heartbeat. After you’ve defined swing highs and lows, trend lines and key levels, each candlestick becomes a message. I’ve seen newcomers chase dozens of patterns—only to miss the handful that truly work. Over time, I learned that a few reliable signals, read in the right context, beat memorizing every shape.
True price action trading is about reading supply and demand. A pin bar flashing at a multi-year support line can carry a 70%+ win rate. That same pin bar caught mid-range, though? It’s likely just noise.
The Power Of The Pin Bar
The Pin Bar specializes in dramatic rejection. Its long wick tells the story:
- Bullish Pin Bar: A deep lower wick touches support, then price snaps back near the open.
- Bearish Pin Bar: An extended upper wick at resistance, then price retreats to close lower.
I once spotted a daily EURUSD setup where a bullish pin bar formed exactly on the 1.1000 psychological level and a trend-line confluence. My entry was just above the close, stop beneath the tail, target at the next swing high—and I banked 120 pips in two days.
The longer the wick, the sharper the market rejection—and the stronger the signal.
Pro Tip: Avoid pin bars in low-liquidity sessions. They can look convincing but often fake out.
The Decisive Engulfing Candle
Engulfing patterns are about outright control shifts—no second-guessing needed.
- Bullish Engulfing: A small red candle is completely “eaten” by a larger green candle that opens lower but closes above the prior high.
- Bearish Engulfing: A tiny green candle followed by a big red one that opens above but closes below the previous low.
These work best at clear pivot points. My favorite tactic: wait for the engulfing candle to close, then enter on a minor pullback to its body. I place my stop just beyond the engulfed candle’s extreme and aim for the next structural level. Consistency over complexity.
The Coiling Spring Inside Bar
An Inside Bar marks a market pause—like a spring winding tighter.
- Occurs when a smaller “inside” candle sits entirely within its “mother bar.”
- In a trend, a break above (or below) the mother bar signals continuation.
On a recent AUDJPY 4H chart, an inside bar broke out on rising volume, triggering a 150-pip move. The tighter the mother bar, the closer you can set your stop.
For a deeper look at how these and other candles behave, see our guide on Japanese Candlestick Patterns.
Context And Confluence: The Ultimate Filters
Candlesticks alone give you a glimpse. Layer in confluence—multiple technical factors—and you build high-probability trades.
Imagine this Forex scenario:
- A bullish pin bar at a horizontal support zone.
- That level also marks the 61.8% Fibonacci retracement of the prior upswing.
- RSI sits in oversold territory, and volume spikes on the pin bar day.
That stack of signals often lifts win rates above 60%–70%, especially when you risk 1%–2% of your account per trade. Always journal your entries and exits to refine your edge.
To explore more on aligning these factors, check our article on price action in the Forex market.
By concentrating on patterns that form within these confluence zones, you filter out random noise and let the market’s true voice guide your decisions.
From Chart to Trade: A Complete Price Action Walkthrough
This is where the rubber meets the road. All the theory about patterns and levels is great, but executing a trade from start to finish is what actually matters. A solid price action trade isn't a random punt; it's a disciplined process, a series of steps that, when followed, put the odds firmly on your side.
Let's walk through a classic setup I see all the time.
Imagine we've got the daily chart for GBP/USD open. For the last few weeks, it's been in a clear, undeniable uptrend—a steady march of higher highs and higher lows. This is our starting point, our context. With a trend this strong, I'm only interested in one thing: finding a smart place to buy. Fighting the dominant trend is a quick way to empty your account.
Finding the Sweet Spot: The Power of Confluence
Okay, so we know we want to buy. But where? The next job is to hunt down a key level on the chart where we expect the market to react.
As I scan the chart, a specific horizontal area jumps out. It was a stubborn resistance level a while back; the price tried and failed to break through it twice before finally powering higher. Now, that old resistance is a prime candidate to become new support. It’s a textbook price action principle, and a reliable one at that.
Now comes the hard part: waiting. I need the price to pull back to my level. Chasing a move that’s already taken off is a classic rookie mistake that gets traders into trouble. We let the market come to us.
As GBP/USD retraces, it finally kisses our support zone. And right on cue, a beautiful bullish Pin Bar forms. You can see its long lower wick sticking out, a clear sign that buyers aggressively stepped in and rejected lower prices.
This is the confluence I was waiting for. It’s a trifecta of signals all pointing in the same direction:
- We have a strong, established uptrend.
- Price has pulled back to a key horizontal support level (that used to be resistance).
- A high-probability bullish candlestick signal (the Pin Bar) has just printed.
When you get these three things lining up, it’s a bright green light to start planning the trade.
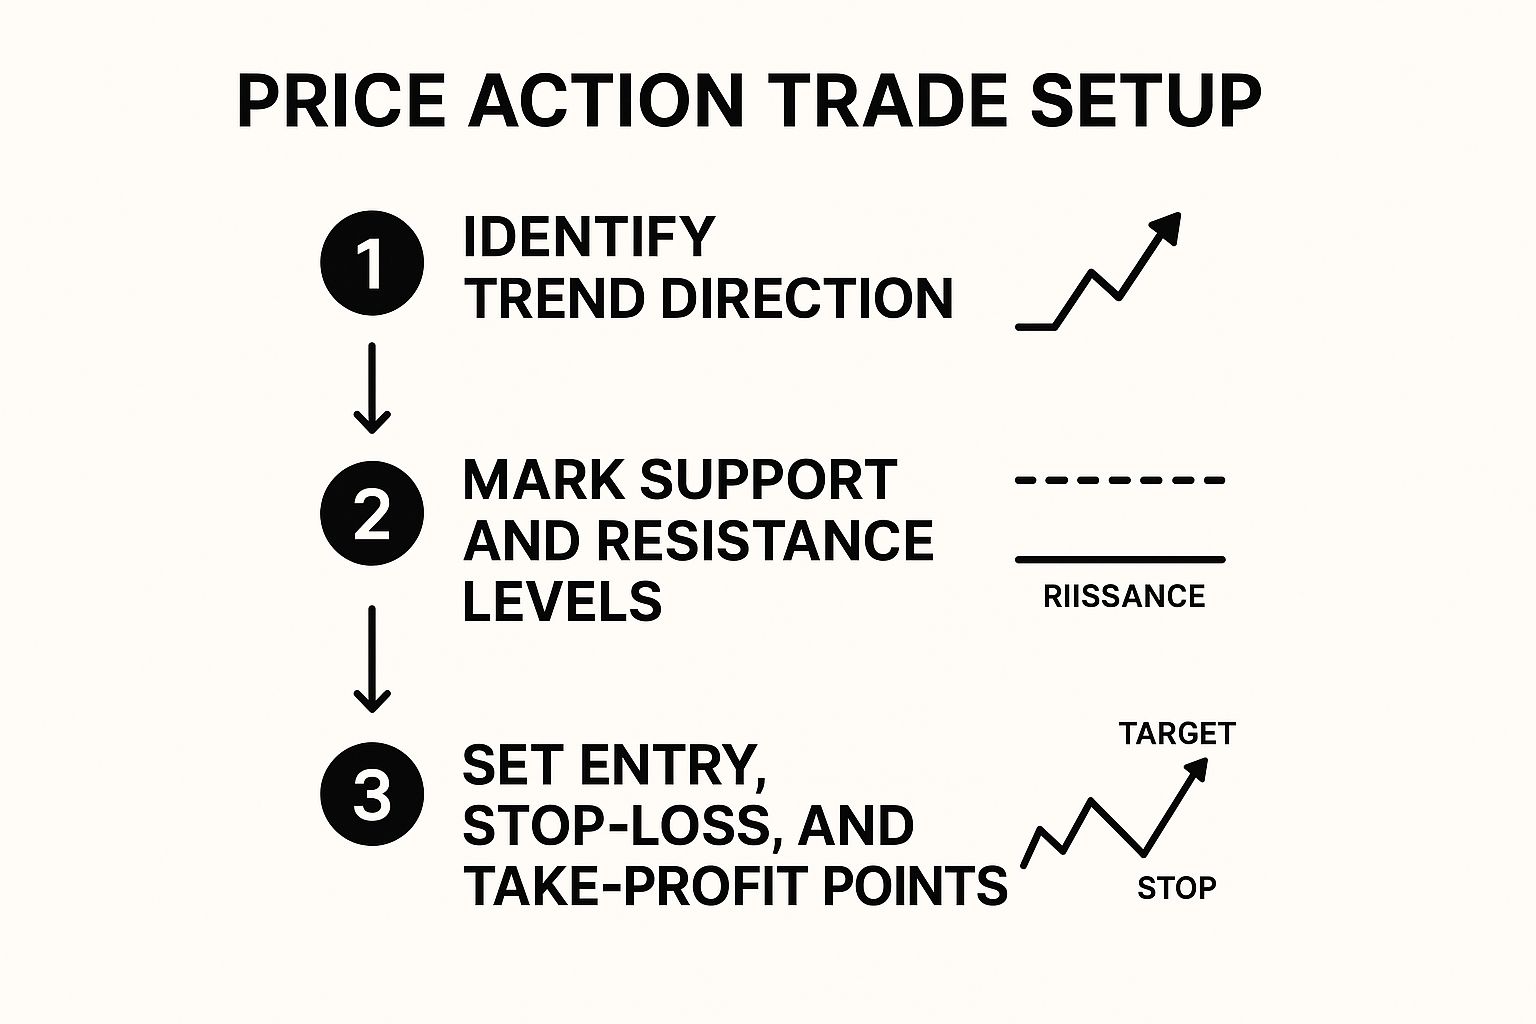
This process—identifying the trend, marking your level, and waiting for a signal—is the core loop of price action trading. It’s not about guessing; it's a structured, repeatable plan you can apply to any chart.
The Trade Plan: Entry, Stop Loss, and Target
With our signal confirmed, it's time to get specific. Vague plans are useless in the heat of the moment; we need exact parameters.
- The Entry: I’d place a buy stop order just a few pips above the high of that Pin Bar. This way, I’m only getting into the trade if the market shows immediate bullish momentum and validates the signal. No confirmation, no trade.
- The Stop Loss: The most logical spot for the stop-loss is right below the low of the Pin Bar's long wick. This is our line in the sand. If the price breaks below that wick, my trade idea is wrong, and I want to be out immediately with a small, controlled loss.
- The Profit Target: I'll look left on the chart to find the next significant resistance area, which is usually the most recent swing high. That becomes my initial target. Critically, the distance to that target needs to be at least twice the distance to my stop loss, giving me a solid risk-to-reward ratio of 1:2 or better. I don't take trades that don't offer this.
Plan the trade, then trade the plan. By defining your entry, stop, and target before you ever click the buy button, you take emotion out of the driver's seat. Your only job is to execute.
This human ability to read the charts—to see the story the candles are telling—is a massive edge. It's more than just memorizing patterns. Research is starting to back this up, with a 2024 study showing that a trader's skill in interpreting nuances like candle rejections and trend strength significantly improves results over purely automated systems. If you're interested, you can read the full research about these price action findings. It confirms what experienced traders have known for years: this is a skill worth mastering.
Before jumping into any trade, I run through a quick mental checklist to make sure all the boxes are ticked. This keeps me disciplined and prevents me from taking subpar setups.
Trade Setup Checklist
| Checklist Item | Description | Status (Yes/No) |
|---|---|---|
| Clear Market Trend? | Is the market in an obvious uptrend or downtrend on my chosen timeframe? | |
| Key Level Identified? | Have I marked a clear support or resistance level that price is reacting to? | |
| High-Quality Signal? | Is there a clean, obvious candlestick pattern (like a Pin Bar or Engulfing Bar)? | |
| Confluence Present? | Do at least three factors (trend, level, signal) align to support the trade? | |
| Favorable Risk/Reward? | Is the potential profit target at least 2x my potential risk (1:2 RR)? | |
| Clear of Obstacles? | Is there any immediate opposing price structure between my entry and target? |
Using a simple checklist like this is one of the best ways to ensure you’re only taking A+ setups. If I can't check "Yes" on all these items, I simply pass on the trade and wait for the next opportunity. There will always be another one.
Smarter Risk Management for Price Action Traders
Let's get one thing straight: you will never win every single trade. It's a fantasy. Real, long-term profitability in trading has nothing to do with a perfect win rate. It's all about one simple equation: making sure your winners earn you more money than your losers cost you.
This is where smart risk management, specifically tailored for price action, becomes your most critical skill.
A lot of traders hear the generic "risk 1% per trade" rule and just stop there. While it's a solid starting point, price action analysis lets you get a lot more dynamic and intelligent with your risk. Your strategy shouldn't be a one-size-fits-all rule; it should adapt to the story the market is telling you right now.
Position Sizing Based on Volatility
A powerful price action signal, like a big, obvious Pin Bar, is giving you a direct message about the market's current volatility. The distance from your entry (just above the Pin Bar's high) to your stop-loss (just below its low) is a measure of that volatility.
So, instead of just trading a fixed lot size every time, you should be calculating your position size based on this specific information.
- Got a wide-range Pin Bar? The distance to your stop is bigger. To keep your risk consistent (say, 1% of your account), your position size has to be smaller.
- Trading a tight Inside Bar breakout? The distance to your stop is much smaller. This allows you to take on a larger position size while keeping that same 1% dollar risk.
Using this method means you're actually risking the same percentage of your capital on every setup, no matter how different they look. It takes all the guesswork out of it and standardizes your risk.
The professional trader thinks in terms of risk first and reward second. The amateur does the opposite. Honoring your stop-loss, especially when it hurts, is the single greatest act of discipline that separates the two.
The Non-Negotiable Risk-to-Reward Ratio
One of the huge advantages of trading with pure price action is the clarity it provides. You can define your exact entry, stop, and target levels before you even think about clicking the buy or sell button. This makes calculating your risk-to-reward ratio (R:R) dead simple, and this ratio is a non-negotiable part of any serious trading plan.
As a rule, you should only even consider trades where the potential reward is at least twice your potential risk. That means a 1:2 R:R or better.
Think about it this way: if your stop-loss is 50 pips from your entry, your profit target must be at least 100 pips away. If the next major resistance level is only 70 pips away, the trade simply doesn't make sense. The reward isn't good enough for the risk you're taking. You have to have the discipline to just let that trade go and wait for a better one.
Managing a Live Trade Like a Pro
Once you're in a trade, your job isn't done. How you manage the trade from here can be the difference between a small win and a big one, or a small loss and a scratch trade. Two techniques are absolutely essential for price action traders.
- Moving to Breakeven: As soon as the trade moves in your favor by a distance equal to your initial risk (a 1:1 R:R), slide your stop-loss to your entry price. Instantly, the risk is off the table. The worst thing that can happen now is a breakeven trade.
- Trailing Your Stop-Loss: As the trade keeps running in your favor, you can trail your stop-loss behind it to lock in your open profits. A classic price action method is to manually move the stop just below the low of each new higher swing low in an uptrend (or above each new lower swing high in a downtrend).
These simple moves shift a trade from a position of risk to a position of strength. But remember, the hardest part of risk management is psychological. During a losing streak—and trust me, they will happen—your rules are the only thing you have. The discipline to stick to your risk plan, even when you're frustrated and seeing red, is the true mark of a trader who's built to last.
Common Questions About Price Action Trading
As you dive into the world of price action, you're bound to have questions. That’s a good thing—it means you're engaged in the process. I’ve put together some straight answers to the hurdles and curiosities I see pop up most often with new traders.
A common one is whether price action is only for certain markets. Here's the good news: its greatest strength is that it works everywhere. You can apply these principles to Forex, stocks, commodities, and even cryptocurrencies with confidence.
Why? Because it’s all based on the raw human psychology of fear and greed. Those emotions drive prices in every market on the planet, making this a truly universal skill.
What Is the Best Timeframe to Use
There’s no magic "best" timeframe. The right one comes down to your trading style and, frankly, your personality. That said, higher timeframes like the Daily or 4-Hour charts generally give more reliable signals.
They do a great job of filtering out the intraday "noise" and give you a clearer picture of what the larger market players are doing.
But if you prefer a faster pace, the same principles work just fine on lower timeframes for day trading. The real key is consistency. Pick a timeframe and stick with it until you develop a real feel for its rhythm.
Proficiency in price action isn’t about finding the perfect timeframe. It’s about mastering the timeframe that fits your life and psychology, and then executing with discipline.
Can I Combine Price Action with Indicators
While the purest form of price action trading uses a completely "naked" chart, some traders do find it helpful to use a simple indicator or two for confirmation. A common approach is using a moving average, like the 20 EMA, to help visually confirm the trend's direction and strength.
But here’s the critical rule: price action always comes first. Your indicators are there to support your analysis, not lead it. If your chart starts getting cluttered or an indicator is telling you something that contradicts a clear price signal, you’re relying on it too much.
How Long Does It Take to Get Good
This is the million-dollar question, and the honest answer is: it's different for everyone. You can learn the basic patterns and concepts in a few dedicated weeks. But true proficiency—that intuitive feel for the market, the discipline to execute flawlessly, and the mental game—that's a longer journey.
Most traders should expect to put in several months to a year of daily practice, chart review, and journaling to build real confidence. There are no shortcuts here. Screen time is the only way to build this skill. It's not about memorizing a few patterns; it's about deliberate, consistent practice.
At Colibri Trader, we provide the structured education and mentorship to shorten that learning curve. We focus on the practical application of price action, helping you build a durable skill set for consistent profitability. Discover your trading potential with our proven methods.