


How to Make Money Trading Stocks A Real Guide

Making money from trading isn't about hitting jackpots or following hot tips. Forget that. Real, consistent profitability comes from a disciplined process: learning to read the charts, building a strategy with iron-clad rules for getting in and out, and, most importantly, managing your risk like a hawk.
This is a business, not a casino trip. Success hinges far more on how you handle your losses and your own psychology than it does on picking the next big winner.
Build Your Foundation for Trading Success
Before you even dream of clicking the "buy" button, you have to lay the groundwork. This is where so many new traders go wrong—they jump in with dollar signs in their eyes and zero preparation, and the market eats them for lunch.
This first phase is all about setting up your trading operation the right way. It's about getting the right tools, clarifying your goals, and adopting the mindset of a professional from day one.
Clarify Your Market Approach: Trading vs. Investing
First things first, you need to be crystal clear on what game you're playing. Trading and investing both happen in the stock market, but they are entirely different disciplines. Their philosophies, timeframes, and goals are worlds apart.
- Investing is the long game. It’s about buying into companies you believe have a solid future and holding on for years, sometimes decades. Investors are looking to build wealth slowly through company growth, compounding, and dividends. They ride out the market's bumps along the way.
- Trading is a completely different beast. It's all about capitalizing on short-term price swings. A trader's goal is to profit from volatility over minutes, days, or weeks. Frankly, we don't care much about the company's five-year plan; we care about where the price is headed right now.
As a trader, your world revolves around technical analysis and price action, not balance sheets and earnings reports. Making this distinction upfront shapes every single decision you'll make, from which stocks you watch to how you manage your money.
To put it in perspective, here's a quick breakdown of how these two approaches stack up.
Trading vs. Investing Key Differences
| Attribute | Trading | Investing |
|---|---|---|
| Time Horizon | Short-term (minutes to months) | Long-term (years to decades) |
| Goal | Generate quick profits from price swings | Build wealth through compounding and growth |
| Methodology | Technical analysis, chart patterns, indicators | Fundamental analysis, company financials |
| Frequency | High (multiple trades per day/week) | Low (a few buys/sells per year) |
| Risk | Higher, due to leverage and volatility | Lower, spread out over time |
| Psychology | Requires discipline, emotional control | Requires patience, long-term conviction |
This table isn't about which is "better"—it's about which is right for you. As a trader, your entire focus is on the left column.
Choose the Right Tools for the Job
Your brokerage account is your primary tool. It's your connection to the market, and choosing a bad one is like trying to be a race car driver with a beat-up sedan. High commissions and slow execution will bleed you dry, especially if you're an active day trader.
Look for a broker that offers:
- Low Commissions and Fees: Every cent you pay in fees is a direct hit to your bottom line.
- Fast and Reliable Execution: In a fast-moving market, a one-second delay can be the difference between a profit and a loss.
- Advanced Charting Software: Professional-grade charts are absolutely non-negotiable. This is how you read the market.
Think of your trading platform as your office. You wouldn't run a business with a faulty computer and a dial-up connection. A subpar broker handicaps you before you even place your first trade.
Understand the Global Market Landscape
Knowing how to make money trading also means knowing where to trade. The global stock market is massive, but the opportunities aren't spread out evenly.
For instance, in 2024, U.S. stock markets accounted for roughly 60% of the entire world's equity market value. This is dominated by giants like the NYSE and NASDAQ. What does that mean for you? It means the lion's share of liquidity and volatility—the lifeblood of a short-term trader—is happening in the U.S. markets. These markets set the tone for the rest of the world.
You can get more details on this global breakdown from Statista's latest report.
Determine Your Starting Capital
This is the big question everyone asks: "How much money do I need to start?"
There's no magic number, but I'll tell you this: starting with too little is a recipe for disaster. When you're undercapitalized, you're forced to take huge risks just to make a meaningful profit. That pressure almost always leads to blowing up your account.
A good rule of thumb is to start with an amount you can genuinely afford to lose. This isn't pessimism; it's strategy. When you aren't terrified of losing the money in your account, you can trade with a clear head and stick to your plan—which is the only way to win in the long run.
Learn to Read the Story of the Charts

If you want to make money trading stocks consistently, you have to learn to read the language of the market. Every single chart tells a story—a raw, unfiltered battle between buyers and sellers.
Forget the news headlines and dense financial reports for a second. The price chart itself is the most honest source of information you'll ever get.
This is the world of technical analysis. We're not trying to predict the future with a crystal ball here. Instead, we're looking at historical price movements to spot patterns and probabilities. It’s all about finding a statistical edge that pays off over time.
The Foundation of Price Action
The purest and most powerful form of technical analysis is price action. This is the skill of making trading decisions based purely on the price movements you see on a "naked" chart, without the distraction of lagging indicators.
Think of it this way: every candlestick, every swing high, and every swing low is a footprint left by institutional money. Price is the ultimate truth. An indicator might scream "oversold," but if the price keeps dropping, who are you going to believe?
Learning to interpret price action directly is the single most valuable skill you can build as a trader.
It’s how you answer the make-or-break questions for any trade:
- Where is the market most likely to turn?
- Who's in control right now—the bulls or the bears?
- When is the absolute best moment to jump in with the least amount of risk?
Identifying Key Support and Resistance Levels
Picture a stock's price bouncing between an invisible floor and ceiling. That floor is support, a price level where buyers have historically stepped in with enough force to stop a downtrend cold. The ceiling is resistance, where sellers have consistently shown up to shut down a rally.
These aren't just random lines on a chart. They are major psychological battlegrounds where the big players—banks, hedge funds, institutions—place their massive orders.
- Support: Look for previous lows where the price turned around and shot higher. The more times a level has been tested and held, the more significant it becomes.
- Resistance: Find the previous highs where rallies ran out of steam and reversed. This is where sellers have proven they are in control.
When you see price approaching one of these major zones, it’s time to pay attention. A bounce can offer a fantastic, high-probability trading opportunity. A clean break through one can signal the start of a powerful new trend.
Key Takeaway: Support and resistance zones are where the market's memory is strongest. By trading around these areas, you align yourself with the likely actions of institutional capital, which puts the odds firmly in your favor.
Decoding Candlestick Patterns
Each candlestick on your chart is a miniature story from a specific trading session. It shows you the open, high, low, and close, revealing the power struggle between buyers and sellers. Certain formations give you powerful clues about what might happen next.
Here are a few of the most reliable patterns I watch for:
- Bullish Engulfing: A big green candle that completely "engulfs" the body of the prior small red candle. You'll often see this at the bottom of a downtrend, signaling buyers have just seized control and a reversal could be underway.
- Bearish Engulfing: The exact opposite. A large red candle swallows the previous green one, typically at the top of an uptrend. It's a clear warning that sellers have taken over.
- Doji: This is a candle with a tiny body, showing the open and close prices were almost identical. It screams indecision. After a strong trend, a Doji can be the first sign that the momentum is fading and a reversal is coming.
Imagine you spot a stock in a downtrend approaching a major historical support level. Then, a massive bullish engulfing pattern forms right on that level. Now you have multiple confirmations for a potential long trade—a much stronger setup than just buying because something "looks cheap."
Using Indicators for Confirmation, Not Direction
While price action must always be your primary guide, indicators can be useful tools for confirmation. The classic rookie mistake is relying on them for entry signals, which almost always gets you into trades late.
Indicators should only be used to support what the price is already telling you.
Let’s look at two popular ones:
- Moving Averages (MAs): These smooth out price action to help you see the underlying trend. A 50-day MA, for example, can act as dynamic support in a solid uptrend or as resistance in a downtrend.
- Relative Strength Index (RSI): This momentum oscillator tells you about the speed of price changes. A reading over 70 is considered "overbought," and below 30 is "oversold." This can help confirm exhaustion when price reaches a key level.
Never, ever take a trade just because an indicator tells you to. But if the price is hitting a brick wall of resistance and the RSI is flashing "overbought"? That's a powerful combination. If the RSI is overbought in the middle of nowhere, it means much less.
The story on the chart always comes first.
Develop Your Personal Trading Strategy
Knowing how to read a chart is one thing. Knowing exactly how you're going to use that information to make money is a whole other ball game.
Professional traders operate with a detailed flight plan, not a gambler's whim. This plan—your personal trading strategy—is what dictates your every move with cold, hard logic.
This isn't about uncovering some "secret" system. It's about building a repeatable, almost mechanical process that actually fits your personality, your schedule, and what you're willing to risk. It needs to define exactly what you trade, when you enter, where you take profits, and where you cut your losses.
Without one, you’re just clicking buttons.
Choosing Your Trading Style
First things first, you need to decide on a timeframe. Two of the most common and effective styles for traders starting out are day trading and swing trading. The main difference is simply how long you hold a position and the kinds of price moves you’re trying to catch.
- Day Trading: This is for the trader who wants to be "flat"—meaning all positions closed—by the end of each day. You'll make multiple trades, holding stocks for minutes to hours to snag small, intraday price moves. It demands intense focus when the market is open but frees you from any overnight risk.
- Swing Trading: This approach means you’re holding positions for several days to maybe a few weeks. The goal here is to capture a much larger "swing" in the price, like a multi-day rally or decline. It requires a lot less screen time than day trading but does expose you to whatever happens overnight or over the weekend.
There’s no "better" style. There's only the one that's better for you. Think about your daily schedule and, honestly, your emotional makeup. Can you handle the high-octane pace of day trading, or does the idea of capturing a longer, more relaxed trend sound more appealing?
Building Your Entry and Exit Rules
Once you've landed on a style, it’s time to define your exact rules of engagement. These rules have to be so crystal clear that there's zero room for guesswork or emotion when you're in the heat of a trade. A complete strategy lays out precise criteria for getting in, taking profits, and—most importantly—cutting losses.
Let's walk through building a sample swing trading strategy using some of the concepts we've already covered.
Sample Swing Trading Strategy: "The Support Bounce"
- Stock Universe: I will only trade large-cap stocks from the S&P 500. This gives me high liquidity and helps me avoid the wild, erratic moves you see in smaller stocks.
- Chart Timeframe: My main analysis will be on the daily chart. This is where I'll identify the overall trend and key price levels.
- Entry Trigger: I will only enter a long trade when all three of these conditions are met, no exceptions:
- The stock is in a clear uptrend (making a series of higher highs and higher lows).
- The price has pulled back to a major support level that I've already identified.
- A strong bullish candlestick pattern, like a bullish engulfing or a hammer, forms right at that support level.
- Exit Rule (Profit): I will sell half my position when the trade hits a 2:1 risk/reward ratio. The second half gets sold at the next major resistance level.
- Exit Rule (Loss): My stop-loss goes just below the low of the entry candlestick. This is non-negotiable. Period.
This level of specificity is what separates professional execution from amateur gambling. A detailed plan takes emotion out of the equation and lets you execute your edge consistently, trade after trade after trade.
Focusing on High-Opportunity Sectors
Not all stocks are created equal. Some market sectors have way more volume and volatility than others, and that directly impacts your chances of finding a good trade.
For example, Information Technology is still the dominant sector, holding the largest weighting in the S&P 500—an average of 33.09%. This is where you'll find some of the highest trading volumes and volatility, which means a ton of opportunities for traders. After that, you have the Financials sector, accounting for 14.03% of trading activity, and Consumer Discretionary at about 10.37%. If you focus your scanning efforts on these high-volume sectors, you're just mathematically more likely to find viable setups. You can dig into more 2025 sector trends at BestBrokers.com.
When you align your strategy with sectors that already have momentum and trader interest, you're essentially placing yourself in the strongest currents of the market. It stacks the odds in your favor. Your trading plan should absolutely specify which sectors or types of stocks you plan to focus on.
Master Your Risk Before You Master the Market
If there’s one secret that separates consistently profitable traders from the 90% who fail, it’s this: they obsess over defense, not offense.
How you manage your risk is infinitely more important than how you pick your winners. The goal isn't just to make money trading stocks; it's to survive long enough to let your strategy actually work.
Amateurs are always hunting for the perfect entry. Professionals know the exit—specifically, the point where they admit they are wrong—is the only part of the trade they can truly control. This is the world of risk and money management, and it's completely non-negotiable.
The Power of the 1% Rule
The cornerstone of sound risk management is a simple but incredibly powerful principle: the 1% rule. This rule states that you should never, ever risk more than 1% of your total trading capital on any single trade.
Got a $20,000 account? Your absolute maximum loss on one trade is $200. Have a $50,000 account? That number is $500. This isn't just a friendly suggestion; it's your primary survival mechanism in the markets.
Adhering to the 1% rule makes you psychologically bulletproof. It ensures that no single trade—no matter how disastrous—can ever knock you out of the game. You could be wrong 10 times in a row and still have only lost 10% of your account, ready to fight another day.
This approach forces you to think in terms of probabilities and longevity rather than chasing one massive, account-doubling win. It’s the foundation that a sustainable trading career is built on.
Your Non-Negotiable Tool: The Stop-Loss Order
So, how do you actually enforce this 1% rule on every trade? With a stop-loss order. A stop-loss is a pre-set order you place with your broker to automatically sell your position if the stock hits a specific price. Think of it as your ultimate safety net.
Placing a stop-loss is not a sign of weakness or an expectation of failure. It is a calculated business decision that defines your maximum acceptable loss before you even enter the trade. You must know where you're getting out before you get in.
For any trader looking to refine their technique, understanding the nuances of how to set a proper stop-loss is a critical skill that protects your capital and, just as importantly, removes raw emotion from the losing side of a trade.
The infographic below illustrates the simple, three-step process for building risk management into every single trade you take.
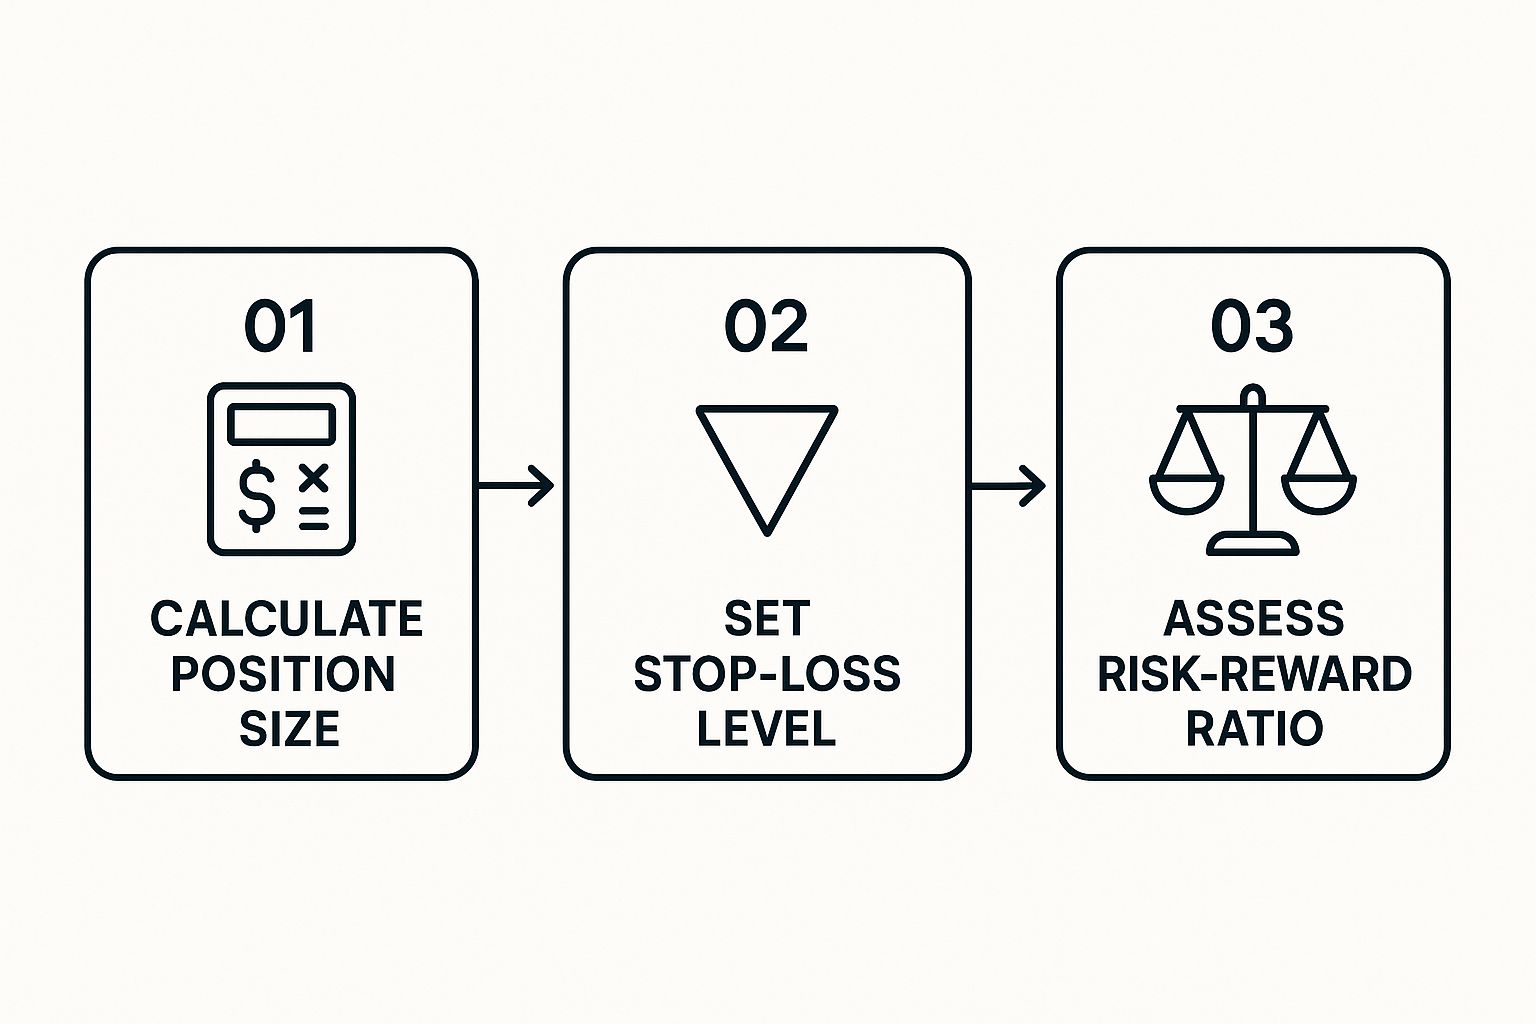
This visual shows that managing risk is a sequential process. It starts with calculating your position size and ends with a clear-eyed assessment of the trade's potential.
Position Sizing and The Risk-to-Reward Ratio
Once you know your stop-loss level and your 1% risk amount, you can calculate the most important variable of all: your position size. This is the precise number of shares you can buy or sell while honoring your risk limit.
Let’s walk through a real-world scenario to see how it works:
- Your Account Size: $30,000
- Max Risk (1%): $300
- Stock You Want to Buy: XYZ Corp at $50 per share
- Your Stop-Loss Price (based on chart analysis): $48.50
The distance between your entry and your stop is your per-share risk: $50 – $48.50 = $1.50 risk per share.
To find your position size, just divide your max risk by your per-share risk:
$300 / $1.50 = 200 shares.
That’s it. In this scenario, you can buy exactly 200 shares of XYZ. If the trade goes against you and hits your stop, you will lose $300, which is exactly 1% of your account. No more, no less.
To illustrate how this calculation changes with different stock prices and stop-loss levels, here is a practical table.
Position Sizing Example (1% Risk on $10,000 Account)
| Stock Price | Stop-Loss Price | Risk per Share | Max Shares to Trade |
|---|---|---|---|
| $25.00 | $24.50 | $0.50 | 200 |
| $50.00 | $48.00 | $2.00 | 50 |
| $100.00 | $99.00 | $1.00 | 100 |
| $200.00 | $195.00 | $5.00 | 20 |
As you can see, the correct number of shares to trade is determined by the trade's specific risk, not by guesswork or a gut feeling.
The final piece of this puzzle is the risk-to-reward ratio. This simply compares how much you stand to lose versus how much you stand to gain. A healthy trading strategy always aims for winning trades to be significantly larger than the losing ones.
For instance, if your risk is $1.50 per share (like in our example), you should only take the trade if your profit target is at least $3.00 away. This gives you a 1:2 risk-to-reward ratio. When your winners are double the size of your losers, you only need to be right more than 33% of the time to be profitable. This is how you stack the odds in your favor.
Cultivate the Unbreakable Mindset of a Trader
You can have the most profitable trading strategy on the planet, but it's completely worthless if your head isn't on straight. The mental game is where most aspiring traders wash out, long before their strategy ever gets a fair shot.
This is the final—and most important—frontier you have to conquer to consistently make money trading stocks.
The market is a relentless mirror. It reflects your deepest emotional flaws right back at you, and the feedback comes in the form of immediate financial consequences. It’s here that we have to confront the two most destructive forces in trading: fear and greed.
Taming the Account Killers: Fear and Greed
Fear is that nagging voice in your head, whispering, "Take the small profit now before it disappears!" just as a trade starts moving in your favor. It's the paralysis that keeps you from pulling the trigger on a perfect setup because your last trade was a loser.
In short, fear makes you cut your winners short and miss your best opportunities.
Greed is the flip side of that coin, but it's just as dangerous. It's the FOMO (Fear Of Missing Out) that baits you into chasing a stock that has already gone vertical, ensuring you buy at the worst possible price. Greed is what convinces you to hold a losing trade, praying it will come back, turning a small, manageable loss into an account-crippling disaster.
Trader's Truth: Your long-term profitability won’t be decided by your winning strategy. It will be determined by how you manage your emotions during a losing streak. Discipline is the only bridge between your strategy and your results.
To fight back against these impulses, you need objective tools and unwavering discipline. The goal is to build a system that can override your emotional brain when the pressure is on.
The Power of a Detailed Trading Journal
One of the most powerful tools for forging this discipline is a trading journal. And I'm not just talking about a simple log of your wins and losses. A proper journal forces you to analyze your emotional state right alongside your P/L.
For every single trade you take, you need to be documenting:
- The Setup: Why did you take this trade? What specific technical signals were present on the chart?
- Your Mindset: How were you feeling before, during, and after? Anxious? Confident? Impatient? Be brutally honest.
- The Outcome: Did you follow your plan to the letter, regardless of whether it was a win or loss?
Over time, you'll start seeing patterns you never knew existed. Maybe you consistently make impulsive trades right after a big win. Or perhaps you always hesitate on Mondays. This self-awareness is the first real step toward mastering your mental game. For a deeper dive, exploring additional tips on mastering your trading psychology can give you practical techniques to build on this.
Patience, Resilience, and Market Awareness
Beyond journaling, true mental toughness is built on two pillars: patience and resilience.
Patience is the discipline to sit on your hands and do absolutely nothing while you wait for that perfect, A+ setup that meets every single one of your rules. Your job is to be a sniper, not a machine gunner.
Resilience is your ability to take a hit, accept the loss as a simple cost of doing business, and move on to the next trade with a completely clear head. One loss should never impact your decision-making on the next opportunity.
A robust mindset also means being aware of the world outside your charts. Smart traders know how to capitalize on volatility driven by major economic events. For instance, in 2025, markets plunged amid increased volatility from sweeping tariff policies, marking the largest global decline since 2020.
Yet, when the U.S. administration paused those hikes on April 9, 2025, it triggered a massive rally, offering huge opportunities for traders who were prepared to act.
Mastering your mindset isn’t a one-and-done task; it’s a daily practice. By taming fear and greed, keeping a detailed journal, and cultivating patience, you build the unbreakable mental armor needed to survive and thrive in the world of stock trading.
Common Questions About Trading Stocks
Even with a solid trading plan in your back pocket, you're bound to have some lingering questions. It's only natural. Stepping into the world of trading brings up a lot of practical "what ifs" that don't always get covered in strategy guides.
Let's tackle some of the most common questions I hear. My goal is to give you direct, no-fluff answers to clear up any confusion so you can move forward with real confidence.
How Much Money Do I Realistically Need to Start Trading Stocks?
You can technically open a brokerage account with just a few hundred dollars, but I'd strongly advise against it. Trading with an account that small is a strategic dead end. It forces you to take huge risks relative to your account size just to make a meaningful profit, which is a fast track to blowing up.
A much more practical starting point is somewhere between $5,000 to $10,000.
Why that amount? An account of this size is large enough to:
- Properly use the 1% risk rule without being stuck in penny-stock territory.
- Survive a string of small, inevitable losses without taking a major psychological or financial hit.
- Give you the flexibility to trade a decent range of stocks, not just the cheap, hyper-volatile ones.
Starting with too little capital puts you on the defensive from day one. Your first goal should be to learn the process and build good habits, not desperately try to spin $500 into a fortune.
Can I Really Make a Living from Trading?
Yes, you absolutely can make a living from trading. But—and this is a big but—you have to be brutally realistic about what it takes. This is not a get-rich-quick game. Not even close.
It takes time, often years, to build the skills, the cast-iron discipline, and the emotional control needed to be consistently profitable.
A lot of professional traders aren't trying to hit home runs. Their goal is to generate a steady, repeatable income by executing their strategy flawlessly, day in and day out. Think of it like running any other serious business.
Real success isn't measured by one massive winning trade or a great month. It's measured by your ability to produce positive returns year after year while managing your risk like a hawk.
What Is the Best Time of Day to Trade?
For day traders, the action is almost always hottest during two specific windows: the first 90 minutes after the market opens (9:30 AM to 11:00 AM EST) and the final hour before it closes (3:00 PM to 4:00 PM EST).
These are the times when volume and volatility spike, creating the cleanest opportunities.
- The Opening Bell: This is when the market is reacting to all the overnight news, often leading to powerful, decisive moves right out of the gate.
- The Closing Hour: This is "power hour." Big institutions are often busy adjusting their massive positions before the market closes, which can kick off some significant late-day trends.
The middle of the day, roughly from noon to 2:30 PM EST, is what traders call the "lunchtime lull." Volume often dries up, and the price action can get choppy and unpredictable. It's a great time to take a break.
Of course, if you're a swing trader holding positions for days or weeks, the exact time of entry is far less important than making sure your setup on the daily chart is solid.
At Colibri Trader, we cut through the noise and focus on what actually works: pure price-action and disciplined risk management. Our education is designed to give you the no-nonsense tools you need to build lasting success in the markets. Ready to see what you're capable of? Visit us at https://www.colibritrader.com.