


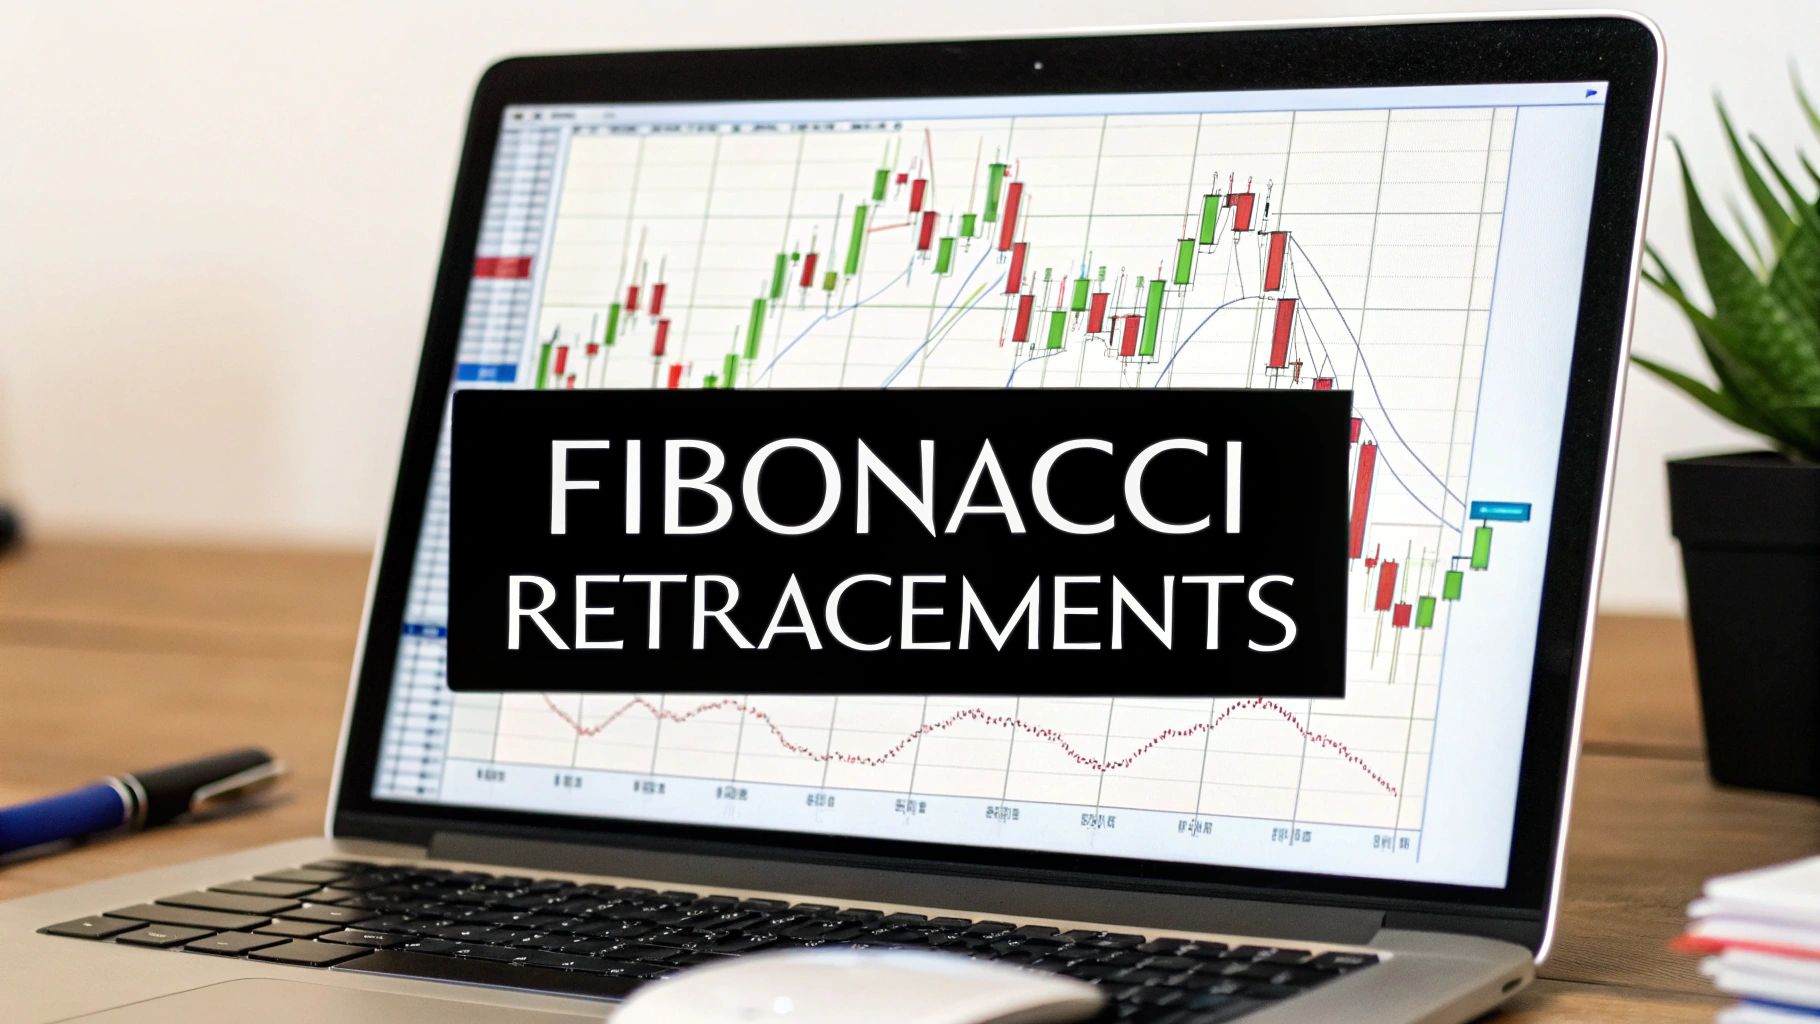
How to Draw Fib Retracements: Complete Trading Guide
Understanding Why Fibonacci Retracements Actually Work
Drawing Fibonacci retracements is a crucial skill for any trader. However, understanding why they work is just as important. These retracements aren't some magical tool; their effectiveness comes from the shared psychology of the market. Thousands of traders around the world watch these specific Fibonacci levels and react to them, creating a self-fulfilling prophecy.
This predictable behavior turns these mathematical ratios into reliable indicators of potential support and resistance levels. Think of it as a collective market expectation influencing price action.
For example, imagine a stock enjoying a strong uptrend. As the price climbs, many traders will look to secure their profits. Waiting for a pullback, or retracement, is a common strategy before re-entering the market or opening new positions. This creates demand at certain price levels, especially those that align with Fibonacci ratios.
The Fibonacci retracement tool has become a cornerstone of technical analysis in various markets. Its key levels – 23.6%, 38.2%, 50%, 61.8%, and 78.6% – come from mathematical ratios found in the Fibonacci sequence. Each level is calculated by measuring the vertical distance between a significant high and low on a price chart and then applying these percentages. Learn more about Fibonacci retracement here. Its widespread use reinforces the predictive power of these levels.
The Golden Ratio and Market Psychology
The 61.8% retracement, often called the "golden ratio," holds special importance. This ratio appears throughout nature and has intrigued mathematicians and artists for centuries. In trading, it often acts as a strong pull for price action. Many traders see it as a major turning point, which increases the likelihood of a bounce or reversal at this level.
It's important to remember, though, that Fibonacci retracements aren't foolproof. They represent probabilities, not guaranteed outcomes. Understanding the market psychology behind them is crucial for enhancing their effectiveness. By combining Fibonacci levels with other technical indicators, like those found in platforms like TradingView, and considering the overall market context, you can improve your trading decisions. This broader approach to analysis is a key to successful trading using Fibonacci retracements.
Your Step-By-Step Drawing Guide That Actually Works
Drawing Fibonacci retracements accurately is essential for effective trading. It’s a precise process that begins with identifying the correct swing highs and lows on your chosen trading platform, like Colibri Trader. These swing points represent significant shifts in price action. This guide outlines the steps used by professional traders, from spotting those crucial pivot points to flawlessly executing the drawing process.
Identifying Swing Highs and Lows
First, identify the swing high and swing low of a recent price movement. A swing high is a candlestick with lower highs on both sides, marking a peak in price. A swing low is a candlestick with higher lows on both sides, representing a price trough. These points are your starting and ending points for drawing the retracement.
Plotting Your Retracements
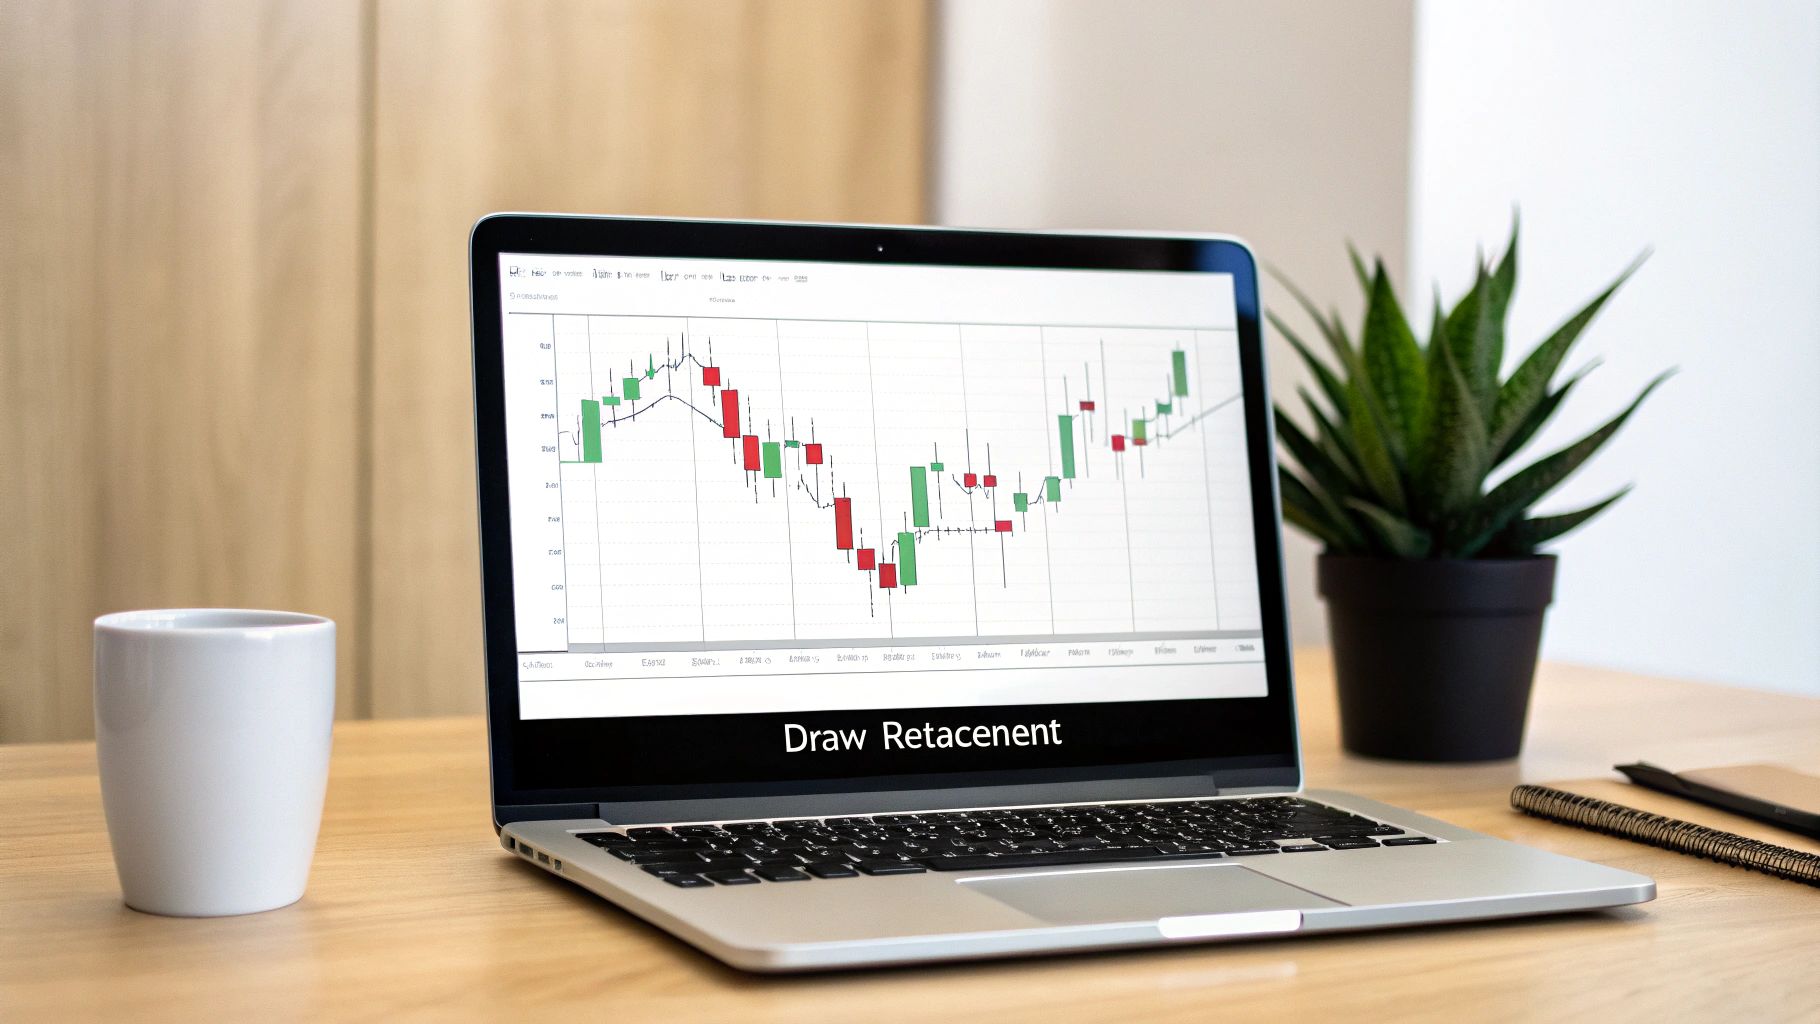
After locating the swing points, your trading platform's Fibonacci tool comes into play. Most platforms, such as TradingView, offer a dedicated tool. Select the tool and click on the swing high, then drag your cursor to the swing low (or vice versa, depending on the platform). This automatically generates the Fibonacci levels.
The infographic below visually demonstrates how swing points are identified and used to draw Fibonacci retracements on a candlestick chart.
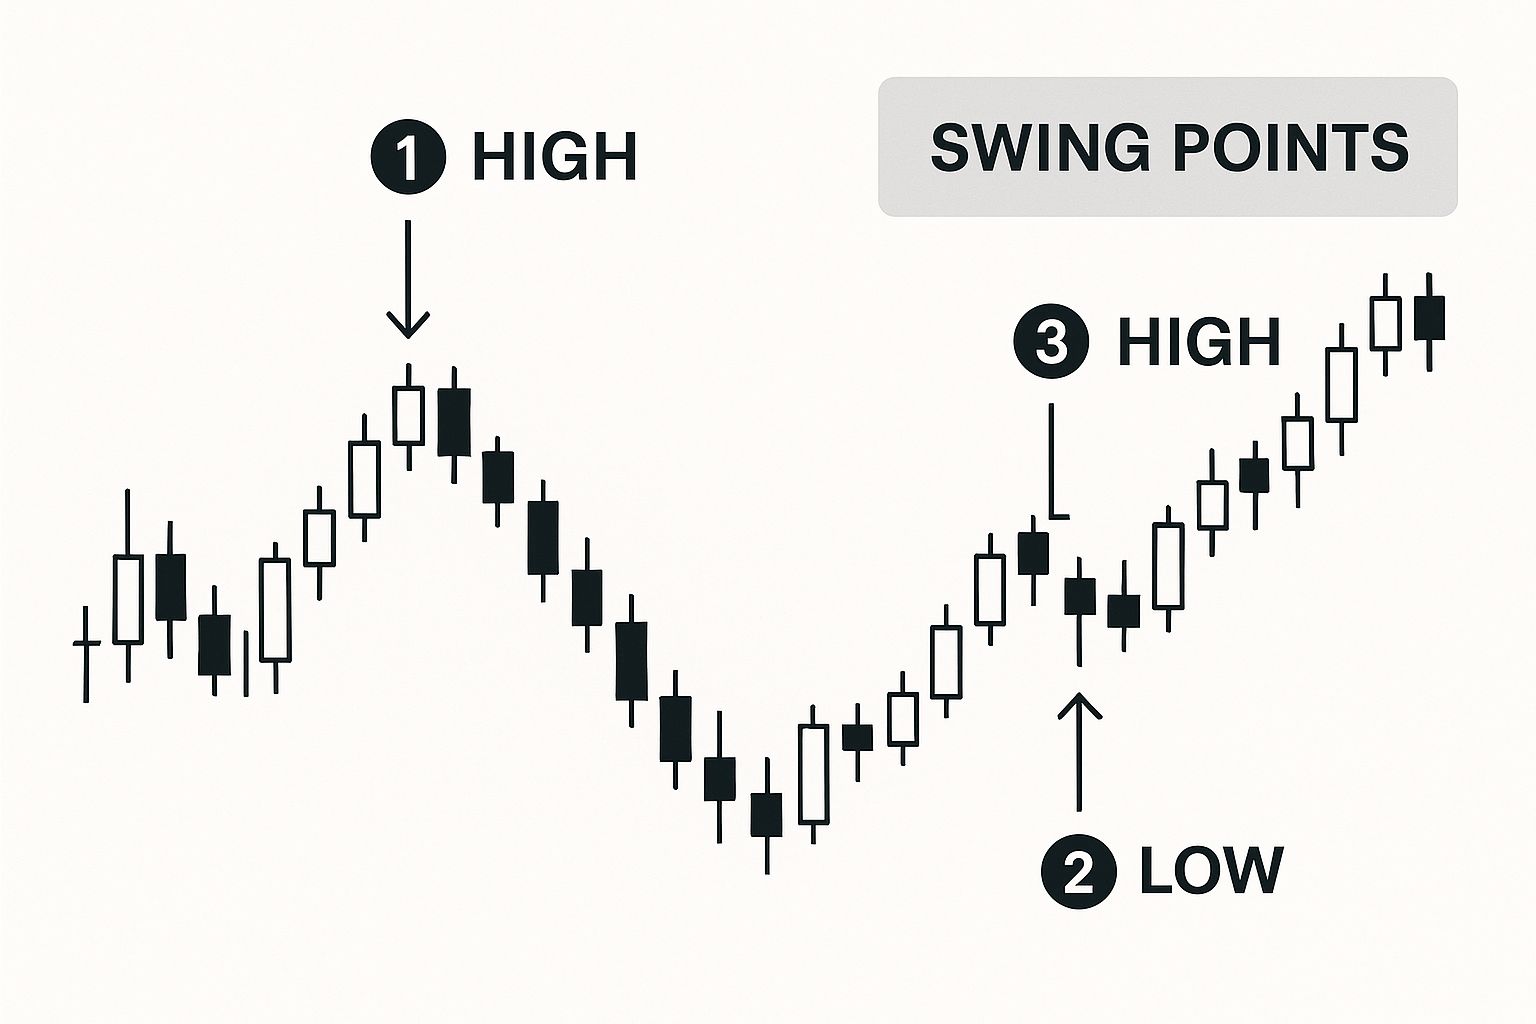
As shown, key Fibonacci retracement levels (23.6%, 38.2%, 50%, 61.8%, and 78.6%) are automatically plotted between the swing high and swing low. These levels then act as potential support and resistance zones.
To further clarify the drawing process across various platforms, let's examine a comparison table:
To further clarify the drawing process across various platforms, let's examine a comparison table:
Platform-Specific Drawing Instructions
| Trading Platform | Tool Location | Drawing Steps | Keyboard Shortcuts |
|---|---|---|---|
| TradingView | Charting Tools panel (usually on the left) | 1. Select the "Fibonacci Retracement" tool. 2. Click on the swing high. 3. Drag to the swing low. | Alt + F |
| MetaTrader 4/5 | Insert Menu > Fibonacci > Retracement | 1. Select the "Fibonacci Retracement" tool. 2. Click on the swing high. 3. Drag to the swing low. | None Default |
| cTrader | Chart right-click menu > Fibonacci tools | 1. Click on the swing high. 2. Drag and drop to the swing low, release mouse to apply retracement | Ctrl+D |
This table highlights the different locations and steps involved in drawing Fibonacci retracements on popular platforms like TradingView, MetaTrader, and cTrader. While the core concept remains the same, familiarizing yourself with your specific platform's tools will streamline your analysis.
Key Fibonacci Levels and Their Significance
After drawing the retracements, horizontal lines representing the key Fibonacci levels appear. These levels aren't arbitrary; they indicate potential price reversal or consolidation areas. The 61.8% retracement, often called the "golden ratio," is especially significant.
Adapting to Changing Market Conditions
Price action doesn't always perfectly adhere to Fibonacci levels. Sometimes, it overshoots or undershoots. This is where understanding market context and using other technical indicators becomes crucial. For instance, a price bouncing off the 38.2% level might later break through it and continue to the 50% level. This highlights why redrawing Fibonacci retracements might be necessary as the market evolves to ensure accurate analysis.
Decoding Which Fibonacci Levels Really Matter
Now that you understand how to draw Fibonacci retracements, the next question is which levels are the most significant. While every Fibonacci level offers potential support and resistance, they don’t all carry the same weight. Prioritizing the right levels can significantly improve your trading accuracy.
The Significance of the 50% Level
The 50% retracement level holds psychological importance. As the halfway point of a price move, it's a natural area for traders to pause and evaluate market sentiment. This level frequently becomes a battleground between buyers and sellers. A decisive break above or below can signal a trend continuation. For a deeper dive into this concept, check out this helpful guide on Fibonacci levels in technical analysis.
The Golden Ratio (61.8%) and Its Power
The 61.8% retracement, derived from the golden ratio, often holds more weight. This level tends to act as a stronger support or resistance zone. This is because its significance is widely recognized, leading many traders to place orders around it, creating a self-fulfilling prophecy. Bounces or reversals at this level are considered stronger signals.
Other Key Levels and Confluence Trading
The 23.6% and 38.2% levels are generally weaker, often representing shallower retracements before the primary trend resumes. While these can provide opportunities for scalping or shorter-term trades, they're not as reliable. The 78.6% level is a critical point; breaking beyond this often signals a potential trend reversal. Observing price action at these levels can give valuable clues about market sentiment.
Combining Fibonacci levels creates confluence, strengthening potential support or resistance zones. For example, the 61.8% retracement aligning with a previous swing high or low reinforces the possibility of a reversal. This principle extends to combining Fibonacci levels across different timeframes.
The Role of Market Context and Statistical Evidence
Fibonacci levels are not standalone indicators. They are most effective when used with other technical indicators and a solid understanding of market conditions. Studies, including those from the Indian stock market, often reveal their reliability as support and resistance zones.
Research shows that approximately 70% of the time, stocks retrace to at least one key Fibonacci level (23.6%, 38.2%, 50%, or 61.8%) before continuing or reversing. The 61.8% level is particularly noteworthy. Explore this topic further. Just as a doctor uses multiple factors for a diagnosis, traders shouldn't rely solely on Fibonacci retracements. This emphasizes the importance of a comprehensive approach. By understanding the importance of each level, how they interact, and how to combine them with other tools, you can use Fibonacci retracements to identify high-probability trading setups.
Mistakes That Kill Your Fibonacci Trading (And How to Avoid Them)
Even experienced traders can stumble when using Fibonacci retracements. These missteps can diminish the effectiveness of this valuable tool, potentially leading to losses. Let's explore common errors and how to steer clear of them.
The Danger of Confirmation Bias
One major mistake is forcing Fibonacci levels to fit preconceived notions. This occurs when traders are so sure of a market's direction that they manipulate their retracements. They might cherry-pick swing points or ignore levels that contradict their biases. Objectivity is paramount; let the price action guide you, not your emotions.
Analysis Paralysis: Too Many Retracements
Overcrowding your chart with retracements can lead to analysis paralysis. A jumble of overlapping lines from different swing points creates confusion. This makes identifying real support and resistance zones difficult. Focus on the most recent and significant swing points. Simplicity often yields better Fibonacci analysis. You might be interested in: How to master recognizing common trading mistakes.
The Importance of Accurate Swing Point Selection
Incorrect swing point selection is another common error. Using small price fluctuations instead of substantial swing highs and lows will create inaccurate Fibonacci levels. This will lead to false signals. Mastering the identification of significant turning points in price action is crucial for drawing effective Fibonacci retracements.
Letting Price Action Confirm Your Levels
Blind faith in Fibonacci levels without confirmation from price action is dangerous. These levels suggest potential support and resistance, but they aren't guarantees. Look for other signals, such as candlestick patterns or volume changes, before acting on Fibonacci levels. Consider using other technical indicators like those found within TradingView for additional confirmation.
Timing Errors: Drawing Too Early
Drawing retracements prematurely is another potential pitfall. If the trend hasn't fully formed, your swing points might be premature. This results in inaccurate levels. Wait for clear swing high or low confirmation before drawing Fibonacci retracements.
Ignoring Changes in Market Structure
Market conditions are not static. A breakout beyond a key Fibonacci level, or a change in market sentiment, can invalidate your analysis. Regularly reassess your retracements and adjust them as necessary. By avoiding these common pitfalls and focusing on objective analysis, you can truly leverage the power of Fibonacci retracements in your trading strategy.
Advanced Strategies for Serious Fibonacci Traders

Learning how to draw Fibonacci retracements is essential for any trader. However, truly successful traders go beyond the basics. They develop advanced strategies to fully utilize this powerful tool, moving past simple identification of individual retracement levels.
Confluence Trading: The Power of Alignment
One of the most effective advanced strategies is confluence trading. This technique involves finding areas where multiple Fibonacci levels overlap. These overlaps can occur between different swing points on the same timeframe, or across multiple timeframes.
Imagine the 61.8% retracement level lining up with a major horizontal support level. Or perhaps the 50% retracement on a daily chart converges with the 38.2% retracement on the weekly chart. This convergence of levels creates a much stronger support or resistance zone than a single level alone. These zones often signal high-probability trading setups with favorable risk-reward ratios.
Combining Retracements and Extensions
Experienced traders frequently combine Fibonacci retracements with Fibonacci extensions. Retracements help pinpoint potential support and resistance within a price swing. Extensions, on the other hand, project potential price targets beyond the initial swing.
Used together, they offer a comprehensive view of both potential reversal points and profit-taking zones. For example, after a bullish move, a trader might enter a long position at the 50% retracement and aim for the 161.8% or 261.8% extension levels to take profits.
Mastering Fibonacci Clusters
Fibonacci clusters happen when many Fibonacci levels, often from different swing highs and lows, converge within a narrow price range. This clustering significantly increases the importance of that price zone, indicating a key area of potential support or resistance. Trading around these clusters can substantially improve trading accuracy. Understanding mistakes can greatly help traders. For more information about common errors, visit this resource on SEO mistakes.
Adapting to Market Conditions
It's important to remember that Fibonacci levels are not fixed. Market conditions, trends, and volatility all change. Therefore, traders need to adapt their Fibonacci analysis accordingly.
For instance, wider retracements may be more frequent during periods of high volatility, while shallower retracements may be more common in calmer markets. You can learn more about adapting Fibonacci strategies in our article on How to master advanced Fibonacci strategies. Adjusting your analysis to match current market conditions keeps your Fibonacci strategies effective. These advanced techniques, combined with a solid understanding of market dynamics, will help you identify high-probability setups and improve your trading performance.
Real Market Examples: Fibonacci in Action
Understanding how to draw Fibonacci retracements is one thing; seeing them in action is another. Let's explore real-world examples across various markets to illustrate how these levels play out in live trading scenarios.
Stock Market Example: Apple (AAPL)
During a 2023 market correction, Apple's stock (AAPL) experienced a significant decline. After identifying a clear swing high and low, drawing the Fibonacci retracements revealed that the 38.2% level acted as strong support. This led to a temporary price bounce.
This illustrates how Fibonacci levels can anticipate potential support and resistance zones, even in volatile markets.
Forex Market Example: EUR/USD
In the forex market, the EUR/USD pair often demonstrates clear reactions to Fibonacci levels. During a trending period, the 61.8% retracement level frequently halted price declines. This provided attractive entry points for long positions.
This highlights the golden ratio's importance in currency trading.
Cryptocurrency Example: Bitcoin (BTC)
The volatile cryptocurrency market also exhibits adherence to Fibonacci levels. In Bitcoin's 2022 bear market, after a substantial drop, the price found support at the 78.6% retracement level. This prevented further decline.
This underscores how even in extreme market conditions, these levels can influence price action. Considering integrating affiliate marketing can help expand your reach with Fibonacci trading. Explore resources like SaaS affiliate program opportunities to broaden your network.
Analyzing Successes and Failures
It's crucial to examine both successful and unsuccessful Fibonacci setups. Not every touch of a Fibonacci level results in a perfect reversal. Sometimes a price might briefly touch the 50% level before breaking through.
Recognizing these nuances is essential for developing realistic expectations and avoiding rigid adherence to the levels.
Learning from Messy Reality
Textbook examples often show perfect bounces. Real markets are messier. Price action may hover around a level, creating whipsaws before a decisive move.
By analyzing real examples, you will learn to recognize these variations. You'll also learn to interpret price behavior around key levels more effectively.
Developing Realistic Expectations
Fibonacci retracements are not a crystal ball. They don't predict the future, but they do highlight potential turning points. By studying real market movements, you’ll understand how to use Fibonacci levels with other technical indicators. This helps to create a complete trading plan.
These real-world examples will hone your ability to recognize practical applications of Fibonacci retracements. They will also improve your trading approach.
To further illustrate the potential of Fibonacci retracements, let's examine some statistical data:
The following table showcases the effectiveness of Fibonacci retracement levels across different markets and timeframes. It highlights the success rate, the most effective retracement level, and the sample size used for the analysis.
Fibonacci Success Rate by Market and Timeframe: Statistical breakdown of Fibonacci retracement effectiveness across different markets and timeframes
| Market Type | Timeframe | Success Rate (%) | Most Effective Level | Sample Size |
|---|---|---|---|---|
| Stocks | Daily | 65 | 38.2% | 500 |
| Forex | 4-Hour | 62 | 61.8% | 1000 |
| Cryptocurrency | Daily | 58 | 78.6% | 750 |
This table provides a statistical overview of how Fibonacci retracements perform in various trading environments. As shown, while not foolproof, they offer a valuable tool for identifying potential support and resistance levels. Remember that these are statistical averages, and individual trade outcomes can vary. Combining Fibonacci analysis with other technical indicators and risk management strategies is key for successful trading.
Building Fibonacci Into Your Trading System
Building a robust trading system around Fibonacci retracements involves more than just drawing lines on a chart. It requires thoughtful integration into a structured approach, ensuring these levels enhance, rather than hinder, your trading decisions.
Establishing Clear Rules and Criteria
First, define specific rules for using Fibonacci levels. Will the 61.8% retracement be your primary entry point, or will you focus on the 38.2% level? Establish clear criteria for when these signals are sufficient on their own and when you need further validation. This might involve looking for candlestick patterns, analyzing volume changes, or checking for convergence with other technical indicators like moving averages.
Also, establish concrete entry and exit rules tied to Fibonacci levels. Will you enter a long position immediately upon price touching a retracement level, or will you wait for a confirming candlestick pattern? Where will you place your stop-loss – below the previous swing low or just beneath the Fibonacci level itself?
Risk Management Strategies
Next, incorporate Fibonacci levels into your risk management strategy. These natural support and resistance areas are valuable tools for defining stop-loss orders and profit targets. Placing your stop-loss just below a key Fibonacci support level can help minimize potential losses. Fibonacci extensions, on the other hand, can inform profit-taking decisions, providing clear exit points based on potential resistance zones.
Tracking and Measuring Performance
Tracking performance is crucial for any trading system. Keep a detailed trading journal of your Fibonacci-based trades. Record entry and exit points, stop-loss and take-profit levels, and the overall outcome of each trade. This data will provide insights into the effectiveness of your strategy and highlight any areas needing improvement.
Continuous Refinement
Finally, remember that trading systems require ongoing refinement. Analyze your trading journal for patterns and recurring outcomes. Do specific Fibonacci setups outperform others? Does combining Fibonacci analysis with certain indicators enhance your accuracy? Regular assessment and adaptation are key to ensuring your Fibonacci-based trading strategy remains sharp and profitable. This systematic approach allows you to harness the power of Fibonacci retracements while maintaining discipline and structure in your trading.
Ready to explore a price-action-based trading approach? Take the free Trading Potential Quiz and discover your potential with Colibri Trader!