


How to Draw a Fibonacci Retracement A Practical Guide for Traders
To really get the hang of drawing Fibonacci retracements, you first need a clear, obvious price move to work with. Think of a strong, committed trend.
In an uptrend, you’ll connect the tool from the very start of the move (a swing low) to the absolute peak of that move (a swing high). Doing this projects a series of potential support levels onto your chart—these are the zones where the price might take a breather before hopefully continuing its climb.
Laying the Groundwork: What Is Fibonacci Retracement?
Before you even think about clicking the Fibonacci tool on your trading platform, you have to get the "why" behind it. Fibonacci retracement isn't some crystal ball for predicting the future with perfect accuracy. It's a method for spotting high-probability zones where a pullback in the market might run out of steam and reverse.
Think of it as creating a roadmap for a trend's natural ebb and flow.
This tool is built on a sequence of numbers discovered way back when by Leonardo Fibonacci, which gives us some key ratios. In trading, these ratios create invisible lines of potential support or resistance. They tap into the psychological rhythm of the market as traders decide to cash in profits or hunt for new entry points.
The Core Ratios Every Trader Watches
The real power of this tool comes from its popularity. Since so many traders—from guys like us at home to massive institutions—are all watching the exact same levels, these zones can become self-fulfilling prophecies.
You'll see a few primary ratios pop up on your chart:
- 23.6%: This is a shallow pullback. If the price only pulls back this far, it often signals a very powerful, aggressive trend.
- 38.2%: A very common and significant retracement level that traders watch closely.
- 50.0%: This one isn't technically a Fibonacci number, but it marks the halfway point of the move. It's a huge psychological level.
- 61.8%: Often called the "golden ratio." Many traders consider this the most important level of them all for a potential trend continuation.
The whole process starts by finding a clean swing high and swing low. You apply the tool to that price range, and it maps out these probable support and resistance zones. For a lot of traders I know, that 61.8% level is the line in the sand—the make-or-break point for a trend to continue. If you want to dive deeper, there's a good breakdown of the Fibonacci retracement strategy on atfx.com.
To help organize these key levels, here's a quick reference table showing how they're typically interpreted in both uptrends and downtrends.
Key Fibonacci Retracement Levels and Their Significance
This table breaks down the main Fibonacci ratios and what they often signal to traders during a market pullback.
| Fibonacci Level | Significance in an Uptrend | Significance in a Downtrend |
|---|---|---|
| 23.6% | A shallow retracement indicating strong buying pressure. Trend is very bullish. | A shallow bounce indicating strong selling pressure. Trend is very bearish. |
| 38.2% | A moderate and common pullback level, often seen as a healthy correction. | A moderate bounce, considered a standard correction in a strong downtrend. |
| 50.0% | A key psychological halfway point; a significant area of potential support. | The halfway point of the move; a critical area of potential resistance. |
| 61.8% | The "golden ratio." A deep pullback and a prime area for buyers to step in. | A deep bounce providing a key opportunity for sellers to re-enter. |
| 78.6% | A very deep retracement, often the last line of defense before a trend reversal. | A very deep bounce; if this level breaks, the trend may be reversing. |
Remember, these levels aren't magic. They work best when combined with other forms of analysis, like price action patterns or supply and demand zones, which we'll get into later.
By understanding what these lines represent, you move from just drawing lines on a chart to actually interpreting market behavior. Each level tells a piece of the story about the trend's strength and the battle between buyers and sellers.
How to Draw Fibonacci Levels on Your Charts
Alright, enough theory. Let's get our hands dirty and put this tool to work on the charts.
The actual mechanics of drawing Fibonacci retracements are pretty simple. The core idea is this: you're measuring a big, primary trend move to find potential spots where a pullback against that trend might run out of steam and turn back around.
Your first and most critical job is to correctly identify a swing high and a swing low. These aren't just minor wiggles; they are the significant turning points that mark the clear beginning and end of an impulsive price move. If you anchor your tool to simple market noise, you'll get garbage levels.
Drawing Retracements in an Uptrend
When a market is in a clear uptrend, you'll see a classic series of higher highs and higher lows. Your mission is to measure a completed upward leg to find a good spot to buy the inevitable dip.
To do this, you draw the Fibonacci tool from the very start of that upward move (the swing low) up to the very end of it (the swing high).
- Anchor Point 1 (100% or 1): Click on the absolute bottom of the price swing. I'm talking about the lowest point, which is usually the wick of the lowest candle in that entire move.
- Anchor Point 2 (0% or 0): Then, drag your cursor up and click on the absolute peak of that same price swing—again, often the wick of the highest candle.
Once you connect those two points, your trading software will automatically lay out the key Fibonacci retracement levels (23.6%, 38.2%, 50%, 61.8%) on your chart. Think of these horizontal lines as potential support zones where buyers might be waiting to jump in.
A very common rookie mistake is drawing from high to low when the market is going up. Burn this into your memory: in an uptrend, you always draw from low to high to find pullback support.
This flow chart breaks down the simple three-part process for drawing the tool in an uptrend. It all starts with identifying the trend, then zeroing in on the right swing points, and finally, plotting the levels.
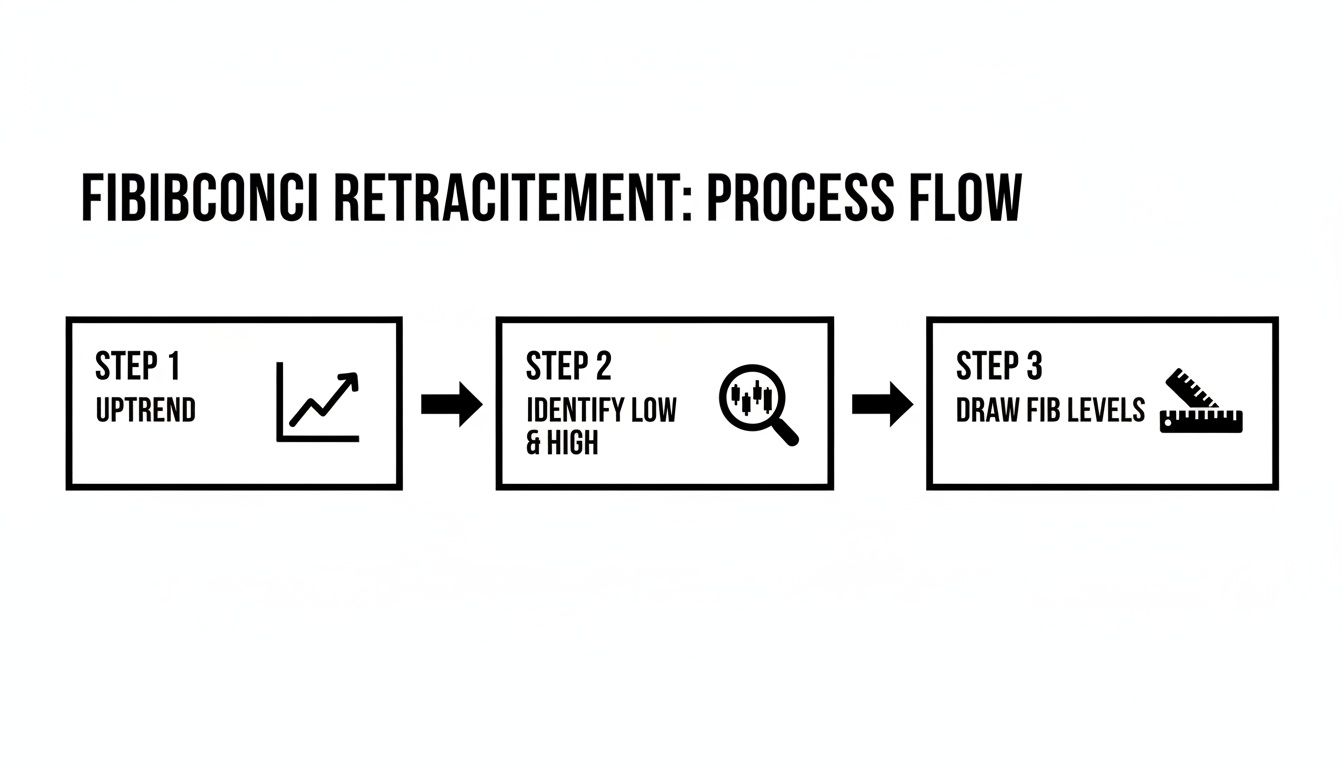
As you can see, the process is logical: see the trend, find the swing points, and then draw the tool. Simple as that.
Drawing Retracements in a Downtrend
For a downtrend, you just flip the logic on its head. The market is carving out lower lows and lower highs, so you're on the hunt for a potential spot to short-sell when the price makes a temporary bounce higher.
This time, you'll draw the tool from the swing high down to the swing low.
- Anchor Point 1 (100% or 1): Select the absolute peak where the downward move kicked off.
- Anchor Point 2 (0% or 0): Drag your tool down and click on the absolute bottom of that same move.
Now, the Fibonacci levels that appear are potential resistance zones. As the price retraces upward, you'll be watching these lines like a hawk for any sign that sellers are stepping back in to push the price down again, continuing the primary downtrend.
Getting this right is a lot like learning how to draw trend lines. Both skills depend on your ability to consistently and accurately identify the most important turning points on a chart. It's this consistency in picking your swing points that will build your confidence and give you much more reliable results over time.
Unlock Stronger Signals with Confluence Trading
Drawing a Fibonacci retracement on a clean price swing gives you a solid map of potential reversal zones. That's a great start. But relying on those levels alone is like trying to navigate a city with only one landmark. It’s doable, but you’re missing a lot of context.
The real magic happens when you start layering other forms of analysis on top. We call this confluence trading.

It’s all about finding spots on the chart where multiple, independent signals all point to the same conclusion. When a key Fibonacci level lines up perfectly with another technical factor, your confidence in that trade setup should go way up.
Combining Fibonacci with Support and Resistance
One of the most powerful combinations out there is pairing Fibonacci levels with classic support and resistance zones. These are just horizontal price areas where the market has clearly struggled to break through or has bounced from in the past.
Imagine a stock in a strong uptrend pulls back to the 61.8% "golden ratio" retracement level. By itself, that’s an interesting signal.
But what if that exact same price level was also a major support zone that held firm three times last month?
Now you have two distinct reasons for buyers to step in at that price:
- Fibonacci traders see a key mathematical retracement.
- Price action traders see a historically significant support area.
This overlap creates a high-probability zone where the odds of a bounce are much, much greater. You can dive deeper into identifying these powerful zones in our guide on confluence areas in forex trading.
Stacking Probabilities with Moving Averages
Another classic confluence strategy is to watch key moving averages, like the 50-day or 200-day Simple Moving Average (SMA). These are some of the most widely followed indicators in the world, and they often act as dynamic, or moving, support or resistance.
A pullback that finds buyers at the 38.2% Fibonacci level is notable. But if the 50 SMA is also rising to meet the price at that exact same 38.2% level, you have a much stronger case for a long entry.
The market is telling you, in two different "languages," that this is a critical inflection point.
Pro Tip: Don't just look for one point of confluence. The best trade setups often have three or more factors aligning. For instance, a 50% retracement level that intersects with a 200 SMA and a previous support level is an A+ setup that I'm always paying close attention to.
The Power of Candlestick Confirmation
Finally, and this is crucial, always wait for price action to confirm your thesis. A Fibonacci level is just a potential zone; a candlestick pattern tells you that buyers or sellers are actively stepping in right now.
Let’s say the price of a currency pair pulls back to the 50% retracement level during an uptrend. You're watching to see if it holds. Suddenly, a powerful bullish engulfing or hammer candlestick forms right on that level.
This is your green light. The candle tells you the buyers have rejected lower prices and are taking control, confirming the validity of the Fibonacci level.
Because thousands of traders and algorithmic systems are all watching the same Fibonacci lines, these levels can become self-fulfilling prophecies. This creates a measurable clustering of orders around the same prices, which is why it's so powerful to plot them on higher timeframes like the daily or weekly charts. It helps you cut through the noise and see the bigger picture more clearly.
Common Mistakes That Invalidate Your Fibonacci Analysis
Even the sharpest traders can fall into simple traps that completely undermine their Fibonacci analysis. I've seen it happen time and time again. Mastering how to draw a Fibonacci retracement isn't just about learning the right clicks; it's about side-stepping the common errors that churn out bad signals and lead to frustrating losses.

Unfortunately, many traders sabotage their own efforts right from the get-go by making one of these critical mistakes. Just knowing what they are is the first step toward building a much more objective—and profitable—trading process.
Selecting Insignificant Swing Points
This is easily the most frequent error I see: drawing the tool on minor, insignificant price wiggles. A true swing point represents a meaningful shift in market momentum, not just the random noise you see flickering on the 1-minute chart.
When you anchor your Fib tool to these tiny movements, the resulting levels are essentially meaningless. They don't represent areas where a significant number of traders will be looking to act, which makes them highly unreliable for finding real support or resistance. Your goal is to measure the primary, impulsive move, not the small corrections inside of it.
Applying the Tool Backward
This one is a classic rookie mistake, but you’d be surprised how often it happens. It’s simple: in an uptrend, you must draw the tool from the swing low up to the swing high. In a downtrend, you draw it from the swing high down to the swing low.
Getting this backward completely inverts the logic. Drawing from high to low in an uptrend will project resistance levels above the current price, which is totally useless for finding a pullback entry. It's a simple mechanical error that invalidates your entire analysis before you even begin.
A key principle to remember is that you are measuring a completed move to anticipate the depth of its correction. The direction you draw the tool must always follow the direction of that initial impulse.
Forcing the Levels to Fit a Bias
Confirmation bias is a trader's worst enemy, period. This is what happens when you have a preconceived idea of where you want the market to go, so you subconsciously fudge your swing points to make the Fibonacci levels fit that narrative.
Maybe you ignore a slightly higher swing high in favor of one that puts the 61.8% level exactly where you want to buy. That's not analysis; it's wishful thinking. Good trading requires you to be an impartial observer of what the market is doing, not what you hope it will do.
To keep yourself honest and avoid these traps, try to make this your process:
- Focus on Major Swings: Always start your analysis on a higher timeframe (like the 4-hour or daily) to identify the most significant, obvious swing highs and lows.
- Be Consistent: Develop a clear, repeatable process for how you select your anchor points. And stick to it. Every. Single. Time.
- Challenge Your Assumptions: Actively ask yourself: "Am I drawing these levels to reflect reality, or am I just trying to confirm a trade idea I'm already emotionally attached to?"
By consciously avoiding these mistakes, you ensure your Fibonacci analysis is grounded in objective price action. That alone will give you a much more reliable foundation for your trading decisions.
How to Backtest Your Fibonacci Trading Strategy
Knowing how to draw clean Fibonacci levels is a fantastic start, but let's be honest—it's only half the battle. To turn those lines on your chart into an actual, profitable system, you have to move beyond theory and get your hands dirty with data.
This is where backtesting comes in. It's the only way to know for sure if your strategy has a real statistical edge.
Think of it as your personal quality control department. Backtesting is the process of taking your specific trading rules and applying them to historical price data to see how they would have performed. Without this crucial step, you’re just trading on hope. You're guessing. Proper testing removes emotion and guesswork, replacing them with cold, hard facts.
The whole process hinges on having a specific, repeatable set of rules. For instance, a rule could be: "In a clear uptrend, I will buy at the 50% retracement level. My stop-loss goes just below the 61.8% level, and my profit target is the previous swing high." That's the kind of clarity you need.
Defining Your Testing Parameters
To get reliable data, you can't just wing it. You need to be systematic.
First, decide on the exact market and timeframe you're going to test. A strategy that crushes it on the EUR/USD daily chart might fall apart completely on a 15-minute chart for Tesla. Be specific.
Next, you need a decent sample size. Testing your rules on just 10 or 20 setups won't cut it—that’s not statistically relevant. You need to aim for at least 100 trades to get a true picture of how your strategy behaves. A larger data set smooths out the flukes and gives you real confidence.
Finally, you need to meticulously record the outcome of every single trade that meets your criteria. Keep it simple and track the essential metrics:
- Win Rate: What percentage of your trades were winners?
- Risk-to-Reward Ratio: How did your average winner compare to your average loser?
- Maximum Drawdown: What was the biggest drop from a peak in your hypothetical account balance?
These numbers will tell you the real story.
Analyzing the Data for a Real Edge
Once you've gathered all your data, it's time to analyze the results. And here's a key point: don't get hung up on a low win rate if your risk-to-reward ratio is strong.
A strategy that only wins 40% of the time can be incredibly profitable if your average winning trade is three times larger than your average losing trade. That's a positive expectancy, and it's what professional trading is all about.
For a more detailed walkthrough, our complete guide on how to backtest a trading strategy covers this in much greater depth.
The ultimate goal of backtesting is to build unwavering confidence in your system. When you know, based on data, that your strategy has a positive expectancy over 100+ trades, it becomes infinitely easier to pull the trigger without hesitation in live market conditions.
Some interesting research has even shown that Fibonacci-based strategies can outperform simple buy-and-hold approaches in certain markets, like energy stocks and crypto. This suggests these levels aren't just random lines on a chart—they can create a measurable edge. This data-driven validation is what separates disciplined traders from gamblers.
Common Questions About Fibonacci Retracement
As you start to get the hang of drawing Fibonacci retracements, a few practical questions are bound to pop up. This is totally normal. Nailing down the answers to these common sticking points is the key to using the tool with confidence and consistency.
Let's walk through the questions I hear most often from other traders.
Which Timeframe Is Best for Drawing Fibonacci Retracements?
There's no single "best" timeframe here—it really boils down to your personal trading style and what you're trying to accomplish.
If you're a long-term investor or a swing trader, you'll find the most reliable signals on the daily or weekly charts. Why? Because these higher timeframes capture the major, significant trends. They do a great job of filtering out the distracting day-to-day market noise, which gives you much stronger and more meaningful support and resistance levels.
Day traders, on the other hand, will likely be working on 15-minute or hourly charts. This is perfectly fine, but you have to be a bit more careful. Lower timeframes are naturally noisier. This means the swing points you pick might be less significant, leading to levels that don't hold up as well.
A professional approach that I've found works incredibly well is top-down analysis. Start by identifying the main trend and key Fibonacci levels on a higher timeframe (like the daily). Then, zoom into a lower timeframe (like the 4-hour) to pinpoint your entry and exit points within that larger market structure.
Using this method helps ensure you're always trading with the dominant market momentum, not against it.
What Is the Difference Between Fibonacci Retracement and Extension?
While both tools come from the same famous mathematical sequence, they serve opposite—but very complementary—functions in your trading.
-
Fibonacci Retracement: This tool is all about identifying potential stopping points for a pullback within a larger, established trend. It answers the question, "If the price pulls back, where might it find support or resistance before continuing its original journey?" Think of it as your go-to tool for finding high-probability entry zones.
-
Fibonacci Extension: This one is for projecting potential price targets beyond the recent swing high or low. It answers the question, "If the trend keeps going, where might the price head next?" This makes it the perfect tool for setting logical profit targets.
Simply put: Retracements help you get into a trade, and Extensions help you get out.
Do Fibonacci Retracements Work in All Markets?
Yes, they do. Fibonacci retracements are a remarkably versatile tool that you can apply to just about any liquid market. This includes stocks, forex, commodities, and even cryptocurrencies.
The reason they work so universally is that the tool isn't based on the asset itself. It's based on the collective market psychology—the human behavior—that drives the price action. The patterns of hope, fear, and profit-taking are the same everywhere, and Fibonacci levels are just a great way to map these behavioral rhythms.
But there's one critical condition for them to work effectively: the market must be trending.
If a market is just chopping around sideways in a tight range, there are no clear, impulsive swing points to measure from. Trying to force a Fibonacci tool onto a ranging chart will just give you weak, meaningless levels. For the best results, always apply the tool to charts with clear, trending price action and use other confirmations, like price action itself, to back up your analysis.
At Colibri Trader, we teach traders how to master price action to achieve consistent results, with or without indicators. If you're ready to build a trading strategy based on proven, repeatable patterns, discover how our educational programs can help you. Learn more at Colibri Trader.