


How to Calculate Win Rate in Trading a Practical Guide
On the surface, calculating your trading win rate seems simple enough: you divide the number of winning trades by your total number of trades, and then multiply that by 100. This spits out a percentage, and that's that.
But here's where so many traders get it wrong. That single number is just the beginning of the story, not the final chapter.
Why Win Rate Is a Trader's Most Misunderstood Metric
Have you ever had a string of winning trades, one after another, and felt like you couldn't lose? That feeling is intoxicating. Yet, when you check your account balance at the end of the month, it's barely budged. Worse, maybe it's even dropped.
This is a classic trap and it highlights a critical truth I've learned over years of trading: your win rate isn't a scorecard. It's a diagnostic tool, and without context, it’s practically useless.
A high win rate can give you a dangerous sense of false security, easily masking a deeply unprofitable strategy. On the flip side, a trader with what looks like a modest win rate can be incredibly profitable if they manage their trades correctly. The real skill is looking past the percentage and understanding how it fits with the other pieces of your trading puzzle.
Beyond the Basic Calculation
The formula itself isn't where the power lies. The real value comes from what knowing this number forces you to do next. It makes you ask the tougher, more important questions about your actual performance.
- Are my winners big enough to matter? A trader boasting a 70% win rate isn't going to last long if they only make $10 per win but lose $50 every time they're wrong. They'll bleed out, one small cut at a time.
- Is my strategy actually consistent? Does that shiny win rate hold up over hundreds of trades, or is it just the result of a lucky streak over the past twenty?
- Where am I really winning? Is your win rate the same across all markets? All times of day? All setups? Digging into this is how you find your true edge.
The goal isn't just to win often; it's to build a system where your wins comprehensively pay for your losses and still leave you with a healthy profit. This is the absolute foundation of a long-term trading career.
Let's break down the basic formula into its core parts for clarity.
Win Rate Formula At a Glance
The table below gives you a quick summary of the components needed to calculate your basic win rate.
| Component | Description | Example |
|---|---|---|
| Winning Trades | The total number of trades closed in profit. | 25 wins |
| Total Trades | The total number of trades taken (wins + losses + break-evens). | 50 trades |
| The Formula | (Winning Trades / Total Trades) x 100 | (25 / 50) x 100 = 50% |
As you can see, the math itself is straightforward. The challenge lies in what you do with this number.
The Sobering Reality of Trading Success
Let's be honest: achieving consistent profitability is tough. Many aspiring traders think they need at least a 50% win rate to make it, but the data shows very few actually get there.
This gap between expectation and reality is a major reason why only about 13% of day traders stay profitable after six months, and a tiny 1% can sustain it over five years.
But here's the encouraging part: a trader with a 40% win rate can absolutely be profitable if their average winning trade is significantly larger than their average losing trade. This is a concept you can explore more deeply by understanding your profit factor.
This idea of measuring performance isn't unique to trading. In the corporate world, professionals are constantly proving the value of your ROI on training to justify expenses. For us traders, understanding these core performance metrics is the first step toward building a trading plan that can actually withstand the realities of the market.
A Practical Walkthrough of Calculating Your Win Rate
Theory is one thing, but the real test is seeing how it applies to your own trading. Let's get our hands dirty and move from the abstract formula to the practical steps of tracking your actual performance. This is where you roll up your sleeves and get an honest, data-driven look at your price action strategies.
We’ll build a simple but powerful performance tracker using a hypothetical series of 20 trades. Imagine a price action trader who focuses on two main setups: pin bar reversals at key support/resistance levels and failed breakouts (bull/bear traps). The goal is to classify each trade correctly to get a real, actionable win rate.
Setting Up Your Trade Log
The foundation of any real performance analysis is a clean, organized trade log. You don't need fancy, expensive software for this—a simple spreadsheet in Google Sheets or Excel is more than enough to get the job done.
Start a new sheet and create these basic columns:
- Trade #: Just a simple sequential number for each trade (1, 2, 3…).
- Setup: The specific price action pattern you traded (e.g., "Pin Bar Reversal," "Failed Breakout").
- Outcome: The result of the trade. Keep it simple: Win, Loss, or Break-Even.
- P/L ($): The profit or loss from the trade in your currency.
This basic structure is all you need to start. For a more detailed approach, a proper trading journal is essential. You can learn more about building a great one in our guide on creating a trading journal in Excel.
A Sample Set of 20 Trades
Let's populate our log with a realistic mix of outcomes. A real-life trading journal would have more detail like entry prices, exit prices, and dates, but for calculating a basic win rate, all we really need is the final outcome.
Here’s a snapshot of our hypothetical 20 trades:
| Trade # | Setup | Outcome |
|---|---|---|
| 1 | Pin Bar Reversal | Win |
| 2 | Failed Breakout | Win |
| 3 | Pin Bar Reversal | Loss |
| 4 | Failed Breakout | Win |
| 5 | Pin Bar Reversal | Win |
| 6 | Failed Breakout | Loss |
| 7 | Failed Breakout | Loss |
| 8 | Pin Bar Reversal | Win |
| 9 | Pin Bar Reversal | Break-Even |
| 10 | Failed Breakout | Win |
| 11 | Pin Bar Reversal | Win |
| 12 | Pin Bar Reversal | Loss |
| 13 | Failed Breakout | Win |
| 14 | Pin Bar Reversal | Win |
| 15 | Failed Breakout | Loss |
| 16 | Failed Breakout | Win |
| 17 | Pin Bar Reversal | Win |
| 18 | Failed Breakout | Break-Even |
| 19 | Pin Bar Reversal | Loss |
| 20 | Failed Breakout | Win |
Alright, now we have our raw data. The next part is turning this simple log into a meaningful metric.
Calculating the Win Rate in a Spreadsheet
Sure, you could manually count wins and losses for a handful of trades, but that's inefficient and a recipe for errors as your log grows. This is where spreadsheet formulas become your best friend.
First, let's tally the outcomes from our sample data:
- Total Wins: 12
- Total Losses: 6
- Break-Even Trades: 2
- Total Trades Logged: 20
Now comes a crucial decision: what do we do with the break-even trades? For calculating your core win rate, it's standard practice to exclude break-even trades from the total count. Think about it—they weren't wins, but they weren't losses either. They don't really factor into the win/loss calculation.
This means our Total Trades for the formula isn't 20, but 18 (that's 12 wins + 6 losses).
The calculation is straightforward: (12 Wins / 18 Total Decided Trades) * 100 = 66.7%
Key Insight: Your win rate should reflect your performance on trades with a definitive outcome. Excluding break-even trades gives you a cleaner signal of how often your analysis leads to a profitable result versus a losing one.
Now, let's automate this in Google Sheets or Excel. Let’s assume your "Outcome" data is sitting in column C, from cell C2 down to C21.
Here is an example showing the COUNTIF function, which we will use.
This screenshot demonstrates the basic syntax of the COUNTIF function, which counts cells within a range that meet a specific criterion.
To calculate your total number of wins, find an empty cell and type in this formula:=COUNTIF(C2:C21, "Win")
To count your losses, do the same in another cell:=COUNTIF(C2:C21, "Loss")
To get your total decided trades (wins and losses), you can just add these two cells together. Or, if you prefer, use a single formula to count them both directly:=COUNTIF(C2:C21,"Win")+COUNTIF(C2:C21,"Loss")
Finally, let's put it all together to get your win rate percentage. Combine the formulas into one:=COUNTIF(C2:C21, "Win") / (COUNTIF(C2:C21,"Win")+COUNTIF(C2:C21,"Loss"))
Format that cell as a percentage, and you'll see 66.7%. Just like that, you have an automated system that updates in real-time as you log new trades.
To ensure you're calculating things accurately and can segment your trades for deeper analysis, implementing a robust options trading journal template is a crucial step that provides the necessary structure. This simple setup transforms your trading log from a static diary into a dynamic performance analysis tool, giving you the clarity needed to make smarter decisions.
Finding Your Edge by Segmenting Your Win Rate
A single, overall win rate is a good starting point, but let’s be honest—it’s a blunt instrument. It tells you if you're winning but offers zero clues as to why. This is where the pros separate themselves. They know the real edge is found by digging deeper and slicing their performance data into more specific, actionable categories.
This process, known as segmentation, is how you move from a vague idea of your performance to a precise understanding of your strengths and weaknesses. Think of it like a business owner who doesn't just look at total revenue. They analyze sales per product line, per region, and per marketing campaign to see what's really working.
For us traders, this means calculating win rates for different variables within our trading plan. This approach can reveal some seriously surprising patterns that a single, blended win rate would completely hide.
It boils down to a simple workflow: diligently log your trades, classify them based on your chosen criteria, and then calculate the specific win rate for each segment.
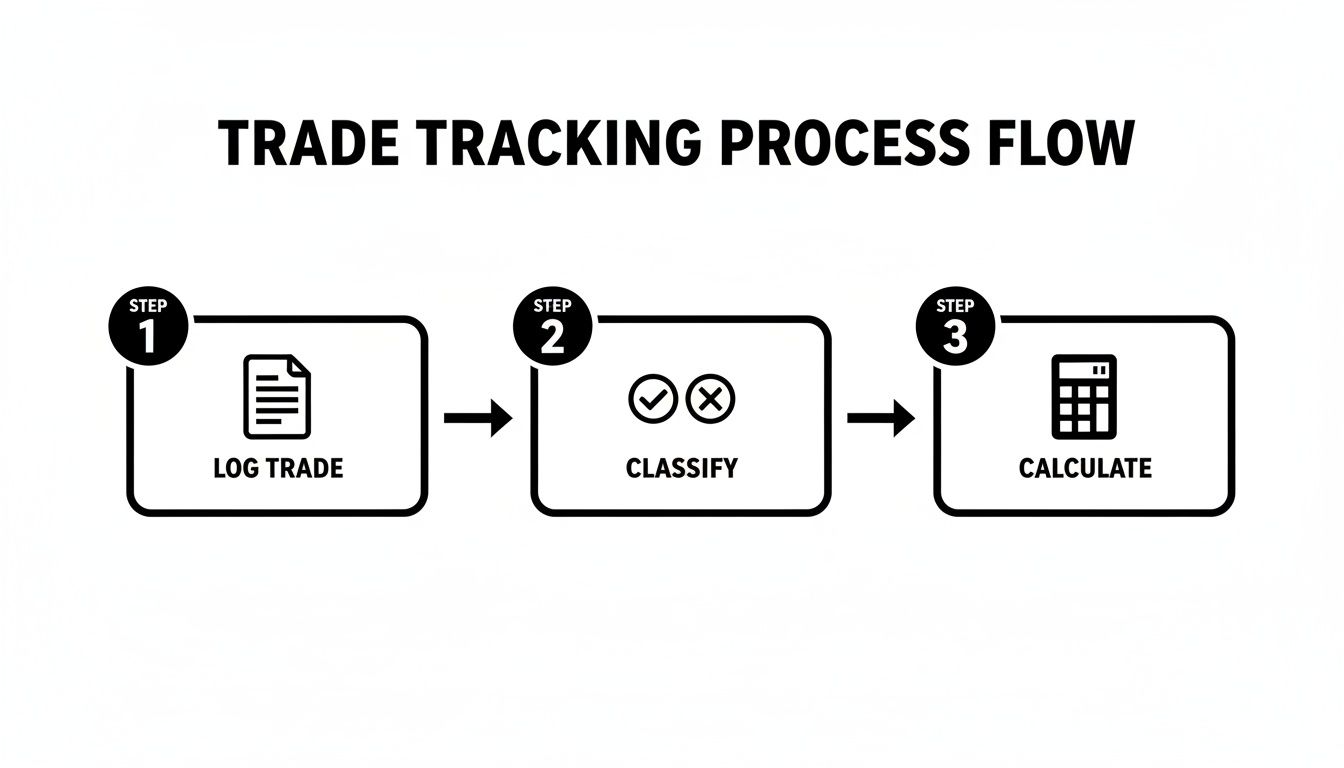
This visual really drives the point home: calculation is the final, easy step. The real work—the part that builds your edge—is in consistently logging and classifying your activity to generate meaningful data in the first place.
Calculate Win Rate Per Trading Strategy
Most of us don't rely on just one setup. You might have a go-to breakout strategy, a specific reversal pattern you love, and maybe a trend-following system for good measure. Each of these is a distinct system and absolutely must be judged on its own merits.
Calculating the win rate for each strategy is straightforward. Using the spreadsheet from the previous section, just add a "Strategy" column and tag each trade. From there, you can use the COUNTIFS function (with an 'S' at the end) to filter by both the outcome ("Win"/"Loss") and the strategy type.
For instance, to find the win rate for your "Breakout" strategy, the formula would look something like this:=COUNTIFS(C2:C100, "Win", D2:D100, "Breakout") / (COUNTIFS(C2:C100, "Win", D2:D100, "Breakout") + COUNTIFS(C2:C100, "Loss", D2:D100, "Breakout"))
This spits out a clear performance metric for that specific setup. You might discover your reversal strategy has a killer 75% win rate, while your breakout trades are barely hitting 40%. Now that's a powerful insight. It tells you exactly where to focus your capital and attention.
Analyze Performance by Asset or Market
Are you equally skilled at trading every instrument? I'd bet you're not. Most traders I know have a natural feel for certain markets while consistently getting chopped up by others.
Segmenting your win rate by asset can be a real eye-opener.
- EUR/USD: Perhaps this is your bread-and-butter, with a solid, consistent win rate.
- Gold (XAU/USD): Maybe its wild volatility just doesn't vibe with your style, leading to a much lower win rate.
- S&P 500 (SPX500): You might find your strategy performs exceptionally well during strong trending periods in indices.
By tracking this, you can make data-driven decisions to cut the assets that are draining your account and allocate more risk to the ones that are consistently paying you. You're no longer guessing; you're building your trading plan around hard evidence.
Uncover Patterns in Trading Sessions or Days
When you trade can have a massive impact on your results. Different market sessions—London, New York, Tokyo—all have distinct personalities, volatility levels, and participants. Your strategy might thrive in one and get torn apart in another.
Consider this scenario: a trader has a respectable 60% overall win rate. But after segmenting by the day of the week, they discover their win rate on Tuesdays is a dismal 20%. A single metric would have completely obscured this profit-draining leak in their performance.
This kind of insight is pure gold. It doesn't mean the strategy is broken; it just means it performs poorly under Tuesday's typical market conditions. The immediate, actionable fix? Stop trading that strategy on Tuesdays. This one small change could instantly boost overall profitability without altering anything else about the system. This is the practical power of calculating your win rate with precision.
Connecting Win Rate to Your Risk to Reward Ratio
This is where the numbers truly come to life. Nailing down your win rate is a great start, but here’s the thing: on its own, that number is almost meaningless.
The real secret sauce for long-term profitable trading is how your win rate meshes with another critical piece of your plan: your risk-to-reward (R:R) ratio.
Getting a handle on this relationship is what separates the traders who make it from those who don't. It's the reason a trader with a 40% win rate can build serious wealth, while another trader winning 70% of the time slowly bleeds their account dry.
I know, that sounds completely backward. Shouldn't winning more often automatically lead to more profit? Not always. The missing piece of the puzzle is the size of your wins and losses, which puts your win rate into the right context.
Introducing Trading Expectancy
To really bridge that gap between win rate and actual profitability, we need to talk about trading expectancy. This is the number that professional traders obsess over because it tells you, on average, what your trading system is actually worth over a long string of trades.
Expectancy pulls together four key data points from your trading journal: your win rate, your loss rate, your average win size, and your average loss size.
The formula is simple but incredibly powerful:
(Win Rate x Average Win) – (Loss Rate x Average Loss) = Expectancy
If you get a positive number, it means your system has a mathematical edge and is likely to make you money over time. A negative number means that no matter how often you feel like you're winning, the system is designed to lose.
How Different Trading Styles Can Both Win
Let's look at two totally different traders to see how they can both have a positive expectancy, even with wildly different approaches to the market.
Trader A: The High-Frequency Scalper
This trader is all about small, quick profits. Their game is built on precision, getting in and out fast, and racking up a high win rate.
- Win Rate: 70%
- Loss Rate: 30% (which is simply 100% – 70%)
- Average Win: $50
- Average Loss: $100
Let’s run the numbers on their expectancy:
(0.70 x $50) – (0.30 x $100) = $35 - $30 = +$5
This scalper has a positive expectancy of $5 per trade. Even though their average loss is twice as big as their average win, that high win rate more than makes up for it.
Trader B: The Patient Swing Trader
This trader is playing a different game. They're hunting for bigger market moves, holding positions for longer, and they've accepted they'll be wrong more often than not. Their edge comes from making sure their wins are massively larger than their losses.
- Win Rate: 40%
- Loss Rate: 60% (100% – 40%)
- Average Win: $300
- Average Loss: $100
Now for their expectancy calculation:
(0.40 x $300) – (0.60 x $100) = $120 - $60 = +$60
The swing trader has a huge positive expectancy of $60 per trade. They lose far more often than they win, but their system's structure ensures they come out way ahead in the long run. If you want to get a better handle on this, our guide on the risk to reward ratio is a great place to start.
The Key Takeaway: There is no single "good" win rate. The right win rate for you is whatever number, when combined with your risk-to-reward ratio, spits out a positive expectancy. Stop chasing wins and start building a system with a real mathematical edge.
The Real Mark of a Professional Trader
Focusing on expectancy is the true hallmark of a pro. They get that trading is a game of probabilities, not certainties. They don't ride an emotional rollercoaster with every single win or loss because they have faith that their edge will play out over hundreds of trades.
Look at the track records of legends like George Soros, who pulled in an average annual return of roughly 30% starting in 1970, or Peter Lynch, who maintained an average of 29.2% year-over-year. Their success was built on a deep understanding of market dynamics and superior risk management, not just chasing a high win rate.
When you shift your focus from just calculating a win rate to actively optimizing your expectancy, you stop being a scorekeeper and start acting like the strategic manager of your own trading business. It's one of the most important mindset shifts you can make on your journey.
Common Pitfalls to Avoid When Analyzing Your Win Rate
Figuring out your win rate is the easy part. The real challenge—and where I see so many traders go wrong—is interpreting that number correctly. A pretty-looking win rate can lie to you if you’re not aware of the common mental traps and calculation errors that can completely tank your analysis.
This isn’t just about number crunching; it's about developing the discipline of honest self-assessment. Getting this right means your data tells you the truth about your trading, not just the story you want to hear. A rock-solid trading system is built on reality, and that starts with dodging these costly mistakes.
The Danger of a Small Sample Size
This is the big one. A trader strings together five wins and suddenly feels like the king of the market, ready to double their risk. Then a few losses hit, and they're ready to scrap a perfectly good strategy.
Drawing huge conclusions from a tiny handful of trades is a classic rookie mistake. A win rate calculated from just 10 or 20 trades is statistically meaningless. It isn’t a true reflection of your edge; it’s just random market noise. You wouldn’t judge a pro baseball player’s career on a single game, so don’t make that mistake with your trading.
Professional Insight: I’ve found that you need a sample size of at least 100 trades per strategy before your win rate has any statistical weight. Anything less, and you're just guessing.
Making drastic changes based on a small data set is a recipe for disaster. You'll end up system-hopping constantly, never building confidence, and never truly knowing if you have a real edge. Be patient. Let the data build up before you pass judgment.
Ignoring the Hidden Costs of Trading
Your broker statement shows a trade closed for a small gain, but was it really a win? So many traders conveniently forget about the little deductions that bleed their accounts dry, giving them a completely warped view of their true performance.
The two biggest culprits are commissions and slippage.
- Commissions: These are the fees you pay your broker on every single trade. That $10 "winner" might only be a $5 net profit after round-trip commissions. Over hundreds of trades, this adds up and can crush your profitability.
- Slippage: This is the nasty gap between the price you thought you’d get and the price you actually got. In a fast-moving market or during a news spike, slippage can easily turn a small intended win into a break-even trade or even a tick-sized loss.
If you don't track these costs religiously, your win rate will be artificially inflated. You might think you have a 60% win rate, but after factoring in reality, it could easily drop to 55% or less. The only way to get a true picture is to log your net P/L for every single trade. No exceptions.
The Trap of Emotional Accounting
This one is subtle, but it's incredibly destructive. Emotional accounting is when you start bending the rules in your trading journal to avoid the psychological sting of a loss. It's a form of self-deception that makes you feel better now but absolutely destroys your ability to improve.
I see it show up in a few common ways:
- Ignoring a "Mental" Stop-Loss: You had a stop in mind but never placed the order. When the price blows right past it, you tell yourself it "doesn't count" as a real loss from your plan.
- Deleting "Bad" Trades: You take a revenge trade or a FOMO trade that breaks all your rules. When it inevitably blows up, you just delete it from your journal, pretending it never happened.
- Reclassifying Losses: Your trade hits its stop-loss, but you re-label it in your log as "break-even" because it "almost" made it back to your entry.
This kind of dishonest bookkeeping makes your win rate metric completely useless. Your trading journal has to be a sacred document of objective truth. Every trade—the good, the bad, and the ugly—gets recorded exactly as it happened. Without that brutal honesty, you have zero chance of finding the real leaks in your performance.
Common Questions on Trading Win Rate
As you start digging into your performance metrics, a few key questions always seem to surface. This is a good sign. It means you're moving past the basics and beginning to think like a professional trader. Let's tackle some of the most frequent (and important) questions that come up.
How Many Trades Do I Need for a Reliable Win Rate?
This is probably the most critical question of all, and the answer is simple: you need a lot more than you think. A win rate calculated from ten or twenty trades is just noise. It’s statistically useless.
Making any decisions about your strategy based on such a tiny sample is a classic mistake that can cost you dearly. It tells you nothing about your actual edge.
Most pros would agree you need a bare minimum of 100 trades per strategy to get a meaningful baseline. This sample size is large enough to start smoothing out random luck, giving you a glimpse into the real mathematical expectancy of your system. Without that kind of volume, you simply can't know if you're good or just lucky.
What Is a Good Win Rate for a Price Action Trader?
There is no single "good" win rate. Chasing a magic number is a fool's errand. The only thing that matters is how your win rate works together with your risk-to-reward ratio to produce a positive expectancy.
Here's how this plays out in the real world:
- A trend follower aiming for a 1:3 risk-to-reward ratio can be wildly profitable with just a 40% win rate. Their big winners more than make up for all the small losses.
- On the other hand, a scalper targeting a 1:1 risk-to-reward would need a win rate of 65% or higher just to cover commissions and make a consistent profit.
Forget about chasing a specific percentage. Focus on building a complete trading system where your win rate and your risk management are in sync.
How Should I Handle Break-Even Trades in My Calculation?
Break-even trades are a bit of a grey area, and traders handle them in a couple of different ways. The most important thing isn't which method you pick, but that you stick with it consistently.
The most common approach is to exclude break-even trades entirely. This gives you a clean win percentage based only on trades that had a clear profitable or losing outcome.
Another method is to count them as a small loss. The logic here is that the trade tied up your capital and exposed you to risk without generating any profit.
For simplicity, I recommend just excluding them. It keeps the focus squarely on the performance of your strategy when it produces a definitive win or loss.
The harsh reality of the forex market is a sobering reminder of why this stuff matters. Some statistics show that roughly two-thirds of retail forex traders lose money, with a staggering 85% failing to achieve long-term profitability. You can find more details on these forex trading statistics on BestBrokers.com. This just goes to show how crucial it is to not just calculate your numbers, but to understand what they mean within a disciplined, strategic framework.
At Colibri Trader, we teach a straightforward, price-action based approach to help you build a profitable trading system from the ground up. Our programs focus on discipline, money management, and proven patterns to help you find your edge in any market. Transform your trading performance and achieve consistent results today.